INTRODUCTION
Reactions to the same amount of alcohol may differ between individuals and among ethnic groups. One of the main symptoms of drinking is flushing, which is caused mainly by an accumulation of acetaldehyde. Genetic polymorphisms of alcohol dehydrogenase and aldehyde dehydrogenase (ALDH), the enzymes that metabolize alcohol, affect the process.1)
The expression of inactive ALDH2 isoenzyme, which is also called the Asian variation, is associated with decreased acetaldehyde metabolism. The difference in acetaldehyde metabolism between the allele enzymes can cause variations in alcohol metabolism among individuals.2-4) As a result, patients with the inactive ALDH can experience flushing, palpitations, nausea, and vomiting after drinking alcohol due to the accumulation of acetaldehyde.5) In contrast to the 2.9% to 21.4% of Westerners who exhibit flushing after drinking, the proportion in Asians is much greater at 60% to 80%,6-8) due to the fact that many Asians have significantly low ALDH2 gene activity.9)
The biological markers related to excessive drinking help clinicians to treat patients who drink excessively by serving as diagnostic and feedback data for patients. Among the biological markers, the liver enzyme gamma glutamyl transferase (rGTP) and carbohydrate-deficient transferrin (CDT) have been commonly used in the clinical field due to their high sensitivity in identifying patients who drink excessively.10) rGTP is an alcohol marker that directly reflects the level of damage in the liver. CDT can be presented as a quantitative value or as %CDT, which is a comparable quantification to the total amount of transferrin. The quantitative value may be affected by pregnancy, anemia, or liver disease, whereas the sensitivity and specificity of %CDT is unaffected by these conditions. Therefore, %CDT is considered an excellent biological marker.11)
Considering the fact that rGTP and %CDT are effective biological markers, and given that many Asian people show flushing after drinking, it is relevant to investigate the relationship between the volume of alcohol consumed and these alcohol biomarkers with post-alcohol flushing, as individuals who show facial flushing may be more sensitive to alcohol. However, few studies have addressed this topic. The present study was conducted to investigate the differences between flushers and non-flushers in weekly level of alcohol consumption required to induce abnormal increases in rGTP and %CDT levels.
METHODS
1. Subjects
Participants were 374 adult male drinkers who visited the department of Family Medicine of Chungnam National University Hospital for health visits between January and December 2010. The subjects were limited to those who had negative hepatitis B surface antigen and anti-hepatitis C virus tests and had no abnormalities on radiographic studies, such as hepatic masses, biliary tract disease, or evidence of hepatic cirrhosis. The patients must not have been taking any medications during the previous month. The institutional review board of Chungnam National University Hospital approved this study (IRB number: 2012-004-04).
2. Data Collection
Basic data, including history of alcohol intake and alcohol markers (rGTP and %CDT), were obtained from medical records. The level of CDT was measured through %CDT immunonephelometry using N Latex CDT Kit (Siemens, Marburg, Germany).12) The reference values of %CDT were recommended as 1.19 to 2.47 by a study that targeted 561 healthy adults in whom an elevated level of alcohol consumption had been excluded.13) The usefulness of %CDT among Korean males has already been studied.14) The level of rGTP was measured through TBA-200FR NEO (Toshiba, Tokyo, Japan), with the reference values of 0 to 50 U/L in males recommended by the department of laboratory medicine of Chungnam National University Hospital.
Age, weight, body mass index (BMI), and cigarette use were assessed. Patients were classified as smokers, past-smokers, and non-smokers. The alcohol consumption per week was calculated by drinks in a day and the number of drinking days per week. One drink was set as 14 g of alcohol, according to the guideline suggested by the National Institute on Alcohol Abuse and Alcoholism (NIAAA).15)
Subjects were asked to indicate the frequency with which they experienced facial flushing after drinking an alcoholic beverage (always, sometimes, or never). Subjects were divided into two groups based on their responses: those who checked 'always' were classified as the flushing group, and those who checked 'sometimes' or 'never' were classified as the non-flushing group. This classification was based on research carried out by Higuchi et al.,16) which demonstrated that nearly all subjects (85.7%) who reported flushing after every drink had inactive ALDH2, whereas most of those (85.7% to 96.2%) who reported flushing sometimes or never had the active isozyme. These results suggest that facial flushing may be a good indicator to differentiate between the active and inactive ALDH2 phenotype.
3. Statistical Analysis
The age, BMI, weight, number of drinking days per week, alcohol consumed per drinking day, and alcohol consumed in a week among the flushing and non-flushing groups were compared by independent t-tests. The smoking status of the two groups was compared using the chi-square test. The relationship between alcohol consumption per week and rGTP and %CDT was investigated in the two groups using the Pearson correlation coefficient. The cut-off value for alcohol consumption per week required to induce abnormalities in rGTP (>50 U/L) and %CDT (>2.47) was obtained by using the receiver operating characteristic (ROC) curve. The sensitivity, specificity, positive predictive value, and negative predictive value of the drinking level per week for predicting abnormal levels of %CDT and rGTP were investigated. The difference in area (difference between areas) between the two groups was assessed by comparing areas under independent ROC (AUROC) curves. Window SPSS ver. 13.0 (SPSS Inc., Chicago, IL, USA) and Windows MedCalc ver. 12.1.0.0 (MedCalc, Broekstraat, Belgium) were used for statistical analysis, with a value of P < 0.05 regarded as statistically significant.
RESULTS
1. General Characteristics of Research Participants
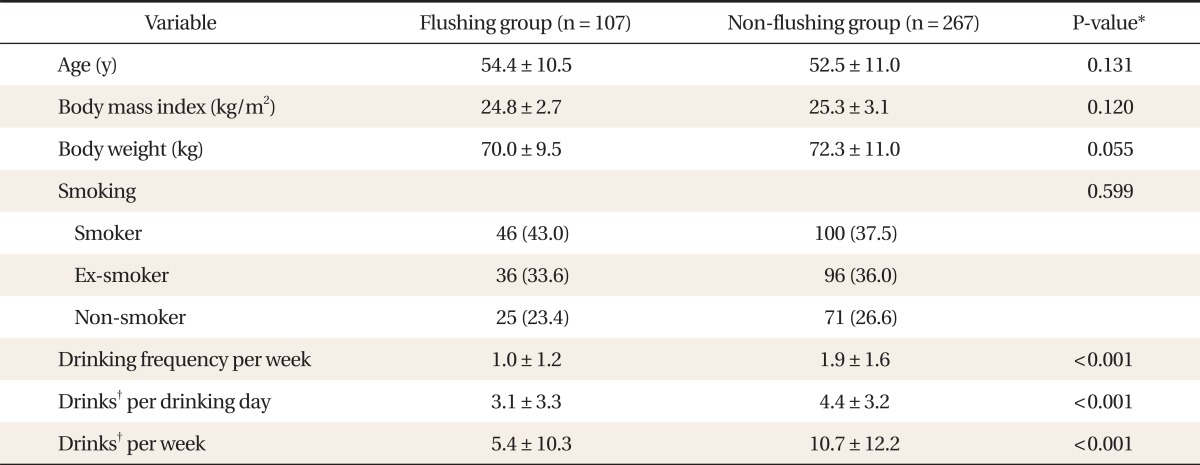
The mean ┬▒ SD age, BMI, and weight of the flushing group were 54.4 ┬▒ 10.5, 24.8 ┬▒ 2.7 kg/m2, and 70.0 ┬▒ 9.5 kg, respectively, and those of the non-flushing group were 52.5 ┬▒ 11.0, 25.3 ┬▒ 3.1 kg/m2, and 72.3 ┬▒ 11.0 kg, respectively. There were no significant differences in age, BMI, and weight between the two groups. Regarding smoking status, the flushing group included 46 current smokers (43.0%), 36 past smokers (33.6%), and 25 non-smokers (23.4%). The non-flushing group included 100 current smokers (37.5%), 96 past smokers (36.0%), and 71 non-smokers (26.6%). There was no significant difference in cigarette use between the two groups. The drinking frequency (mean ┬▒ SD) per week was significantly (P < 0.001) higher in the non-flushing group (1.93 ┬▒ 1.58) than in the flushing group (1.03 ┬▒ 1.20 times), as were alcohol consumption per drinking day (mean ┬▒ SD) (4.42 ┬▒ 3.23 vs. 3.07 ┬▒ 3.27 drinks) and number of drinks per week (10.68 ┬▒ 12.16 vs. 5.43 ┬▒ 10.26 drinks, respectively) (Table 1).
2. The Correlation between Drinking Level per Week and Biological Markers (%CDT and rGTP)
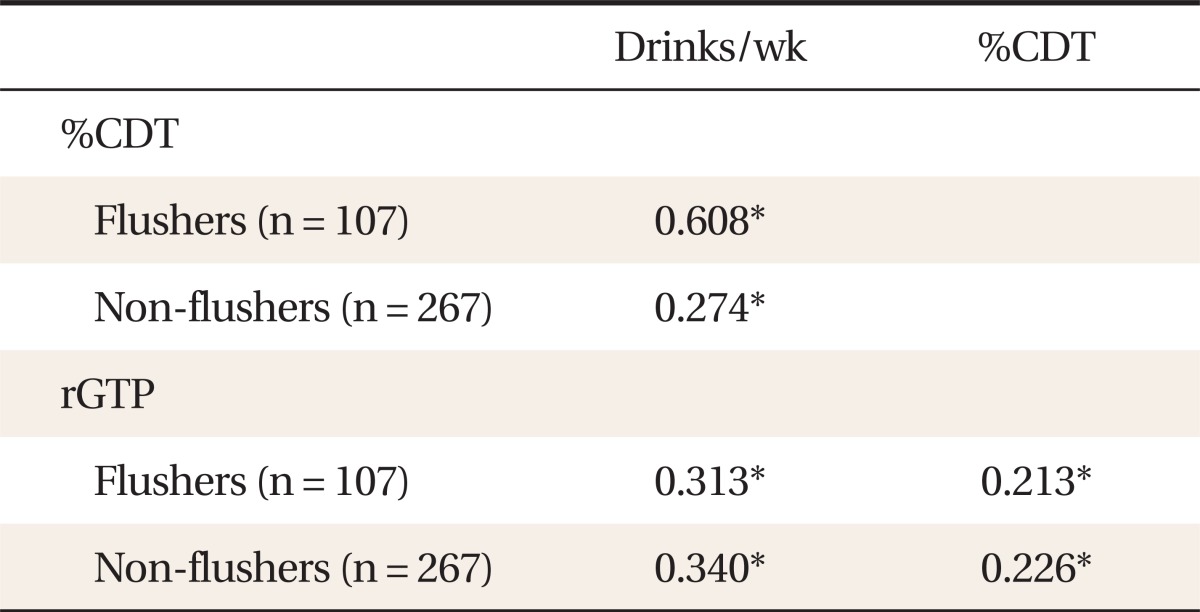
In the flushing group, drinking level per week was significantly correlated with %CDT (P < 0.010, r = 0.608) and rGTP (P < 0.010, r = 0.313) levels. These correlations were also significant in the non-flushing group (%CDT, P < 0.010, r = 0.274; rGTP, P < 0.010, r = 0.340). Additionally, there was a significant correlation between %CDT and rGTP in both groups (P < 0.010, r = 0.213; P < 0.010, r = 0.226, respectively) (Table 2).
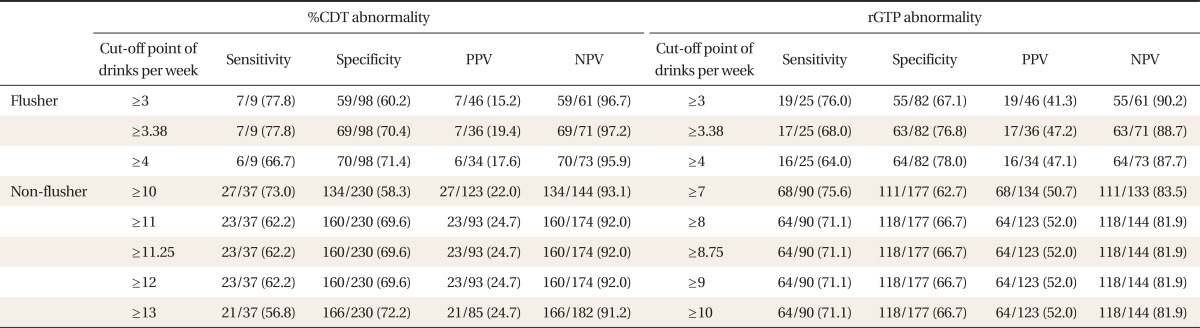
3. The Cut-off Values, Sensitivity, Specificity, Positive and Negative Predictive Values, and AUROC of Alcohol Consumption per Week Required to Induce Abnormal Level of Biological Markers
Based on the ROC curve, the appropriate cut-off value of drinking amount per week necessary to induce abnormal %CDT was 3.38 drinks in the flushing group and 11.25 drinks in the non-flushing group. After application of the cut-off value in the flushing group, the sensitivity, specificity, and positive and negative predictive values of drinking level per week to induce abnormal %CDT were 77.8%, 70.4%, 19.4%, and 97.2%, respectively. The values for the non-flushing group were 62.2%, 69.6%, 24.7%, and 92.0%, respectively.
The appropriate cut-off value of alcohol consumption per week required to induce abnormal rGTP was 3.38 drinks in the flushing group and 8.75 drinks in the non-flushing group. After application of the cut-off value in the flushing group, the sensitivity, specificity, and the positive and negative predictive values of alcohol consumption required to induce abnormal rGTP were 68.0%, 76.8%, 47.2%, and 88.7%, respectively. The figures for the non-flushing group were 71.1%, 66.7%, 52.0%, and 81.9% (Table 3).
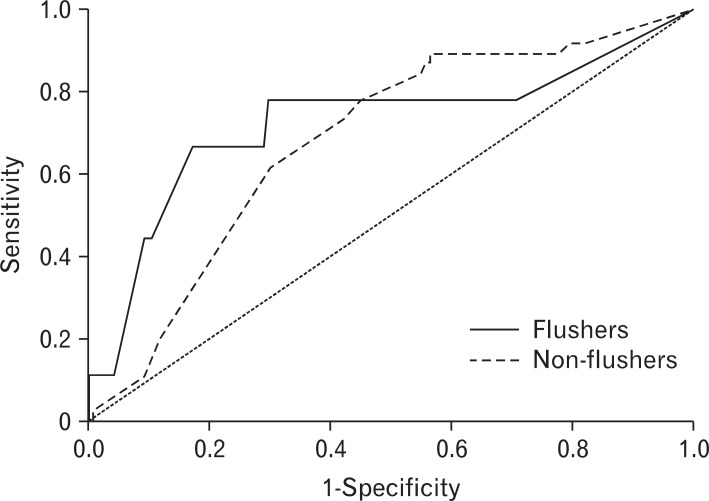
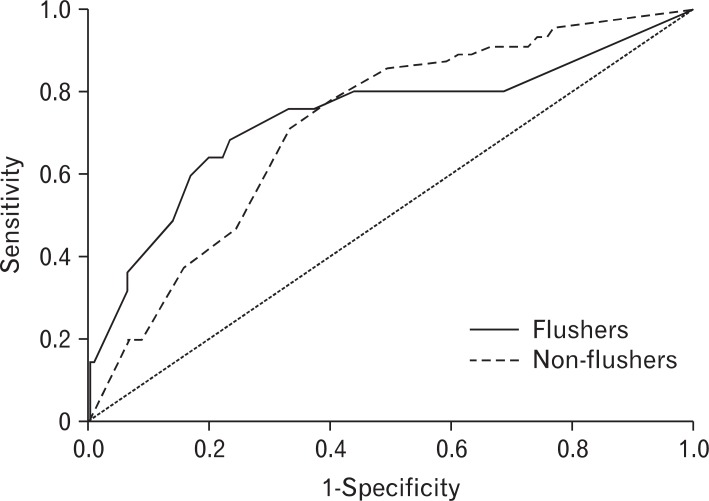
The AUROC (95% confidence interval) for drinks per week necessary to induce abnormal %CDT was 0.726 (0.512-0.939) in the flushing group, and 0.684 (0.596-0.771) in the nonflushing group. There was no statistically significant difference in the AUROC between the two groups (Figure 1). The AUROC of drinks per week necessary to induce abnormal rGTP was 0.738 (0.610-0.867) in the flushing group and 0.718 (0.655-0.781) in the non-flushing. There was no significant difference in the AUROC between the two groups (Figure 2).
The level of rGTP has been known to be influenced not only by alcohol consumption but also other factors such as abdominal obesity, metabolic syndrome, etc. Therefore, we further analyzed the cut-off value of alcohol consumption inducing abnormal rGTP levels according to the presence of metabolic syndrome. Among the 374 subjects, 72 individuals met the National Cholesterol Education Program criteria17) for metabolic syndrome. The cut-off value of alcohol consumption was slightly higher in the subjects with metabolic syndrome (6.75 drinks) than the subjects without metabolic syndrome (5.5 drinks). The tendency of lower cut-off level of alcohol consumption in flushers was also observed in subjects without metabolic syndrome (2.75 drinks in flushers, 8.75 drinks in non-flushers) as well as in subjects with metabolic syndrome (4.0 drinks in flushers, 8.75 drinks in non-flushers).
DISCUSSION
In the West, levels of moderate drinking and at-risk drinking have been suggested based on the results of numerous studies. However, such levels of drinking may not be appropriate when applied to Asians, who are physically smaller in size and more frequently have inactive ALDH2. Unfortunately, few studies have investigated a moderate level of drinking applicable to Korean people. In the current study, we attempted to investigate whether any differences exist in the alcohol consumption per week required to induce abnormalities in biological markers (%CDT and rGTP) in relation to the presence of alcohol-induced facial flushing.
To objectively evaluate excessive drinking, biological markers including liver enzyme levels have been used, but no ideal biological indicators that reflect excessive drinking exist.18) The traditional biological markers indicating excessive drinking are AST, ALT, rGTP, and %CDT, and the American Psychiatric Association19) recommends that %CDT and rGTP are the most pertinent biological indicators of drinking level. Hence, %CDT and rGTP were selected as the alcohol markers for the present study. In the results of our study, there was a difference in the cut-off value of amount of alcohol per week that induces alcohol marker abnormalities based on the presence or absence of the flushing response with alcohol intake. In non-flushers, the optimal cut-off level where the sum of sensitivity and specificity values is maximal was suggested as 11.25 drinks for %CDT and 8.75 drinks for rGTP in the present study. These findings differ from the level of > 14 drinks of alcohol per week identified as indicating heavy drinking by the NIAAA15) for Westerners. In interpreting the results of the current study, it should be considered that the average Korean body size (mean weight 69.7 kg, height 169.7 cm in adult men aged Ōēź 30 years)20) is smaller than that of Westerners (mean weight 86.1 kg, height 175.8 cm in adult men aged Ōēź 20 years).21) This result implies the need for further studies to determine lower levels indicative of heavy drinking in Koreans. In clinical practice, based on the cut-off point where consumption results in abnormal %CDT or rGTP in our study, Ōēź8 drinks may be considered heavy drinking for the non-flushing group of Korean ethnicity.
In contrast, the optimal cut-off level for drinking that provokes either %CDT or rGTP abnormality in the flushing group was suggested as 3.38 drinks, which was much lower than the level for the non-flushing group. That is, a lower volume of alcohol caused an increase in the biological markers of alcohol in the flushing group, likely due to an increase in alcohol and acetaldehyde. It has been well known that the accumulation of alcohol and acetaldehyde increases the activity of sialidase and decreases glycosyltransferase,22,23) resulting in inhibition of the bond between carbohydrate and transferrin. Furthermore, it has been documented that liver damage caused by acetaldehyde is more significant in the flushing group than in the non-flushing group.24) Thus, the drinking level per week for rGTP must be lower in the flushing group than in the non-flushing group as well. Based on the results of our study, i.e., the cut-off point for inducing abnormality in %CDT or rGTP, Ōēź 3 drinks is thought to be equivalent to heavy drinking in Korean males with alcohol-induced flushing in clinical practice. The results of the current study showing that %CDT has a higher specificity and lower sensitivity compared to rGTP in both flushers and non-flushers correspond well to those of earlier studies.25-27)
In conclusion, the results of the current study showing that subjects with alcohol-induced facial flushing are more vulnerable to alcohol coincides with the results of previous research, which indicated that the amount of alcohol that causes insulin resistance and metabolic syndrome is significantly lower in the flushing group.28,29) Furthermore, the results of our study support earlier studies showing that esophageal cancer is more likely to occur in the flushing group.30,31) People who have an ALDH polymorphism associated with the flushing syndrome are commonly seen in Asia, including Korea. Many flushers are drinkers in spite of potential hazards from drinking. From a physician's point of view, this is an important issue in Korea. It may be partly attributable to Korea's drinking culture, which emphasizes the importance of a sense of belonging and kinship that comes from social drinking. Therefore, focusing more on education regarding the dangers of heavy drinking and considering individual variety including facial flushing is recommended in Korean clinical practice.
The limitations of this study should be addressed. First, this was a retrospective study. Second, this study included only male patients. Further research is required to analyze female drinkers. In addition, as shown in the results of our study, rGTP is thought to be less sensitive to alcohol consumption in subjects with metabolic syndrome. Further studies, including prospective designs, are needed to investigate the relationship between rGTP and alcohol consumption among individuals with metabolic syndrome. Despite these limitations, our research is still meaningful because it highlights the need for further study on the appropriate level of drinking for Koreans.