INTRODUCTION
Metabolic syndrome (MetS) is characterized by the presence of dyslipidemia, hyperglycemia, elevated blood pressure, and abdominal obesity. Due to sedentary lifestyle and obesity, MetS has become one of the most common health issues globally [1]. Approximately 20%–30% of adults in several countries have MetS [2]. Numerous studies have shown that patients with MetS are more likely to develop diabetes mellitus and cardiovascular disease and die prematurely. Thus, the high prevalence of MetS has become a serious concern [3].
MetS is thought to be correlated to a chronic low-grade inflammatory response, which is characterized by overt cytokine production and inflammatory signaling pathways [4]. It is also believed to be associated with obesity, adipokines, and insulin resistance [5-7]. However, there has been a controversy regarding the cause and effect interrelationships and the extent of contribution of each factor, and to date, the exact pathway associated with the condition has yet to be explained.
To the best of our knowledge, a national study evaluating the difference in the risk of MetS in terms of elevated C-reactive protein (CRP) level between obese and non-obese participants has not been conducted, and only a few international studies that included western populations have been carried out. In addition, most of these studies are not stratified by gender. Results have been scattered and are controversial. Thus, in this study, we aimed to investigate (1) the relationship between high-sensitivity CRP (hs-CRP) and MetS and (2) whether the relationship is different between obese and non-obese men and women in a representative Korean population.
METHODS
1. Study Participants
The Korea National Health and Nutrition Examination Survey (KNHANES) is a nationwide health and nutrition survey conducted annually by the Korea Centers for Disease Control and Prevention (KCDC) to identify the general health behaviors and status of the South Korean population, the incidence of common chronic diseases, and comprehensive nutritional data [8]. Between 2013 and 2015, the 6th KNHANES annually surveyed 3,840 households in 192 regions, which were representative of the Korean population. Recruitment of the participants was conducted using a stratified, multistage cluster sampling method utilizing sampling units and households as 1st and 2nd sampling units. Sampling units were chosen based on residential condition and geographical area, and then, 20 households from the units were selected using a systematic sampling method. Representability was ensured by assigning weight values to each participant for an equal probability of sampling.
Health and nutrition surveys as well as physical examinations of the household members were carried out, and each member had different age restrictions. Hs-CRP and serum insulin levels were only measured in 2015. In this study, we excluded participants aged 40 years and older with cancer, cardiovascular diseases (myocardial infarction and stroke), chronic kidney disease, pulmonary disease (chronic obstructive pulmonary disease, asthma, and tuberculosis), liver disease (hepatitis B and C virus and liver cirrhosis), white blood cell (WBC) count >10,000/mm3, and CRP level >10 mg/L (possible acute infection). The median age of the participants was 56 years (range, 40–79 years). Finally, of the 7,380 participants, 3,013 were included in this national survey.
2. Data Collection
1) Survey
All participants who participated were asked to sign an informed consent before data collection. Health surveys and physical examinations were conducted at mobile medical centers, and interviews were performed by trained interviewers. Based on the results, we categorized income as high, upper-medium, lower-medium, and low and education as below elementary school, middle school graduate, high school graduate, and above college graduate. We defined current drinkers as those who consumed alcohol more than once within the last month; smokers as current smokers (excluding ex-smokers); and moderate or vigorous physical activity (as compared to inactivity) as those who engaged in more than 2.5 hours of middle-strength exercise or 1.25 hours of high-strength exercise, or in mixed exercise that is equivalent to the former (1-minute high-strength=2-minute middle-strength) in a week.
2) Anthropometric data
Physical examinations were performed by trained medical staff in accordance to standardized procedures. Weight and height were measured while the participants were wearing light clothing without shoes, and each were measured to the nearest 0.1 cm and 0.1 kg. Body mass index (BMI) was calculated according to the height and weight measurements: BMI=body weight (kg)/height (m2). Waist circumference was measured to the nearest 0.1 cm at the midpoint between the midaxillary lower end of the last rib and the upper rim of the iliac crest after the participants exhaled.
Blood pressure was manually measured 3 times at 30-second intervals using a mercury sphygmomanometer (Baumanometer Desk Model 0320; WA Baum Co., Copiague, NY, USA) after resting for a minimum of 5 minutes in sitting position. The average value of the 2nd and 3rd measurements was recorded.
3) Laboratory measurements
Venous blood samples were collected after a minimum of 8-hour fasting and were processed, immediately refrigerated, and placed in a cold storage while being transported to the central laboratory within 24 hours. Serum high-density lipoprotein (HDL) cholesterol level was measured using the homogeneous enzymatic colorimetric method, and triglyceride (TG) and glucose levels were obtained using the enzymatic and hexokinase ultraviolet methods utilizing the Hitachi Automatic Analyzer 7600-210 (Hitachi, Tokyo, Japan), respectively. Serum insulin level was measured using ECLIA (electrochemiluminescence immunoassay), and hs-CRP level was measured with immunoturbidimetry using the Cobas 8000 (Roche, Mannheim, Germany). WBC count was measured with flow cytometry using semiconductor lasers on the XE-2100D (Sysmex, Kobe, Japan) from 2013 to 2014 and the XN-9000 (Sysmex) in 2015.
3. Definition of Metabolic Syndrome and Obesity
MetS was defined according to the National Cholesterol Education Program Adult Treatment Panel III (NCEP-ATP III) criteria, with the exception of abdominal obesity based on waist circumference [9]. We used the modified waist circumference cutoff point of >90 cm for men and >85 cm for women in this study [10]. Accordingly, in this study, individuals who meet three or more of the following criteria were defined as having MetS: (1) waist circumference >90 cm for men or >85 cm for women, (2) high blood pressure (≥130/85 mm Hg) or intake of antihypertensive medications, (3) elevated fasting glucose level (≥100 mg/dL) or use of antidiabetic agents or insulin, (4) low HDL-cholesterol (HDL-C) level (<40 mg/dL for men or <50 mg/dL for women), and (5) hypertriglyceridemia (hyperTG ≥150 mg/dL). Obesity was defined as a BMI ≥25.0 kg/m2 [11].
5. Statistical Analysis
Statistical analyses were performed using the IBM SPSS software ver. 23.0 (IBM Corp., Armonk, NY, USA). During the KNHANES, the KCDC used a complex sample design for unequal selection probabilities, stratification, and clustering. Sampling weights reflected non-response rate, post-stratification, and complex sample design. The composite sample weight was introduced into our analyses to provide representative estimates of the non-institutionalized Korean population. Natural log transformations were performed for hs-CRP level and HOMAIR score to approximate normality.
We used the Rao-Scott chi-square test for categorical variables and analysis of variance (ANOVA) for continuous variables to evaluate the demographic characteristics of the population. Student t-test was used to analyze the mean CRP level, and ANOVA was utilized to obtain the mean HOMA-IR score according to the components of MetS and quartiles of hs-CRP level, respectively. Multivariate logistic regression was used to estimate the odds ratios (ORs) for MetS and its components after adjusting for age, smoking, drinking, physical activity, education, income, and BMI in the final model. Statistical tests were twosided, and a P-value <0.05 was considered statistically significant.
RESULTS
1. Characteristics of the Participants
The clinical characteristics of the four groups are shown in Table 1. Waist circumference, systolic and diastolic blood pressure, fasting glucose level, and TG level were higher in the obese groups than in the non-obese groups, and men had higher values than women. The HOMA-IR score and hs-CRP level were highest in obese women and lowest in non-obese women. Approximately 11.0%, 50.0%, 8.4%, and 48.8% of non-obese men, obese men, non-obese women, and obese women presented with MetS, respectively (P<0.001 for all aforementioned).
2. Distribution of High-Sensitivity C-Reactive Protein Level Based on the Presence and Absence of Each Component of MetS, MetS, and Insulin Resistance
The mean hs-CRP levels were higher in the presence of MetS or insulin resistance (HOMA-IR score ≥2.5) in all four groups. In both nonobese groups, hyperTG, low HDL-C level, and high fasting glucose level yielded higher hs-CRP level. Moreover, non-obese women showed a higher hs-CRP level and high blood pressure (P<0.001), while nonobese men did not. In both obese groups, abdominal obesity correlated to higher hs-CRP level. Obese women showed higher hs-CRP level and hyperTG (P<0.05), and obese men had a high blood pressure (P<0.001) (Table 2).
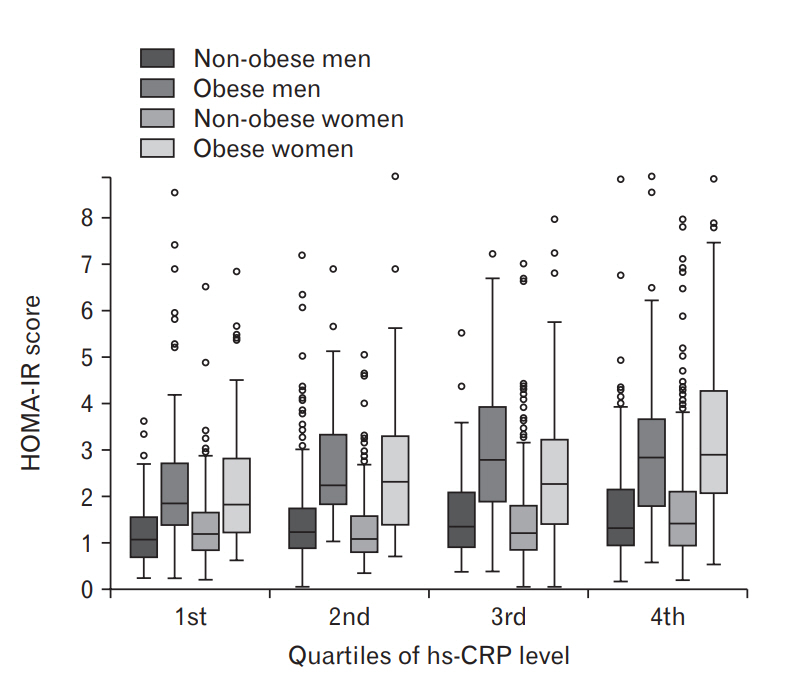
3. Distribution of Homeostatic Model Assessment of Insulin Resistance Score according to the Quartiles of High-Sensitivity C-Reactive Protein
The range and median of the HOMA-IR score are shown by the quartiles of hs-CRP in Figure 1. In all four groups, the median value and upper inner fence showed a general tendency toward a gradual linear increase with each increasing quartile. The median and range of the HOMA-IR score is higher in the obese group than in the non-obese group in terms of all quartiles for both genders. The mean HOMA-IR score for those in the 1st, 2nd, 3rd, and 4th quartiles of hs-CRP level were 1.26, 1.42, 1.57, and 1.81 for the male non-obese group (Ptrend=0.001) and 2.21, 2.66, 3.27, and 3.18 for the male obese group (Ptrend <0.001) as well as 1.32, 1.34, 1.45, and 1.74 for the female nonobese group (P-trend <0.001) and 2.45, 2.50, 2.92, and 3.55 for the female obese group (P-trend=0.006), respectively. Thus, a dose–response relationship could be inferred across all the quartiles of hs-CRP level and HOMA-IR score, regardless of gender or obesity status.
4. Association between High-Sensitivity C-Reactive Protein Level as well as Metabolic Syndrome and Its Components
The ORs of MetS and its components according to the quartiles of hs-CRP level are shown in Table 3 using the 1st quartile as reference. In non-obese women, a higher risk for MetS (4th quartile: 2.63, 1.28–5.39), hyperTG (4th quartile: 1.90, 1.08–3.35), and low HDL-C level (2nd quartile: 1.76, 1.18–2.61 and 4th quartile: 3.54, 2.29–5.48) was observed. In obese women, an increased risk was also identified for MetS (3rd quartile: 3.87, 1.55–9.64 and 4th quartile: 2.57, 1.08–6.09), low HDL-C (3rd quartile: 5.07, 1.71–15.06 and 4th quartile: 3.21, 1.16–8.90), and abdominal obesity (4th quartile: 2.84, 1.16–6.96) (P-trend <0.05 for all aforementioned). In non-obese men, associations between hyper-TG, low HDL-C level, and high fasting glucose level were found. Meanwhile, in obese men, the risk for high blood pressure was noted. However, no significant relationship was observed between the risk for high blood pressure and MetS or stepwise gradient (P-trend not significant).
DISCUSSION
In Korea, data from the KNHANES indicate that the prevalence of MetS increased from 24.9% in 1998 to 31.3% in 2007 among Korean adults [13], and based on our study, it further increased to 34% in the middle-aged and elderly population in 2015. The overall prevalence of MetS is higher in obese individuals. However, not all obese individuals present with a clustering of metabolic and/or cardiovascular risk factors. Moreover, lean individuals also present with the features of MetS [14]. The exact mechanism in which MetS develops in certain individuals and not in others is not yet understood, and it is a subject of debate. The biggest known pillars are (visceral) adiposity and insulin resistance, which are both interrelated. Adipose tissue releases excess free fatty acids (FFA), adipokines, and angiotensin II. FFA and angiotensin II inhibit muscular glucose uptake and damages the pancreas, which leads to insulin resistance. Excess FFA and hyperglycemia leads to hyperTG, which in turn decreases HDL-C level. Angiotensin II has vasoconstrictive effects that increases blood pressure and adipokines, such as tumor necrosis factor-a (TNF-a), and interleukins induce inflammatory reactions that also inhibit insulin and induce hypertension and endothelial dysfunction in a vicious cycle [3]. In more recent studies, low-grade chronic inflammation (CRP level <10 mg/L) has independently increases the risk of cardiovascular diseases [15], including MetS, and have been proposed as a method to improve risk prediction.
Only a few studies have evaluated the difference in the relationship between hs-CRP level and MetS in obese and non-obese individuals. However, the results are controversial. Meanwhile, national studies have not been conducted. In addition, among these studies, only few were stratified by gender; most were adjusted for gender, and only one was stratified by sex. This study was conducted to evaluate the relationship between MetS and hs-CRP level and to identify a difference in the association between these four groups: obese and non-obese men and women.
Our study showed that hs-CRP level plays a major role in the development of MetS independent of adiposity in women. A positive association was found between hyperTG and low HDL-C level in both obese and non-obese women across the quartiles of hs-CRP level, and no significant change was observed in terms of the risks after adjusting for BMI. However, in men, after adjusting for BMI, the strong positive associations between hs-CRP level and hyperTG, low HDL-C, high fasting glucose level, and MetS (data not shown) were attenuated and some were annulled. Although hyperTG and low HDL-C level mildly increased the risk in terms of the higher quartiles of the non-obese participants and high blood pressure in obese individuals, no statistically significant linear tendency was observed in our final model that included BMI. Our finding is in accordance with those of the study on Mexicans by Han et al. [16] that was stratified by gender and adiposity. Pradhan et al. [17] have also found that hs-CRP level is independently associated with hyperinsulinemia in both overweight and lean Caucasian women. However, men were not included in the study. Our data also suggests a linear gradient relationship between hs-CRP level and insulin resistance (surrogated by the HOMA-IR score) in all genders and obesity status, which is in accordance to the results of prior studies [18]. Thus, in men, BMI or adiposity may play the most significant role in the pathogenesis of MetS.
Studies regarding the relationship between inflammation and MetS have shown inconsistent results, particularly when stratified by gender and/or adiposity. Several recent studies have shown that subclinical inflammation plays an independent role in MetS. However, several studies have also shown attenuation or disappearance of significant associations after adjusting for adiposity or insulin resistance. In terms of obesity status, our study showed results similar to those of several other studies. In women and men before adjusting for BMI, similar associations were observed in both obese and non-obese individuals in studies conducted by Laaksonen et al. [19], McLaughlin et al. [20], and Stenholm et al. [21] Other studies have shown varying amounts of association depending on obesity status, of which some are positive correlated to BMI and some are not [7,16,22-25].
Previous studies on the relationship between inflammation and MetS/insulin resistance based on gender differences were also controversial, although most studies showed stronger associations in women than in men, which is similar our result [26]. For example, Hoekstra et al. have found that CRP was associated with the components of MetS in elderly Dutch obese women but not in non-obese women, and similar but less pronounced results were shown in men [15]. Moreover, Lai et al. have shown that hs-CRP level may be important in the development of MetS, particularly in women [27]. Ryu et al. [6] has conducted a study on 1,578 Koreans from rural areas in 2006, and results showed that hs-CRP level was associated with MetS only in men but not in women, which is in contrast to our study result. However, the participants who took voluntary health examinations were from rural areas; thus, it was not a proper representative sample of Koreans.
There are several possible explanations behind our observation. First, subclinical inflammation may have a greater role in inhibiting the actions of insulin in women due to differences in sex hormones. For instance, inflammation may interact with female sex hormones and reduce the protective effects of estrogen on fat distribution and insulin action. Previous studies have shown that cytokines may interfere with estradiol secretion [28], and oral estrogen may increase CRP levels [29]. Second, a higher number of female participants was analyzed, thus obtaining greater statistical power. Third, hs-CRP level could be merely a reflection of other more potent visceral adipokines, as similar as BMI in women have more fat mass and abdominal distribution, thus more interleukin-1, interleukin-6, and TNF-a are released, which do not only induce the hepatic synthesis of CRP but also various inflammatory effects [30]. In relation to this, visceral adipocytokines are more potent, and they cause chronic inflammation compared to other inflammatory mediators. Fourth, while we divided the quartiles of CRP separately for obese and non-obese participants, most studies used a common division of CRP, such as the study by Ye et al. [7], and this indicates that our model was more detailed and intricate. Finally, since there were no studies on the Korean population, it might be due to a racial/genetic difference in the predisposition to MetS.
Our study has several strengths. To the best of our knowledge, this is the first large-scale, population-based study that investigated CRP distribution and its relation with updated NCEP-ATP III criteria for MetS among obese and non-obese individuals in Korea, and this study is among the few studies that were additionally stratified by gender worldwide. In addition, most confounding factors for the risk of MetS in this study were cautiously taken into consideration. The present study used the most recent data. However, the present study also had some limitations. CRP levels differ in terms of anti-inflammatory drugs and diet, which could not be considered due to limitations in research data. Moreover, total body fat mass or body fat composition based on the total or visceral depots was not evaluated for the same reason; Thus, a discrimination of lean but metabolically obese individuals and vice versa was not possible. Finally, the cross-sectional design does not allow for the discrimination of whether inflammation is a cause or a result of MetS and/or obesity and insulin resistance.
In conclusion, based on our study, low-grade inflammation important the pathogenesis of MetS in women, regardless of obesity status. We can also argue that such association was not found in men, and rather, BMI may be the most significant risk factor. Thus, we may need to pay close attention to inflammatory markers in women, and actively controlling low-grade inflammation may be beneficial in the prevention and management of metabolic disorders. Specific actions for such condition may include the usage of statins and angiotensin-converting enzyme inhibitors, aspirin, and insulin-sensitizing agents, such as thiazolidinedione, and physical exercise. In addition, since we observed strong associations in both obese and non-obese women, CRP evaluation could identify a broader group of individuals who might be at high risk of metabolic disorders, irrespective of weight. Since hs-CRP level is the most standardized and commonly used inflammatory marker, it could be of clinical value in predicting and monitoring MetS in women. More detailed studies must be conducted before firm conclusions can be drawn, particularly regarding sex differences.