INTRODUCTION
Insulin resistance, a condition characterized by the inability of insulin to increase glucose uptake and utilization, is an underlying cause of numerous medical disorders [1]. Individuals with insulin resistance are at a higher risk of developing type 2 diabetes mellitus [2], infectious disease [3], neurodegenerative disease [4], cerebrovascular disease [5], cardiovascular diseases [6], and certain cancers [7]. Furthermore, insulin resistance is associated with increased mortality risk [8]. Korea is rapidly becoming an aging society and is expected to be one of the most aged countries worldwide [9]. As the risk of developing insulin resistance increases with age, its risk is higher among the older population than in the general population [10,11].
A recent study showed that insulin resistance increased the risk of frailty and functional decline in older adults without diabetes [12]. In addition, insulin resistance was found to be associated with an increased risk of mortality among older adults without diabetes [13]. Therefore, early identification of insulin resistance and its prevention in non-diabetic older adults is important from a public health perspective. However, there are only a few standard tools for measuring insulin resistance. Although homeostasis model assessment of insulin resistance (HOMA-IR) is used to measure insulin resistance, it is not routinely quantified in clinical practice. Thus, a simple and accessible tool for predicting insulin resistance could be helpful for the early identification of older individuals with insulin resistance.
Handgrip strength (HGS) is a quick and simple clinical measure for assessing muscular strength. Moreover, HGS has been suggested as a simple screening tool for sarcopenia [14]. A recent study found that sarcopenia prevalence was higher in older men than in women in Korea [15]. Since HGS was associated with body mass index (BMI) [16], relative HGS, which is calculated as absolute HGS divided by BMI, has been widely used in recent studies [17-19].
Previous studies focusing on older individuals in Korea have revealed a significant association between HGS and osteoporosis, fracture, metabolic syndrome, cognitive impairment, and mortality [19-22]. Although a recent study has shown the relationship between HGS and insulin resistance in postmenopausal Korean women [23], few studies have examined the association between HGS and insulin resistance in a non-diabetic population. Thus, this study aimed to investigate the association between relative HGS and insulin resistance in older men without diabetes using a representative sample of the Korean male population.
METHODS
1. Survey Overview and Study Population
This cross-sectional study used data from the 2015 Korea National Health and Nutrition Examination Survey (KNHANES). The KNHANES, which is conducted by the Korea Centers for Disease Control and Prevention (currently, Korea Disease Control and Prevention Agency), gathers nationally representative data on health indicators using complex survey designs to evaluate the health and nutritional status of South Koreans. The survey includes a health interview, health examination survey, and a nutritional survey. The target population of the survey is the civilian noninstitutionalized population of Korea. The sampling units comprise households systematically selected from a multistage stratification by age, sex distribution, and geographical area. Sampling weights representing the sample probabilities are assigned to each participant to ensure that the results are representative of the entire Korean population.
The KNHANES 2015 involved 7,380 participants, 673 of whom were men aged 65–80 years. Among them, we excluded participants who answered “yes” to the question, “Do you have a restriction of activity?” Among the remaining participants, those with a history of diabetes mellitus, arthritis, renal failure, liver cirrhosis, or cancer were excluded. We also excluded those who had not fasted for 8 hours prior to blood sampling and those whose fasting plasma glucose, insulin, BMI, and/or HGS data were missing. After exclusion, 206 participants were included in the final analysis.
All participants provided written informed consent prior to enrollment in the survey. The protocol for the KNHANES conducted in 2015 was approved by the Institutional Review Board of the Korea Centers for Disease Control and Prevention (approval no., 2015-01-02-6C). This study complied with the ethical principles of the Declaration of Helsinki.
2. Anthropometric, Biochemical, and Handgrip Strength Measurement
In the 2015 KNHANES, participants were informed that their household had been randomly chosen to participate voluntarily in a nationwide representative survey performed by the Korea Centers for Disease Control and Prevention. They were also informed that they had the right to withdraw at any time based on the National Health Enhancement Act, supported by the National Statistics Law of Korea. Written informed consent was obtained from all citizens who agreed to participate.
Body weight and height were measured to the nearest 0.1kg and 0.1cm, respectively, using standardized techniques and equipment, and BMI was calculated using the following formula: weight/(height)2 (kg/m2). Blood pressure was measured in the right arm using a standard sphygmomanometer twice at 5-minute interval, and the average values were calculated. All measurements were performed by trained professionals. Blood samples were collected after overnight fasting. Fasting plasma glucose, insulin, total cholesterol, triglyceride, and high-density lipoprotein cholesterol levels were measured in a central certified laboratory.
HGS was measured using a digital grip strength dynamometer (Model TKK 5401; Takei Scientific Instruments Co. Ltd., Tokyo, Japan), with the participant in a standing position with the arm extended. The middle finger was held at 90° to the handle and measurements were taken while exhaling. The maximal hold time of the dynamometer was 3 seconds, and each hand was tested 3 times. The absolute HGS was calculated as the average of the three measurements of the dominant hand. Relative HGS was defined as the absolute HGS divided by BMI.
3. Variable Definitions
HOMA-IR was calculated using the following equation: fasting plasma glucose (mg/dL)×fasting insulin (mIU/mL)/405. In this study, insulin resistance was defined as the upper tertile of the HOMA-IR (>1.89).
Smoking was defined as current smoking and having smoked more than 100 cigarettes during their lifetime. Alcohol consumption was defined as alcohol consumption on at least 2 days per week. Aerobic exercise was defined as moderate-intensity activity for ≥2.5 hours per week or a combination of moderate- and high-intensity activities for ≥1 hour 15 minutes per week. Resistance exercise was defined as resistance exercise at least 3 times per week. Participants who performed resistance exercise were identified on the basis of their response to the following question: “How many days per week have you done resistance exercise, such as push-up, sit-up, dumbbell exercise, lift weights, the horizontal bar?”
4. Statistical Analysis
Sampling weights were used to account for the complex design of the KNHANES survey. Therefore, we obtained valid estimates that represented the entire South Korean population to avoid bias. The participants were divided into three groups according to tertiles of relative HGS: T1, ≤1.387 kg/BMI; T2, 1.388–1.613 kg/BMI; and T3, ≥1.614 kg/ BMI. The characteristics of the study participants according to tertiles of relative HGS were determined through weighted one-way analysis of variance for continuous variables or weighted chi-square test for categorical variables. Pearson’s correlation analysis was used to identify the correlation between BMI and absolute and relative HGS. Odds ratios and 95% confidence intervals for insulin resistance were assessed using multiple logistic regression analyses after adjusting for confounding variables. All statistical analyses were conducted using IBM SPSS statistical software ver. 25.0 (IBM Corp., Armonk, NY, USA). Statistical significance was set at P<0.05.
RESULTS
Among the 206 participants, 68, 69, and 69 were categorized to T1 (lowest), T2, and T3 (highest), respectively. Table 1 shows the characteristics of the study participants according to tertiles of relative HGS. Appendix 1 shows the results of the Pearson’s correlation analysis. While absolute HGS was positively associated with BMI (r=0.203, P=0.003), relative HGS was negatively associated with BMI (r=-0.438, P<0.001).
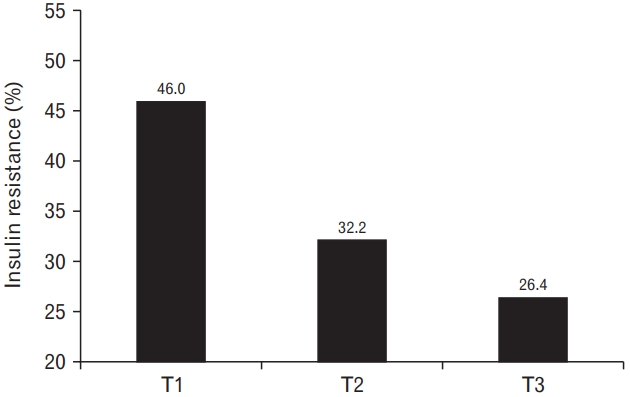
Figure 1 illustrates the prevalence of insulin resistance according to tertiles of relative HGS. The prevalence decreased with increasing relative HGS levels. Insulin resistance was prevalent in 46.0%, 32.2%, and 26.4% of participants in the T1, T2, and T3 groups, respectively.
Table 2 presents the odds ratio (95% confidence interval) of insulin resistance according to tertiles of relative HGS. Compared with the odds ratio for insulin resistance in individuals in the highest tertile, the odds ratio (95% confidence interval) in individuals in the lowest quartile was 2.82 (1.10–7.21) after adjusting for age, smoking, alcohol consumption, aerobic exercise, resistance exercise, systolic blood pressure, total cholesterol, residential area, household income, and education level.
DISCUSSION
This study investigated the relationship between relative HGS and insulin resistance in a representative sample of older Korean men without diabetes. In this cross-sectional study, we found that relative HGS was independently and inversely associated with insulin resistance in our study population after adjusting for potential confounding variables. Our findings are consistent with those of previous studies that reported an inverse association between HGS and insulin resistance [24,25] and that HGS can be a novel marker for assessing the risk of metabolic syndrome [20,26]. Moreover, our results suggest that relative HGS could be a useful marker for identifying older men with insulin resistance who do not have diabetes. Thus, our results expand on earlier findings regarding the association between HGS and insulin resistance.
In this study, absolute HGS was positively associated with BMI and relative HGS was negatively associated with BMI, which is also in agreement with the findings of previous studies [16,20,27]. Lifestyle behaviors, such as smoking, alcohol consumption, and exercise, influence insulin resistance [28-30]. Aerobic exercise and resistance exercise decrease insulin resistance independent of weight change [30]. Socioeconomic status also has an effect on insulin resistance. Several studies have shown that household income and education level are related to the risk of metabolic syndrome [31,32]. In this study, we had adjusted for these lifestyle behaviors and socioeconomic status in multiple logistic regression analyses to control for potential confounding factors.
Skeletal muscle plays a crucial role in glucose metabolism in the body and has a significant influence on insulin sensitivity. Skeletal muscle dysfunction is also involved in the development of insulin resistance. Skeletal muscles undergo several age-related changes that often lead to dysfunction. Thus, the increased incidence of insulin resistance in older adults may be closely associated with skeletal muscle aging [11]. Decreased expression of glucose transporter 4 (GLUT4) from a reduced muscle volume results in decreased insulin sensitivity in the aging skeletal muscle [33]. A previous study revealed that strength training improved insulin action in the skeletal muscle, independent of increase in muscle mass. In addition, strength training increased muscle GLUT4 content and the expression of several insulin-signaling proteins. Moreover, muscle biopsy in individuals with strength training showed increased protein content of GLUT4, protein kinase B-α/β, insulin receptor, and glycogen synthase as well as enhanced total activity of glycogen synthase [34].
This study had some limitations. First, the present study used a cross-sectional design, making it difficult to establish a causal relationship between relative HGS and insulin resistance in older men. Second, this study was confined to older Korean men; thus, the findings may have limited generalizability to other ethnic groups or women. Further studies are warranted to confirm the usefulness of relative HGS in evaluating the potential risk of insulin resistance in people of other ethnicities or women. Third, the mean values of BMI, which could influence the HOMA-IR levels, were significantly different between the tertiles of relative HGS. Further research is warranted to examine the association between relative HGS and insulin resistance among individuals with the same BMI. Lastly, we defined insulin resistance as the upper tertile of HOMA-IR. Although HOMA-IR is a generally accepted tool for quantifying insulin resistance in epidemiological studies, there are no definite cut-off values for defining insulin resistance based on HOMA-IR values. However, this definition of insulin resistance as the upper tertile of HOMA-IR is a commonly accepted approach and has been applied in previous studies [35,36]. Despite these potential limitations, to the best of our knowledge, this is the first population-based study to reveal the association between relative HGS and insulin resistance in older adults without diabetes. Moreover, this study used a nationally representative sample of older Korean men to improve the statistical validity of the findings.
In conclusion, lower relative HGS was inversely associated with an increased risk of insulin resistance in older Korean men without diabetes. Thus, relative HGS can be a useful measure for identifying older men with insulin resistance. Moreover, while longitudinal analyses are warranted to determine whether lower relative HGS is a risk factor for insulin resistance, the current findings suggest that muscle-strengthening exercises should nevertheless be considered for reducing insulin resistance and increasing insulin sensitivity.