INTRODUCTION
Chronic atrophic gastritis (CAG) is a chronic inflammatory change in the gastric mucosa characterized by the destruction of normal glandular structures and replacement with connective tissue or non-native epithelium [1]. Common etiologies of CAG include autoimmunity and Helicobacter pylori infection [2]. Additionally, dietary patterns, such as high salt intake, are associated with an increased risk for CAG [3,4]. Parietal cells of the gastric mucosa stimulate acid production under gastrin (from G cells) and histamine (from enterochromaffin-like [ECL] cells) and control the production of intrinsic factors (IFs). This environment within the stomach is crucial for the digestion of food and absorption of nutrients. Therefore, the destruction of parietal cells can cause achlorhydria, hypergastrinemia, and decreased production of IFs.
The most important clinical implication of these changes is an increased risk for gastric neoplasia, including gastric adenocarcinoma and type 1 gastric carcinoids [5]. Conversely, CAG can further lead to the malabsorption of nutrients. Decreased production of IFs can cause malabsorption of food-bound vitamin B12, resulting in megaloblastic anemia and demyelinating neurological disease [6]. An achlorhydric environment in the stomach leads to decreased food iron solubilization and decreased iron absorption, resulting in iron deficiency anemia [5]. Moreover, vitamin D and calcium absorption decreases under an achlorhydric environment due to unknown mechanisms, which require further study [7,8].
Osteoporosis causes >8.9 million fractures worldwide annually [9], which in turn leads to increased losses in disability-adjusted life years. Osteoporosis is more prevalent among females than males, and bone mineral density (BMD) decreases with aging and decreases rapidly after menopause [10]. Menopause is a common risk factor for osteoporosis due to the protective effect of estrogen against bone loss. Other risk factors include white ethnic background, previous fall or fracture, family history, lack of physical activity, weight loss, cigarette smoking, alcohol consumption, corticosteroid use, chronic liver disease, inflammatory diseases, renal disease, cardiovascular disease, diabetes mellitus, hypogonadism, and hyperparathyroidism [11]. Lack of specific nutritional factors, such as calcium and vitamin D, is a critical risk factor for bone loss and osteoporosis-related fractures [11].
A few studies have explored the relationship between CAG and BMD or osteoporosis. A cross-sectional study involving approximately 401 postmenopausal women reported that atrophic gastritis was associated with an increased odds for osteoporosis [12]. For premenopausal women, a retrospective study reported that those with prolonged atrophic gastritis exhibited lower BMD [13]. However, in another study of 17 patients with a mean┬▒standard deviation (SD) age of 54┬▒13 years, an increased risk for lower lumbar BMD (Z-score) and increased frequency of osteopenia and osteoporosis were found in males, but not in females with CAG. Nevertheless, the same study demonstrated decreased bone formation and increased bone resorption in patients with CAG compared with healthy individuals [14]. Moreover, a cross-sectional study involving 85 women with chronic autoimmune atrophic gastritis (CAAG), H. pylori gastritis, and normal gastric mucosa revealed a null association between CAG and BMD [15].
These inconsistent findings result, in part, from individual differences in study populations and relatively small sample sizes. As such, the present study aimed to assess the association between CAG and BMD among healthy women using large-scale data obtained from a health check-up database.
METHODS
1. Study Participants
This study analyzed data from women >40 years of age who underwent health check-ups at the Center for Health Promotion and Disease Prevention of Seoul National University Hospital between July 1, 2013, and May 31, 2021. Medical records were accessed with permission of the institutional review board of Seoul National University Hospital (H-2106-223-1235). Due to the retrospective design of the study and the use of anonymized patient data, requirements for informed consent were waived.
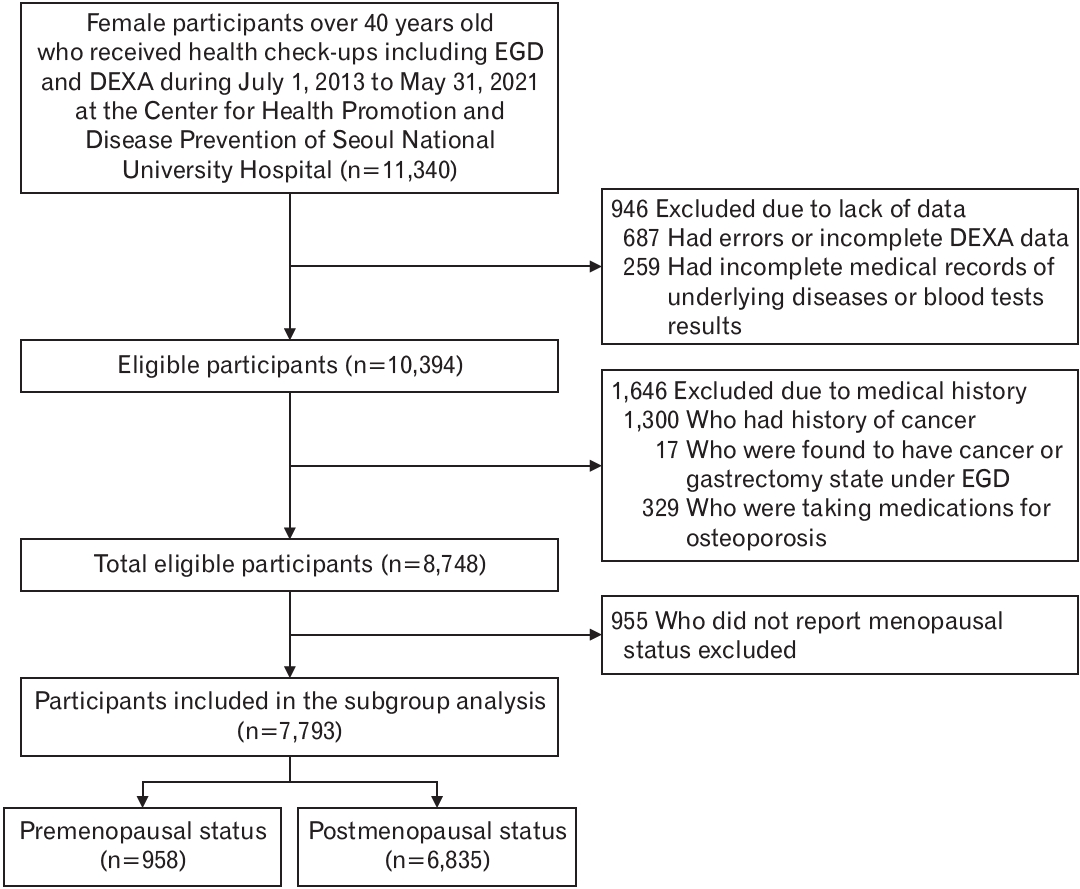
A total of 11,340 women >40 years of age underwent esophagogastroduodenoscopy (EGD) and dual-energy X-ray absorptiometry (DEXA) at the Center for Health Promotion and Disease Prevention of Seoul National University Hospital between July 1, 2013, and May 31, 2021. Of these, 687 for whom DEXA records included missing values or errors and 295 with incomplete medical records or laboratory investigation results were excluded from the study. Moreover, 1,300 women with a medical history of malignancies, 17 in whom EGD results pathologically confirmed gastric cancer or any type of gastrectomy state, and 329 who were taking medications for osteoporosis were also excluded (Figure 1).
3. Measurement of Bone Mineral Density
BMD (g/cm2) of lumbar (L)1ŌĆōL4, femur neck, and femur total were measured using DEXA (Lunar Prodigy Advance; GE Healthcare, Madison, WI, USA), with which trained engineers generated an accurate and reliable dataset. Low BMD, which could be diagnosed as osteoporosis or osteopenia, was defined as a T score of <-1 for L1ŌĆōL4, femur neck, or femur total.
4. Other Study Variables
Medical history and lifestyle of the subjects were documented using self-administered questionnaires. Anthropometric data were recorded by trained personnel, who used a standardized protocol and instruments. Venous blood samples were collected from each subject between 8:00 AM and 11:00 AM after an overnight fast.
Potential confounders included age and the following factors, defined as follows: hypertension (those who reported hypertension or taking hypertensive medications or systolic blood pressure Ōēź140 mm Hg or diastolic blood pressure Ōēż90 mm Hg); dyslipidemia (those who reported dyslipidemia or taking lipid-lowering medications or total cholesterol Ōēź240 mg/dL, low-density lipoprotein cholesterol Ōēź160 mg/dL, triglycerides Ōēź200 mg/dL, or high-density lipoprotein cholesterol <40 mg/dL); diabetes mellitus (those who reported diabetes mellitus or taking diabetes medications or glycated hemoglobin, i.e., HbA1c Ōēź6.5% or fasting blood glucose level Ōēź126 mg/dL); chronic kidney disease (those who reported chronic kidney disease or taking medications due to chronic kidney disease or calculated glomerular filtration rate using the Modification of Diet in Renal Disease equation <60 mL/min); thyroid dysfunction (those who reported hypothyroidism or hyperthyroidism or taking medications for thyroid dysfunction or thyroid stimulating hormone levels <0.35 mIU/L or >4.94 mIU/L); smoking status (those who were currently smoking); alcohol consumption (those consuming any amount of alcohol); physical activity (those performing moderate physical activity >150 min/wk or vigorous activity >75 min/wk); menopausal status (those who were in a postmenopausal state); and hormone replacement therapy (those who had undergone or were undergoing hormone replacement therapy for menopausal symptoms).
5. Statistical Methods
The distribution of demographic characteristics, including underlying diseases and BMD for L1ŌĆōL4, femur neck, and femur total among those with CAG and without CAG, were analyzed using the independent t-test and Pearson Žć2-test. Normality and homogeneity of variance of the dependent variables were tested before all t-tests.
Linear regression models were used to calculate adjusted mean and corresponding 95% confidence interval (CI) for BMD for L1ŌĆōL4, femur neck, and femur total. Known risk factors for CAG and lower BMD and potential confounding factors that demonstrated a significant association (P<0.05) with CAG were all included in the model to calculate adjusted mean. Age, body mass index (BMI), waist circumference, hypertension, dyslipidemia, diabetes mellitus, chronic kidney disease, thyroid disease, smoking status, alcohol consumption, physical activity, menopausal status, and hormone replacement therapy (in case of postmenopausal status) were considered as possible confounders. Furthermore, subgroup analysis was performed according to menopausal status.
The association between low BMD and CAG was analyzed using logistic regression. In model 1, regression was unadjusted and, in model 2, it was adjusted for age. Model 3 was additionally adjusted for other confounding variables including BMI, waist circumference, hypertension, dyslipidemia, diabetes mellitus, chronic kidney disease, thyroid disease, smoking status, alcohol consumption, physical activity, menopausal status, and hormone replacement therapy (for total women and postmenopausal women). All analyses were performed using STATA ver. 16.0 (Stata Corp., College Station, TX, USA).
RESULTS
The characteristics of the study subjects are summarized in Table 1. The mean age of the subjects was 59.61 years. Among the 8,748 subjects, 3,076 (35.16%) comprised the CAG group. The proportion of subjects with low BMD and menopausal women was 47.60% and 78.13%, respectively.
Subjects in the CAG group were older than those in the non-CAG group (62.63 years versus 57.97 years, respectively) and exhibited higher BMI and waist circumference (P<0.001 for all). Furthermore, they were more likely to have chronic diseases such as hypertension, dyslipidemia, diabetes mellitus, chronic kidney disease, and thyroid dysfunction (P<0.05 for all). There were more non-smokers and more current drinkers in the CAG group (P<0.05 for all). Moreover, the proportion of premenopausal women with a history of hormone replacement therapy were higher in the CAG group (P<0.001 for all). Mean┬▒SD BMDs for L1ŌĆōL4 (1.044┬▒0.157), femur neck (0.810┬▒0.111), and femur total (0.876┬▒0.120) were significantly lower in the CAG group than in the non-CAG group (1.084┬▒0.160, 0.845┬▒0.118, 0.906┬▒0.124, respectively; P<0.001 for all).
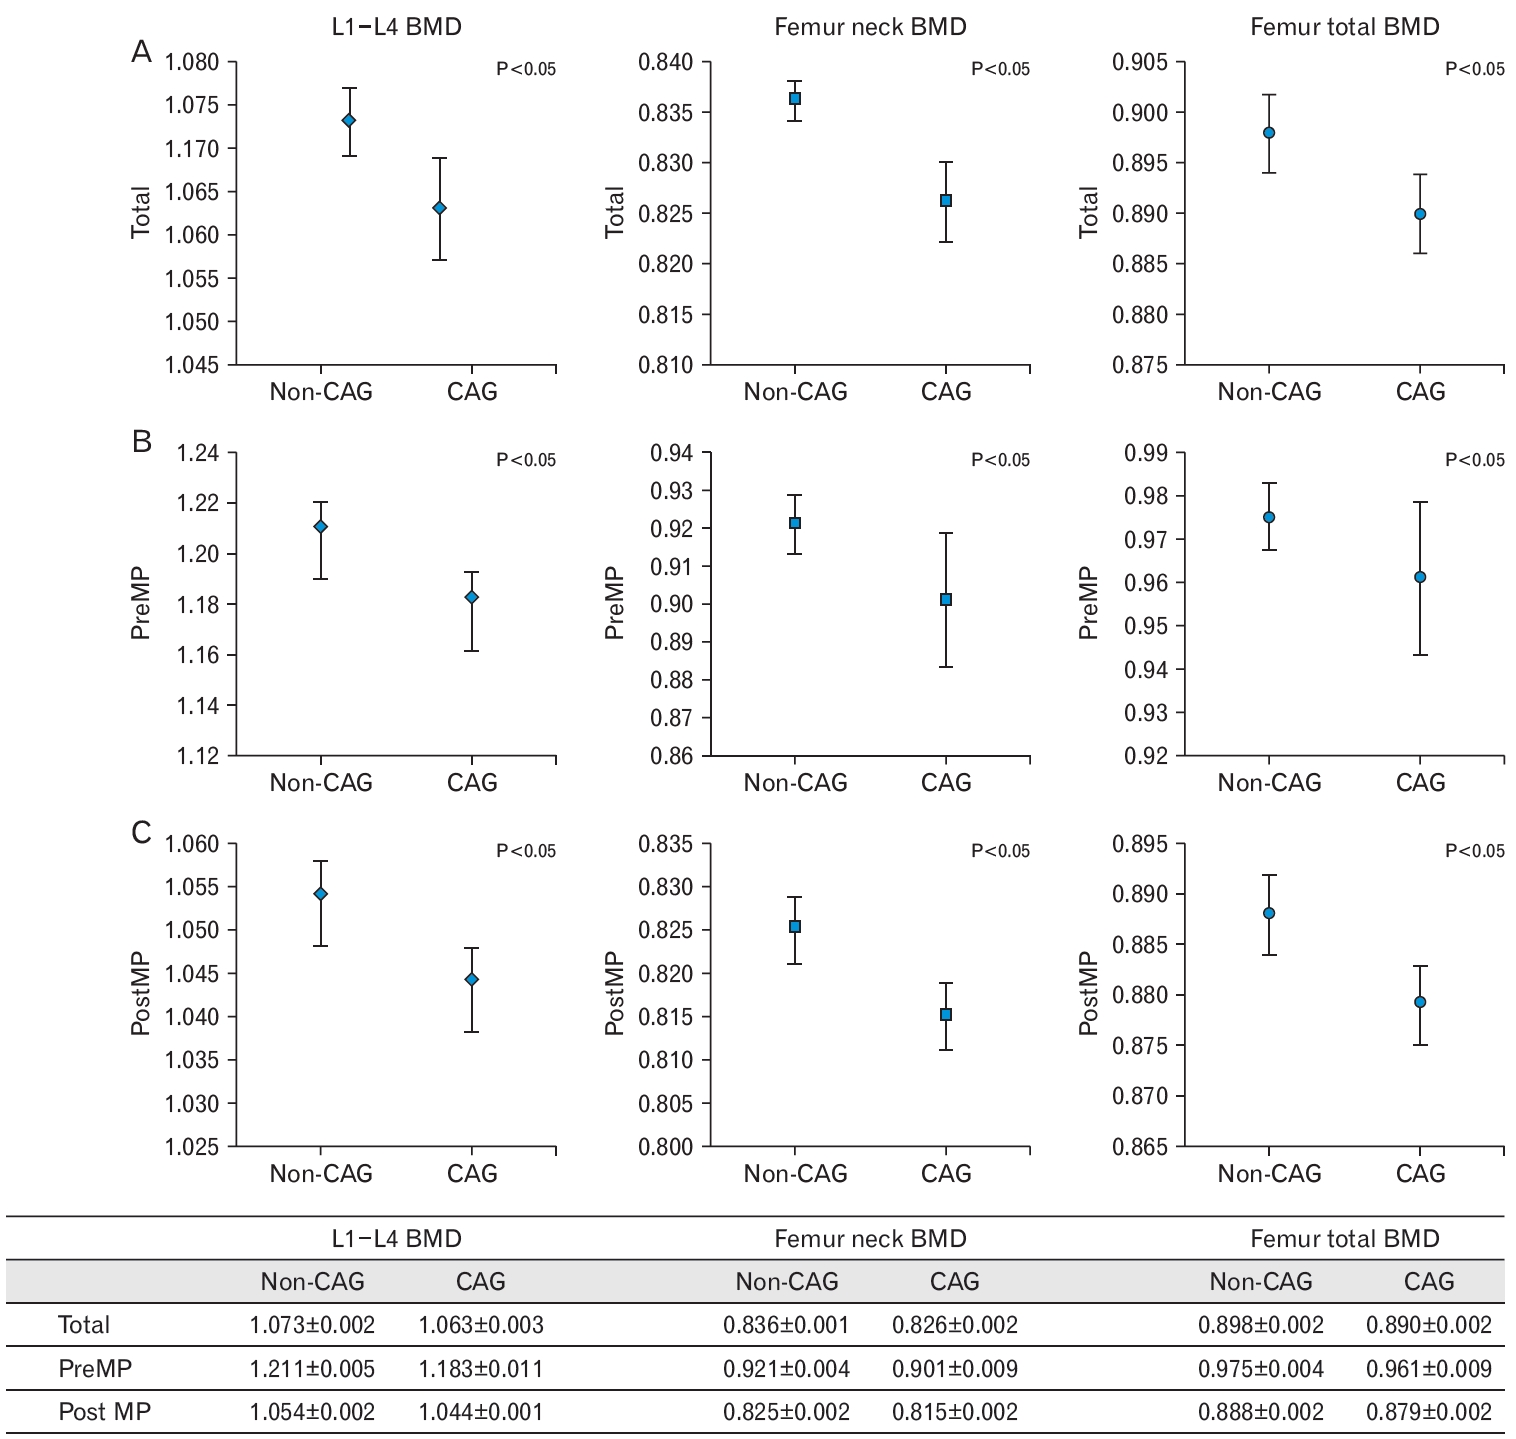
The adjusted means and corresponding 95% CIs for BMD for L1ŌĆōL4, femur neck, and femur total according to the presence of CAG are summarized in Figure 2. Adjusted means of BMD for L1ŌĆōL4 (1.063┬▒0.003), femur neck (0.826┬▒0.002), and femur total (0.890┬▒0.002) were significantly lower in the CAG group than in the non-CAG group (1.073┬▒0.002, 0.836┬▒0.001, and 0.898┬▒0.002, respectively; P<0.05 for all). Differences in BMD between the CAG and non-CAG groups were attenuated after stratified analysis according to menopausal status among premenopausal women was performed.
Associations between CAG and lower BMD (as is osteopenia or osteoporosis) are summarized in Table 2. CAG was associated with an increased likelihood for osteopenia or osteoporosis. This association persisted even after adjusting for age and other confounding factors, including BMI, waist circumference, hypertension, dyslipidemia, diabetes, chronic kidney disease, thyroid disease, current smoking and drinking, physical activity, menopausal status, and hormone replacement therapy (model 3: odds ratio [OR], 1.26; 95% CI, 1.13ŌĆō1.40). However, stratified analysis according to menopausal status revealed that this association was attenuated among premenopausal women and remained significant only among postmenopausal women (model 3: OR, 1.27; 95% CI, 1.14ŌĆō1.41).
DISCUSSION
Results of the present study revealed that CAG was associated with lower BMD and a higher risk for osteopenia or osteoporosis among postmenopausal women. The association remained significant after adjusting for known confounding factors.
Several studies have assessed the relationship between CAG and BMD. A cross-sectional study involving approximately 401 postmenopausal women >60 years of age found that atrophic gastritis was associated with an increased odds for osteoporosis, which was diagnosed based on lumbar BMD [12]. Among premenopausal women in their 40s, a retrospective study reported that those with prolonged atrophic gastritis exhibited lower BMD in L1ŌĆōL4. The results did not include associations with osteopenia, osteoporosis, or osteoporotic fracture, which was probably due to the young median age of the study population [13]. To our knowledge, the sample sizes of these studies were relatively large compared to some previous observational studies, and there was only one study with a longitudinal design that could strongly support the causal relationship.
Our findings differ from those of some previous studies. Kakehasi et al. [15] conducted a cross-sectional study comparing BMD in 24 patients with autoimmune gastritis, 34 with H. pylori gastritis, and 27 with H. pylori-negative normal mucosa. Participants were mostly postmenopausal women with no significant difference in postmenopausal duration between the groups. The authors observed that BMD in the spine and hip were not different, suggesting that H. pylori-associated gastritis and autoimmune gastritis was not a risk factor for impaired bone health [15]. The study used histological diagnosis, and H. pylori infection was considered. However, mean postmenopausal duration was relatively longer among the controls, and the sample size was small, which could explain the null association.
Aasar├Ėd et al. [14] compared 17 patients with CAG and controls and reported that only lumbar BMD was significantly lower among men with CAG. However, the authors acknowledged that the analyses may have been underpowered because the sample size was small. In addition, the average age of the cohort was early 50s, which may have been too young to discern the impact of CAG on skeletal health [14].
It has been reported that conditions created by CAG, such as hypochlorhydria, hypergastrinemia, and hypomagnesemia, may adversely affect bone health. Several studies have assessed the risk for development of osteopenia and osteoporosis under hypochlorhydric or achlorhydric conditions. Individuals who underwent gastrectomy due to stomach cancer exhibited an increased risk for osteoporosis and fractures [17]. Long-term use of acid-suppressive medications, such as proton pump inhibitors, can increase the risk for fractures [18]. Various possible mechanisms supporting this have been proposed. First, gastric hypoacidity inhibits calcium absorption. Gastric acid is crucial for calcium absorption because it increases the dissolution and ionization of insoluble calcium [6,7]. Moreover, vitamin D deficiency has been observed to occur in patients with CAG due to a poorly understood mechanism. A prospective cohort study involving 87 patients with CAAG over a 3.5-year period reported lower 25(OH)D levels in the CAAG group than in the control group. Moreover, participants with moderate or severe CAAG exhibited lower levels of 25(OH)D than those with mild CAAG [8]. Studies evaluating the precise mechanisms, and the association between CAG and malabsorption of calcium and vitamin D, are limited.
Second, available evidence has demonstrated that hypomagnesemia and hypergastrinemia induced by CAG can contribute to loss of BMD in patients with CAG. Hypomagnesemia is associated with lower BMD in some physiological pathways [19]. Several in vitro studies have reported that magnesium deficiency reduces osteoblastic activity and increases the number of osteoclasts [20,21]. In addition, it interferes with the normal function of parathyroid hormone [22] and hydroxylation of vitamin D [23]. Hypergastrinemia stimulates histamine secretion via ECL cell hyperplasia, which may be linked to osteoclastogenesis and bone resorption [24,25].
Chronic systematic inflammation induced by H. pylori infection is another potential mechanism. Most cases of CAG diagnosed in Korea are type B (non-autoimmune type) involving the corpus, which is related to H. pylori infection [26]. A systemic inflammatory state due to chronic H. pylori infection with the release of multiple pro-inflammatory cytokines, including tumor necrosis factor-╬▒, interleukin-1, and interleukin 6, can negatively affect bone health [27,28].
Results of the present study revealed that lumbar and femur BMD in women >40 years of age were lower in the CAG group than in the non-CAG group. The difference in femur total BMD among premenopausal women was not significant, probably because femur BMD decreases at a slower rate than lumbar BMD, and the number of premenopausal women was small (n=952). The risk for osteopenia or osteoporosis was significantly higher only among postmenopausal women with CAG. The longer duration of CAG and changes in bone metabolism after menopause can explain these findings.
The present study had some limitations. First, our findings do not imply causality of the relationship because the study was cross-sectional in design. Second, we used the endoscopic diagnosis of CAG, not a histological diagnosis; however, endoscopic diagnosis of CAG has demonstrated good correlation with histological diagnosis of CAG [16,29,30]. Moreover, DEXA images were not reviewed one-by-one to evaluate BMD accurately. H. pylori infection, the use of proton-pump inhibitors that can contribute to hypochlorhydria, and the use of steroids that affects BMD were not identified.
Despite these limitations, this study was based on a large sample of a homogenous healthy population (native Koreans). We analyzed not only lumbar and femur BMD, demonstrating consistency in the relationships, but also low BMD (osteopenia or osteoporosis) based on T-score as an outcome variable to assess the risk for osteopenia or osteoporosis. In addition, subjects included women >40 years of age, and the effect of menopause on BMD was excluded through stratification according to menopausal state. Moreover, the effect of hormonal therapies on menopausal symptoms was included as a confounder in the analyses. These results support previous hypotheses regarding the relationship between impaired bone health and CAG. Additionally, it suggests that postmenopausal women with CAG are particularly more likely to develop osteopenia or osteoporosis. According to these results, monitoring and management of modifiable risk factors for osteoporosis in postmenopausal women with atrophic gastritis will be beneficial.
In conclusion, CAG was associated with lower BMD and a higher risk for osteopenia or osteoporosis among postmenopausal women. Further studies using a long-term longitudinal design or analyzing changes in major components of bone metabolism among patients with CAG are required to clearly identify the mechanism(s) and clinical significance of this finding.