The Impact of Body Weight Change on Bone Mineral Density of the Lumbar Spine in Perimenopausal Women: A Retrospective, One-year Follow-up Study
Article information
Abstract
Background
Low body weight was one of the risk factors of osteoporosis. Little is known about the correlation between body weight change and bone mineral density (BMD) in Korean women. Therefore, this study was designed to reveal the impact of body weight change on BMD of the lumbar spine in perimenopausal women.
Methods
105 healthy perimenopausal women aged between 44 and 50 years old were enrolled from August 2002 to March 2009. BMD was measured by dual energy X-ray absorptiometry. Partial correlation coefficients between body weight change and BMD change were calculated after the adjustments for several variables. BMD changes among groups based on BMI and the percentage change in body weight during 1-year follow-up period were compared.
Results
At both baseline and year 1, BMD of lumbar spine tended to be associated more with body weight. There was a significant association between body weight change and BMD change in lumbar spine during 1-year follow-up period. The weight gain group relatively showed an increase in BMD of lumbar spines than weight loss group. There was no BMD change in BMI less than 23 kg/m2 group, but in case of BMI more than 23 kg/m2 group, BMD in weight gain group increased more than the weight maintaining group.
Conclusion
This study demonstrated that body weight change is associated with change in BMD of lumbar spine in perimenopausal women especially if they are overweight.
INTRODUCTION
Menopausal transition is a dynamical hormone changing period that occurs because of a decrease in the function of the ovaries. Increased level of follicular stimulating hormone and irregular patterns of menstruation are common and remarkable characteristics of menopausal transition.1) On average, women in the middle of menopausal transition gained almost 0.5 kg per year.2) This could affect not only high level of cholesterol but also body metabolic system, like basal metabolic rate, so they are recommended to maintain their weight for normal-weight perimenopausal women and to lose their weight to decrease the risk of cardiovascular diseases for overweight or obese perimenopausal women.3,4)
Losing body weight might help control blood lipid profile but low body weight could affect bone mineral density because low body weight itself is one of known risk factors of osteoporosis.5-7) A large sectional study has shown that there was a positive correlation between body weight and bone mineral density (BMD) and especially weight barring part of body, lumbar spine and femur neck tended to be associated more with body weight than no weight barring part like radius.8) According to some of domestic studies, all three groups - male adults (average age of 49.6), women over 50 years old and young females (average age of 34) - had a correlation between body weight and lumbar spine (r = 0.295, r = 0.24-0.29, and r = 0.222).9-11) A prospective study followed up women in menopausal transition for 2 years and inferred its relation between body weight change rate and BMD change rate on a graph. The diagram proposed that about 3% of weight gain per 2 years was need in order not to lose bone mineral density, and even though body weight was maintained, it also caused 1% loss of bone mineral density every 2 year.12)
Premenopausal women with osteopenia tend to have faster pro cess of losing bone mineral density and diagnosed with osteoporosis more after all than premenopausal women with normal BMD.13) If premenopausal women with osteopenia are treated early enough, that may help not to proceed its process to reach osteoporosis.14) Therefore, when life style modification like losing body weight is planned for a premenopausal woman to reduce cardiovascular risk, it's correlation with BMD must be considered first. However, little is known about the correlation between body weight change and BMD for Korean women. Therefore, this study was designed to reveal the impact of body weight change on BMD of the lumbar spine in perimenopausal women.
METHODS
1. Study Subjects
Healthy premenopausal women aged between 44 and 50 years old who visited University Hospital in Busan and had annual health check-ups including BMD at least twice were enrolled from August 2002 to March 2009. Total 105 participants were eligible to participate if they met all of the following criteria: 1) did not suffer from osteoporosis and diseases which could cause secondary osteoporosis, like anorexia nervosa, chronic malabsorption, hyper parathyroidism, hyperthyroidism, hypogonadism, prolactinoma, Cushing syndrome, osteogenesis imperfecta, rheumatoid arthritis, chronic obstructive pulmonary disease, chronic neuropathy, chronic renal failure, diabetes mellitus, acromegaly, alcoholic, chronic liver disease, collagenous disease and metabolic disease; 2) had no history of transplanted organs, hysterectomy with or without ovariotomy, fracture or taking medicine affecting BMD such as hormonal therapy, oral contraceptive pill, steroid, anti conversant drugs, thyroid hormone or anti coagulant drugs and 3) had no period for at least 2 months and were diagnosed with menopausal transition.15)
2. Measures
Each participant also underwent a complete physical examination including anthropometric measurements. Height and body weight were measured using a digital scale, with the examinee wearing a light gown. Body mass index (BMI) was calculated as follows: BMI = weight (kg)/height squared (m2). Resting blood pressure was measured using an automatic sphygmomanometer (BP203RV-II; Nippon Colin, Komaki, Japan) after a minimum of 10 minutes at rest in sitting position at 8 am to 10 am. Study subjects refrained from smoking or ingesting caffeine for 30 minutes prior to measurement. Blood samples were collected from the antecubital vein to determine serum concentrations of alkaline phosphatase (ALP) after overnight fasting. The serum biochemical test was conducted by Hitachi autoanalyzer model 7600-110 (Hitachi Co., Tokyo, Japan) and commercially available kits. Total body fat percentage was determined using a bioelectrical impedance analyzer (Inbody 3.0; Biospace Co., Seoul, Korea). The examinees were asked not to take any food and any water from 12 am to 2 pm, respectively, before the measurements. BMD of 1-4th lumbar spine was measured by using dual energy X-ray absorptiometry (DEXA; Lunar Prodigy, GE Medical System, Waukesha, WI, USA).
Before the health check-up began, all information like past histories, exercise state, current drinking state and smoking state were collected by self-reports. In case of alcohol state, it was divided into 3 groups, no alcohol intake group, less than 15 g a day drinking group, and more than 15 g a day drinking group. Smoking state was also divided into 3 groups which were smoking group, stop smoking group and never smoking group. For exercise state, regular work out group, irregular work out group and no work out group were defined. Regular work out group was a group who work out more than 30 minutes each time and more than 3 times a week. Irregular work out group was a group who work out less 30 minutes each time and less than 3 times a week. No work out group was a group that hardly ever exercises.
Daily energy and nutrient intake were assessed using a 7-day semi-quantitative frequency questionnaire with 24 food items. A trained dietitian interviewed each participant regarding the average frequency of consumption and portion size of each food weekly during the previous three months. Participants were presented with two-dimensional food pictures of the actual size of portions on a computer by a single interviewer to minimize interviewer bias. Medium was defined as the portion sizes shown, small was about one-half the medium portion size, and large was one-and-a-half times the medium portion size.
3. Statistical Analyses
Statistical analyses were performed using the SPSS ver. 10.0 (SPSS Inc., Chicago, IL, USA). Changes in BMI, total body fat percent, fat free mass, waist circumference, ALP and BMD of the lumbar spine during 1 year follow-up period were determined by paired t-test. Partial correlation coefficients between body weight change and BMD change were calculated after adjustment for age and changes in calcium intake, exercise, alcohol drinking and smoking status. One-way analysis of variance (ANOVA) and the Scheffe's post hoc test for pairwise comparisons were used to compare BMD changes among groups based on the percentage change in body weight during 1-year follow-up period; weight maintaining group (within 3% change of initial weight), weight gain group (the increase of initial weight by 3% or more) and weight lost group (the reduction of initial weight by 3% or more).16) Then, we compared two group divided on the basis of initial BMI ≥ 23 kg/m2 vs. BMI < 23 kg/m2.
RESULTS
1. Basal Characteristics of the Study Subject
Mean age of 105 people aged between 44 and 50 was 45.8 ± 1.7 years old. Average BMI was 23.4 ± 2.6 kg/m2. Mean systolic and diastolic blood pressure was 117.7 ± 18.0 mm Hg and 72.0 ± 10.9 mm Hg. Mean daily calcium consumption was 917.2 ± 243.6 mg (range, 431.5 to 1,911.3 mg) which were more than the standard daily calcium consumption recommendation by the Korean Nutrition Society, 700 mg, in 2005. Only 8.6% of them smoked and 23.8% and 3.8% of them were modest and heavy drinkers, relatively (Table 1).
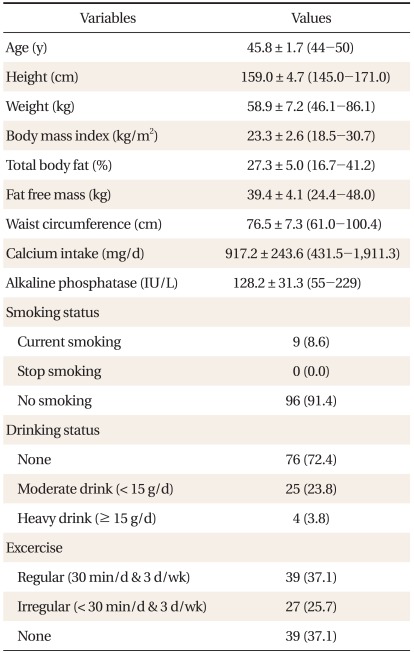
Anthropometric characteristics and body composition data of patients (n = 105).
2. Association between Anthropometric Data and Lumbar BMD
There was no significant difference between weight, BMI and waist circumference, while significant differences between percent body fat, ALP, fat free mass and 2nd lumbar spine BMD during 1-year follow-up period (Table 2). After adjustment for age, calcium intake, exercise status, smoking status, and alcohol drinking, partial correlation coefficients of between 2nd lumbar spine and average BMD change and weight change were 0.32 (P < 0.01) and 0.28 (P < 0.01) relatively, but there was no significant correlation between weight change and ALP change (Table 3).
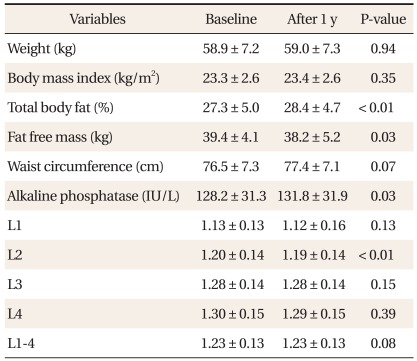
Change of anthropometric characteristics and bone mineral density of the lumbar spine.
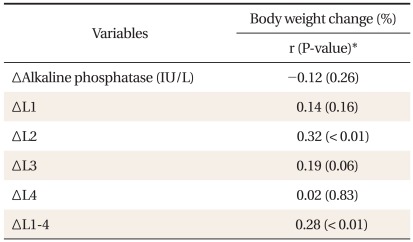
Correlations between body weight change and bone mineral density change of the lumbar spine.
3. Differences in the Mean BMD Change between Groups
One-way ANOVA showed that there was at least one significant difference in the mean BMD change between groups: weight maintaining, weight gain, and weight lost group. According to post-hoc test, the weight gain group relatively showed an increase in BMD of lumbar spines than weight lost group (Table 4). There was no BMD change in BMI less than 23 kg/m2 group, but in case of BMI more than 23 kg/m2 group, BMD in weight gain group was increased more than the weight maintaining group.

Changes in body weight and bone mineral density of the lumbar spine after 1 year from the start of the study.
DISCUSSION
The aim of this study was to evaluate the impact of body weight change on BMD of the lumbar spine in apparently healthy perimenopausal women during the 1-year follow-up period. Their BMD change by their weight change was retrospectively monitored to give general and clinical information for adequate weight control among perimenopausal women to prevent BMD loss. Body weight is well-known as a very important determinant of BMD.17) Weight baring exercises place continuously more stress on the skeleton and then protect the skeleton from external forces or impacts. In addition, some estrogens from fat tissue prevent bone atrophy from bone.18) Low body weight is associated with an increased risk of low bone mass, while obesity is considered as a protective factor for osteoporosis in postmenopausal women.19-22)
Most previous studies about the relationship between body weight and BMD for Korean women have not used DEXA measurement (g/cm2) in their statistical analyses and have not showed correlation coefficients in their studies. This study accumulated DEXA measurement (g/cm2) for 1 year and used the measures to analyze its correlation between anthropometric parameters and BMD. These results revealed a significant correlation between the 2nd lumbar spine BMD change, the mean lumbar spine BMD change and body weight change during the 1-year follow-up period.9-11) According to body weight change rate, lumbar BMD change was assessed. As a result, only 3% body weight change in perimenopausal women over 1 year impacted on lumbar spine BMD. Had it followed up the weight and BMD of participants for more than 1 year, the results may have shown more significant correlation between them.
Both body fat mass and fat free mass influence on bone metabolism and act mechanical forces on the skeleton, although which body compartment of them relates more strongly to BMD is still controversial.23) Previous studies presumed that increase in both body fat mass and skeletal muscular mass causes increase in BMD,24,25) while recent studies have shown that BMD was decreased by increase in body fat mass after the adjustments for body weight.26,27) In this study, however, both body fat mass and fat free mass had no significant correlations with BMD. The reason of this result is still not clear but this maybe explained in part by bioelectrical impedance analysis based on the principle that the resistance to an applied electric current. This result may be affected by patient's hydration or time spent on measuring. These errors could not reflect enough to correct body composition change due to body weight change. Although more accurate measurement such as DEXA, computed tomography or magnetic resonance imaging can be considered to solve this problem, there still exist so many limitations in clinical field. In Rancho Bernardo Study, the correlation coefficient between body fat mass and skeletal muscular was 0.58) and it is too strong to separate them individually for analyzing them statistically. Because of these limitations, it was hard to implicate its correlation.
This study still has some limitations, although most potential con founders were carefully controlled to lower the possibility of residual confounding effects. First of all, the subjects of this study were all examinees who visited University Hospital and so it has yet to be seen whether our results can be generalized to entire population. Second, one-year follow-up period might not be enough to demonstrate the correlation between body weight change and BMD change. Third, while many kinds of nutrition such as calcium, protein, vitamin D, vitamin K, and minerals are needed to build up and maintain bone mass, this study obtained only calcium intake information from the subjects. Forth, only current eating habit was invested so that previous calcium accumulations were not considered. Fifth, low body weight group was not included in this study, even though same amount of body change would affect more on BMD in people with lower body weight than others.28) Many previous studies have shown that if one experienced 'weight cycling,' even though one gained weight again, it did not recover to its initial BMD.29,30) There is a possibility that this study might fail to identify the weight fluctuation during the follow-up period. Maybe this influences BMD change.
In conclusion, we found that only 3% body weight change during a 1 year period impacts on lumbar spine BMD in perimenopausal women and that in case of especially overweight women, the weight gain relatively shows an increase in BMD of lumbar spines than the weight loss in a retrospective cohort study. Our findings suggest that weight change in perimenopausal overweight women may contribute to developing BMD loss and much more longitudinal studies and a more comprehensive approach are needed.
ACKNOWLEDGEMENTS
This work was supported for two years by Pusan National University Research Grant.
Notes
No potential conflict of interest relevant to this article was reported.