Patients' Assessment of Community Primary and Non-primary Care Physicians in Seoul City of South Korea
Article information
Abstract
Background
It is important to know the current level of primary care performance in order to evaluate and plan for desirable health policy. We tried to compare patient's assessment of primary (family physician, general practitioner, internist, pediatrician, and general surgeon) and non-primary (the other specialties) care physicians.
Methods
Study subjects were physicians of primary care clinics in Seoul. The study subject evaluators were Seoul citizens who were selected by a list-assisted random digit dialing sampling method and who had visited their primary care clinic on six or more occasions over a period of more than 6 months as a usual source of care. The modified version of the Korean Primary Care Assessment Tool was used for the evaluation of primary care performance. The data were collected with the aid of a computer-assisted telephone interview system from June 29 to July 22, 2009.
Results
The data on 260 individuals were used for analysis. The mean scores of primary and non-primary care physician group were respectively 1.19 and 0.85 in the comprehensiveness domain, 1.00 and 0.83 in the coordination domain, 1.54 and 1.31 in the family/community orientation, and 1.24 and 0.99 as an average of 3 domains above. The scores in the comprehensiveness domain and the average of 3 domains were significantly higher in the primary than in the nonprimary care physician group.
Conclusion
Primary care physicians showed superior performance compared to non-primary care physicians in comprehensiveness domain and in the average of comprehensiveness, coordination, and family/community orientation domains.
INTRODUCTION
There is no clarity or universal agreement in the definition of primary care. Primary care has been defined a little differently according to the circumstances of each country.1) The definition of primary care in South Korea, agreed upon mutually by 77 experts from related fields, is "the delivery of those health care services that are first encountered by people. It is a discipline in which physicians, who see patients personally in the context of family and community, continue a doctor-patient relationship over time, coordinate health care resources appropriately, and resolve common health care needs of people. To perform primary care function effectively, multidisciplinary cooperation and community participation are required".2) This definition includes four core (first-contact care, comprehensiveness, coordination, and longitudinality) and three ancillary (personalized care, family and community context, and community base) attributes.
In Korea where the healthcare delivery system is only loosely established, there is much debate about what constitutes primary care physicians. In the USA, primary care physicians generally include general internists, general pediatricians as well as family physicians,3) and there is some controversy from the standpoint of physician's actual role in USA about whether obstetrician/gynecologists and general surgeons are primary care physicians or not.4,5) Judging from the first contact care role of physicians in the present Korean medical system, physicians working at self-owned clinics or public health centers may be roughly classified as primary care physicians.6) Self-owned clinics took care of almost all of the patients.7)
The physicians themselves at self-owned clinics can be further classified into a primary care group and a non-primary care group according to the specific characteristics of their specialty and the present Korean medical situation. In 1996, the Korean regular doctor registration project classified family physicians, general physicians, internists, pediatricians, general surgeons, and obstetrician-gynecologists as primary care physicians by the criteria of possible comprehensiveness.8) However, community residents themselves listed internists (48.2%), pediatricians, oriental doctors, general surgeons, and family physicians as doctors as regular source of care, in that order of frequency.9) They also wanted in the future to have internists (55.5%), family physicians, pediatricians, oriental doctors, and general surgeons as regular doctors, in that order of frequency.10) Some community residents had, and wanted to have, a general surgeon as a regular doctor, but they did not mention obstetrician-gynecologists. Therefore, in this study, we classified general physicians, family physicians, internists, pediatricians, and general surgeons as the primary care physician group, and the other specialty-physicians as the non-primary care physician group.
According to a comparative study, Korea and France were found to have the weakest primary care system among OECD countries.11,12) In Korea, 92% of medical institutions are private, while the public community health and governmental hospitals form a small part. The National Health Insurance System markedly enhances accessibility to medical services. Patients can visit any specialty clinic in the community and go to general hospitals without restriction. But the delivery system of medical services is poorly established, and every doctor can run his private office regardless of specialty. The service contents of primary care are often said to be not different irrespective of specialty. Under the fee-for-service payment system in Korea, even public medical institutions compete with private institutions. Much discussion has taken place recently to reinforce primary care as an alternative for a more efficient use of medical resources, the containment of medical costs, and the improvement of medical equity for the populace.
It is important to know the current level of primary care quality in order to evaluate and plan for desirable health policy. However, only a few research articles have assessed the quality of self-owned clinic-based physicians according to primary care attributes. Baek et al.12) used the translated Korean version of the Primary Care Assessment Survey questionnaire13) and reported that primary care quality scores were low in all domains of primary care. This study had a few limitations, such as untested validity and reliability of the questionnaire, and a convenient sampling technique. In hopes of improving this situation, we planned to test the hypothesis first that primary care quality scores according to primary care attributes would be higher in primary care physician groups than in non-primary care physician groups.
METHODS
This study was approved by the Institutional Review Board of Dongguk University Ilsan Hospital (study number: 2009-1-33).
1. Study Subjects
The study subjects were physicians who were working at self-owned primary care clinics in Seoul, the capital and the largest city of Korea. In Korea, a primary care clinic is defined in the Medical Treatment Law as one that has 29 beds or less.
2. Sampling Method
Evaluators of subject physicians were Seoul citizens who had visited their primary care clinic on six or more occasions over a period of more than 6 months as their usual source of care. The evaluation by frequent visitors was related to the purpose of our article since this number of visits was thought to be necessary to assess the provider's performance reliably.
We used two sampling stages, in which households were chosen in the first stage and then an individual within those house holds was drawn in the second stage. The first-stage sampling of households was by a list-assisted random digit dialing (RDD) method, which covers both listed telephone numbers and unlisted numbers in South Korea. This RDD method for avoiding non-coverage error due to unlisted numbers of about 50 percent, based on 100 consecutive phone numbers within an area code-prefix combination, has been broadly adopted in the USA since Brick et al.14) presented it. Two articles15,16) demonstrated that it can be useful in selecting a representative sample of households in Korea. In the second stage, one from all of the eligible persons (members within each household who had visited their primary care clinic six or more times over a period of 6 or more months as their usual source of care) was randomly selected. If there was only one eligible in a selected household, that person was interviewed.
3. Primary Care Assessment Tool
Of the various primary care service assessment methods, a questionnaire is generally used to gather information from service users. While this method has the strengths of being able to evaluate many attributes and reflect service contents, it requires a valid and reliable questionnaire suitable for the purpose. Several useful questionnaires (e.g., Primary Care Assessment Survey,13) Primary Care Assessment Tool17)) were developed in foreign countries. In Korea, two assessment instruments18,19) have been developed previously, but were rarely used. Recently, Lee et al.20) developed and tested the validity and reliability of the Korean Primary Care Assessment Tool (KPCAT), which was based on the Korean definition of primary care.2) We decided to use the KPCAT in this study.
We reduced the number of KPCAT items so as to increase the response rate of our telephone survey. KPCAT originally consisted of five domains (total of 21 items); first contact care (5 items), comprehensiveness (4 items), coordination (3 items), personalized service (5 items), and family/community orientation (4 items).2) We excluded the first contact care domain and personalized service domain, which showed relatively higher scores in the previous studies.20,21) Of 3 coordination items, an item("Did your doctor recommend the specialists?") was excluded because it was not relevant to this study. In addition, we omitted one item (active participation in promoting the health of your community) from the family/community orientation domain because it showed a very low response rate in the pretest. The telephone questionnaire finally included nine main items, demographic questions (age, sex, and education level and so on) of respondents, and medical clinic items (working physician number, location, specialty and so forth).
The scoring system is as follows: each response on a 5-point Likert scale is converted from 0 to 4. The average score is the mean of three domain scores.
4. Data Collection via Telephone Interviews
The survey using computer-assisted telephone interviewing (CATI) was conducted by the Dongguk University Survey Research Center between June 29 and July 22, 2009. In order to contact the persons who were infrequently at home, we made at least 15 calls on different days of the week and at different hours of the day. We permitted proxy reporting by parents or guardians if the selected respondent was not an adult or had any disability.
5. Statistical Analysis
Sample households were selected with an equal probability, while one person in each of selected households was chosen at random with unequal probabilities since the number of eligible persons varied by households. Thus, we produced separate weights (wi) for the respondents (i) to compensate for unequal probabilities of selection, given by wi = aiN/n , where n is the sample size, N is the RDD frame size that indicates the number of all possible phone numbers to be generated by list-assisted RDD sampling method, and ai is the number of eligible persons in each of the selected households. Based on those weights, we analyzed the data on survey items or some groups of them by using chi-square test and two-sample t-test and obtained Table 1, Table 2, and Table 3.
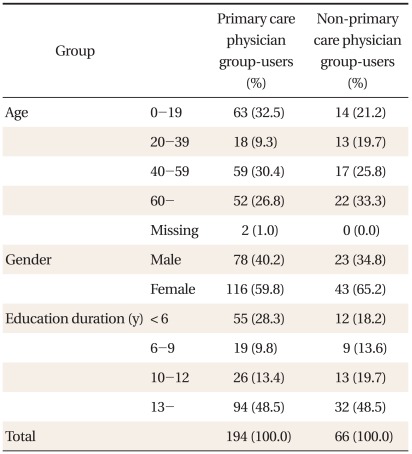
General characteristics of respondents (n = 260).
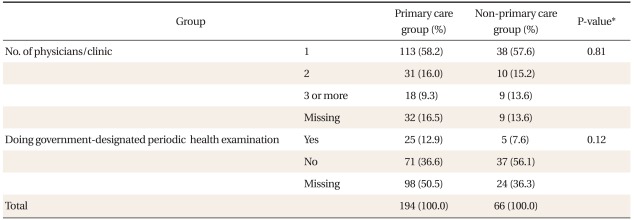
Characteristics of clinics by physician group (n = 260).
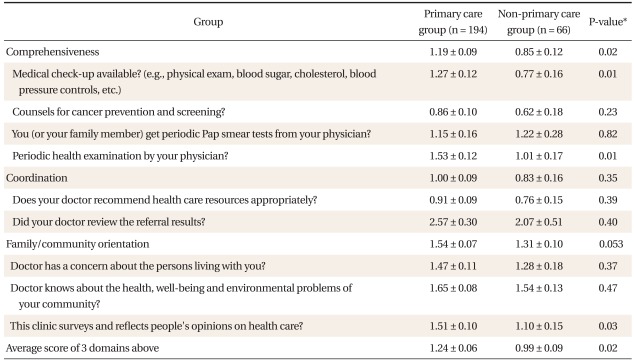
Primary care assessment score by physician group (mean ± margin of error).
RESULTS
1. General Characteristics of Study Subject Evaluators
We called up 2,900 telephone numbers which were selected via list-assisted RDD sampling. Of those, 298 households were eligible for our study and 262 households answered questionnaires completely. Two questionnaires were excluded because they could not be classified as being associated with a primary or non-primary care physician group. Finally, questionnaires from 260 households were used for analysis.
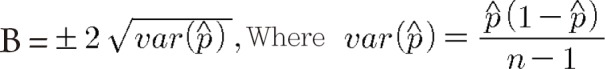
The important item in our study was the proportion of primary care physician groups among physicians identified as a usual source of care. The estimated proportion of primary care physician groups was 77.59% and the margin of error was ±5.16%. The proportion (p̂) and margin of error (B) were calculated via the following formulas.

The age of evaluators for primary care physician groups was the most common (32.5%) in 19 or less and that for non-primary care physician groups was the most common (33.3%) in 60 or more. Male evaluators were 78 (40.2%) in primary care physician users and 23(34.8%) in non-primary care physician users. In the length of education, 13 years or more was the most common in both primary and non-primary care physician users (Table 1).
2. Characteristics of Clinics by Physician Group
The distributions of the number of physicians per clinic were not significantly different between the two groups. Also, there was no significant difference in doing government-designated periodic health examinations between two groups (Table 2).
3. Primary Care Assessment Scores by Physician Group
The average score (1.19) of the comprehensiveness domain in the primary care physician group was significantly higher than that (0.85) in the non-primary care physician group. The average score of the coordination domain was not significantly different between the two groups (1.00, 0.83). The average score difference of family/community orientation was of borderline significance between the two groups (1.54, 1.31; P-value=0.053). The average score of 3 domains was significantly different between the two groups (1.24, 0.99). Item scores of the medical check-up (1.27), periodic health examination (1.53), and reflection of people's opinions on health care (1.51) in the primary care physician group was significantly higher than that of the non-primary care physician group (0.77, 1.01, 1.10) (Table 3).
DISCUSSION
Starfield22) suggested that the higher score in the primary-care orientation of a nation was associated with lower costs, less medication use, and better health levels, based upon her own scoring system for the national strength of primary care orientation which consisted of five health system characteristics and six practice characteristics. System characteristics of a nation are very important for national primary care strength because they have a strong effect on practice characteristics.3) From this point, the score differences in our study between the two groups may tend to be small because national health system characteristics are the same for both.
From the standpoint of Donabedian's framework,23) physician groups in our study were equivalent in structural factors such as personnel, facilities and equipment, management and amenities, range of services, organization of services, mechanisms for providing continuity of care, mechanisms for providing access to care, arrangements for financing, delineation of the eligible population, and governance of the health system.3) The score differences between the two groups in our study resulted from the sum of the structural factors. However, it is difficult to identify the specific attributable factors that account for the difference because they are interrelated. Below, we shall discuss the relevant factors at an intuitive and integrative level.
In the comprehensiveness domain, the average score of the primary care physician group (1.19) was significantly higher than that (0.85) of the non-primary care physician group (Table 3). This finding was similar to that of the Baltimore City Primary Care Study result, in that the comprehensiveness score was higher in family practice, internal medicine, pediatrics, and general surgery than in other specialties.5) This finding is also consistent with Rosenblatt's report that general internists, family physicians, gastroenterologists, pulmonologists and general surgeons provided care for a broad range of diagnoses.4)
Scores of items (medical check-up and periodic health examination) in the comprehensiveness domain were higher in the primary care physician group (Table 3). Higher scores for medical check-up items (for example, blood sugar, cholesterol, blood pressure control) in the primary care physician group were related to the basic criteria of comprehensiveness, which was used to classify the primary care physician group. It was also true that other specialists took care of more patients for their specific range of services. Higher scores in periodic health examination in the primary care physician group were related to the national designation requirement. The designation itself may be a desirable element for the primary care since it means interests in the preventive services. In contrast, higher (even though not significantly) scores of Pap smear tests in the non-primary care physician group may reflect the fact that obstetricians-gynecologists were in this group and that other doctors, especially pediatricians, performed the Pap smear less.
The scores in the coordination domain item (recommend health care resources) in the primary care physician group (0.91) and in non-primary care physician group (0.76) were not different between two groups and were low in both of them (Table 3). This may reflect the fact that self-owned clinic-based physicians tended to ignore the appropriate referrals because of a loose medical service delivery system, competition for patients among medical facilities, and short time with the doctor per patient in primary care clinics. The coordination function has become increasingly important due to increasingly large quantity of medical information and increasing prevalence of chronic, degenerative diseases. A measure for improving coordination function in the primary care community clinics should be looked for.
The higher family/community orientation score (borderline significance) and the item (reflect people's opinions on health care) score in the primary care physician group (Table 3) may be attributed to the fact that the primary care physician group has more interests on person and can have easier access to survey due to relatively narrower geographic area of service.
The average score of 3 domains was low (below midline point 2) in both groups (1.24 and 0.99), even though it was higher in the primary than in non-primary care physician group. This finding was consistent with Baek et al.12) The low score may be due to a large hospital-oriented medical culture, patients' indifference to primary care, deficiency of support for a health delivery system, and so on.24) The fee-for-service payment system may also be one reason. Much effort should be made to change healthcare system to improve primary care quality. However, much more effort should be simultaneously made to improve practice characteristics, since it will take much time to improve healthcare system characteristics.
Finally, the limitations of this study must be noted. First, the scores were based on user assessments, which reflected their experiences rather than actual outcomes of primary care. User perceptions are influenced by many factors. Recall bias may also intervene. However, this point of view has the advantage that the actual experiences of users were assessed, which could not be shown by any other method. Second, we took three domains out of the five original KPCAT domains to increase the telephone response rate. The KPCAT is also useful in domain scores. Further research is needed to check first contact care domain and personalized services domain even though they earned relatively high scores in previous studies.20,21) Third, general and disease characteristics of evaluators may influence scores. The random sampling method in this study solved the general characteristics problem. Disease characteristics themselves may be one component of clinic capacity rather than a confounding variable. Fourth, clinic users might misunderstand specialists as general physicians when the clinic did not express its specialty. When the specialty was that of a primary care group, there was no classification bias. If the specialty was that of a non-primary care group, the expected classification bias did not change our conclusion in this study because it influenced against our hypothesis. Fifth, a few medical facilities having more than 29 beds might have been included in this study in that some evaluators did not know the size of their clinic used as their source of care. This bias, if present, would not distort our conclusion because we used a random sampling method.
In conclusion, we found that the primary care physician group, including family physicians, internists, pediatricians, general practitioners, and general surgeons, showed higher primary care scores in the comprehensive domain and in the average of three domains (comprehensiveness, coordination, and family/community orientation) than the non-primary care physician group (the other specialties). In the future, studies of primary care assessment scores among each specialty and primary care provider quality based on real medical data such as the medical record, medical insurance claim data and other outcome parameters, will be needed.
ACKNOWLEDGEMENTS
This work was partly supported by the Dongguk University Research Fund of 2011.