The Utility of HbA1c as a Diagnostic Criterion of Diabetes
Article information
Abstract
Background
Hemoglobin A1c (HbA1c) was adopted as a new standard criterion for diagnosing diabetes. We investigated the diagnostic utility of HbA1c by comparing the 2003 American Diabetes Association (ADA) diagnostic criteria of diabetes with HbA1c of 6.5%. Furthermore, the cut-off value for HbA1c was investigated using receiver operating characteristic curves.
Methods
This study included 224 subjects without a history of diabetes that had a fasting plasma glucose level of above 100 mg/dL. The subjects had undergone a 75 g oral glucose tolerance test, and diabetes was defined as according to 2003 ADA criteria.
Results
The prevalence of newly diagnosed diabetes was 58.2% by the 2003 ADA criteria, and 47.8% by HbA1c of 6.5%, which underestimated the prevalence of diabetes. Compared with the 2003 ADA criteria, the sensitivity and specificity of HbA1c of 6.5% were 73.5% and 89.1%, respectively. The kappa index of agreement between 2003 ADA and HbA1c criteria was 0.60. The cut-off point of HbA1c for diagnosing diabetes was 6.45% (sensitivity, 73.3%; specificity, 88.2%; area under the curve, 0.85). HbA1c was significantly associated with fasting glucose (r = 0.82, P < 0.01), postprandial glucose (r = 0.78, P < 0.01), and homeostasis model assessment of insulin resistance (r = 0.16, P < 0.05).
Conclusion
For high risk patients whose fasting glucose was more than 100 mg/dL, HbA1c criterion underestimated the prevalence of newly diagnosed diabetes compared to the 2003 ADA criteria, and showed moderate agreement. The cut-off value for HbA1c was 6.45%, which was similar to the recommended diagnostic criterion of HbA1c by the 2009 ADA.
INTRODUCTION
The prevalence of type 2 diabetes is constantly increasing in Korea because of a change in life style and the westernization of eating habits.1) In particular, at least 4-7 years passes before type 2 diabetes gets clinically diagnosed,2) and 25% of diabetes patients are considered to have microvascular complications such as diabetic nephropathy, diabetic retinopathy, or diabetic neuropathy.3,4) Since strict plasma glucose management from the early stage of diagnosis is important in preventing complications of diabetes, it is necessary to have adequate treatment immediately after the early diagnosis.5)
Currently in Korea, cases with abnormalities in fasting plasma glucose (FPG) and oral glucose tolerance test (OGTT) based on the diagnostic criteria suggested by the American Diabetes Association (ADA) in 2003 are diagnosed as diabetes.6) In 2009, the International Expert Council of the ADA published a new diagnostic criteria and hemoglobin A1c (HbA1c) was added to it as a diagnostic method of type 2 diabetes.7,8) HbA1c displays high reproducibility compared with the FPG or OGTT, reflects the plasma glucose control condition for the most recent 2-3 month period, and offers the advantage of not needing to fast at the time of the test. In addition, HbA1c is also known as a better predictive factor for diabetic retinopathy and cardiovascular disease.9,10) Even though some reports suggest that HbA1c is useful in diagnosing diabetes,5,9-11) other reports show that diagnostic usefulness is low because of the reduced sensitivity.12,13) Therefore, there is a controversy over whether HbA1c is useful as diagnostic criterion of diabetes. In addition, there are few researches which investigate whether any changes occur in the diagnostic aspect of diabetes in Koreans by adding HbA1c to the previous diagnostic criteria.
Therefore, the first purpose of this study was to examine the diagnostic usefulness of HbA1c by analyzing the specificity and sensitivity of HbA1c compared with the specificity and sensitivity of the 2003 ADA criteria. The second purpose of this study was to examine the changes of diagnostic aspects of diabetes by adding HbA1c to the 2003 ADA criteria.
METHODS
1. Participants
Out of 1,825 individuals who visited the outpatient Family Medicine Clinic of Dankook University Hospital and had a FPG ≥ 100 mg/dL from May 2004 to December 2009, we included 224 individuals in whom 75 g OGTT was undertaken.
The participants who were excluded from this study included those who had been previously diagnosed with diabetes or cancer, had a body temperature of 38.0℃ or more, white blood cell count of 105/L or more, and pyuria or hematuria, and who had infiltration in chest radiography. Patients who were pregnant, received blood transfusion within the last 6 months, had abnormal kidney, liver, and thyroid function, had hemoglobin of 13 g/dL or less (male) or hemoglobin of 12 g/dL or less (female), were also excluded from this study because of the possible influence of all these factors on HbA1c and insulin.
2. Measurements
Before 75 g OGTT was conducted, age, sex, and medical history related to diabetes in the past were examined in all patients, as well as blood pressure, height and weight. Blood pressure was measured when patients took a 5 minute rest in a chair with a back, and body mass index (BMI) was calculated by dividing body weight (kg) by square of height (m2). All the patients underwent the basic fasting glucose test after at least 10 hours overnight fast or more. The 75 g OGTT was performed for patients with FPG ≥ 100 mg/dL. HbA1c was measured using high performance liquid chromatography (BioRad, Richmond, CA, USA) and its coefficient of variation was 3%. Serum insulin concentration was measured with an immunoradiometric assay (Dream Gamma-10, Shinjin Medics Inc., Seoul, Korea), and its coefficient of variation was 2.1-4.5% of the intra-assay, and 4.7-12.2% of the inter-assay. Total cholesterol, triglyceride, high density lipoprotein cholesterol, aspartate aminotransferase, alanine aminotransferase, and gamma-glutamyl transpeptidase were measured through an automatic analyzer (Hitachi Modular DP; Hatachi Ltd., Tokyo, Japan).
3. Definition
The definition of diabetes was determined as: 1) FPG ≥ 126 mg/dL, or 2) 2-hour plasma glucose ≥ 200 mg/dL during OGTT, according to the 2003 ADA criteria. As typical symptoms of diabetes were not examined, diagnosis was not made with this consideration. The participants were defined as impaired fasting glucose (IFG; FPG levels, 100 to 126 mg/dL), or impaired glucose tolerance (IGT; 2-hour values in the OGTT, 140 to 200 mg/dL).6) As for HbA1c, according to the recommendation of 2009 ADA, patients with HbA1c < 5.7% were classified as normal, 5.7-6.4% as pre-diabetes, and ≥ 6.5% as diabetes.14) For the index of insulin resistance, homeostasis model assessment of insulin resistance (HOMA-IR) index was used and calculated as follows15): HOMA-IR = fasting insulin (µIU/mL) × FPG (mmol/L)/22.5.
4. Statistical Analysis
We expressed continuous variables as mean ± standard deviation (SD), and categorical variables as percentages. Receiver operating characteristic curves were generated to calculate sensitivity and specificity of HbA1c cut-off points for diabetes diagnosis. The kappa-coefficients were used to test the agreement between HbA1c and blood glucose concentration (that is, FPG and two hour plasma glucose during OGTT).
Spearman's correlation analysis was used to investigate the association of blood glucose concentrations with HbA1c and metabolic risk factors adjusted for age and sex. For statistical analysis, SPSS ver. 18.0 (SPSS Inc., Chicago, IL, USA) was used. Significance was defined as P < 0.05.
RESULTS
The average age of the participants was 49.8 ± 10.5 years. There were 167 males (74.5%), and 57 females (25.5%). The average BMI was 25.4 ± 2.9 kg/m2 (Table 1). According to the glucose tolerance status derived from OGTT, 7.1% were classified as normal, 4.0% as IGT, 17.9% as both IGT and IFG, and 58.9% as newly diagnosed with diabetes. The glucose tolerance status within categories of HbA1c is shown in Table 2. Majority of the subjects (90.7%) with HbA1c ≥ 6.5% were also classified as diabetes by the OGTT, whereas 9.3% of them were classified as pre-diabetes. For subjects in the pre-diabetes category by HbA1c, 56.2% were classified as pre-diabetes, 32.3% as diabetes, and 11.5% as normal glucose tolerance (NGT) by the OGTT. Only 23.8% of the subjects with HbA1c < 5.7% were classified as NGT, 57.2% as pre-diabetes, and 19.0% as diabetes by the OGTT. HbA1c and IFG diagnosis showed a corresponding result in 156 persons, which represented 69.6% of the entire group of participants. The concordance rate between HbA1c criteria and OGTT was 69.6%.
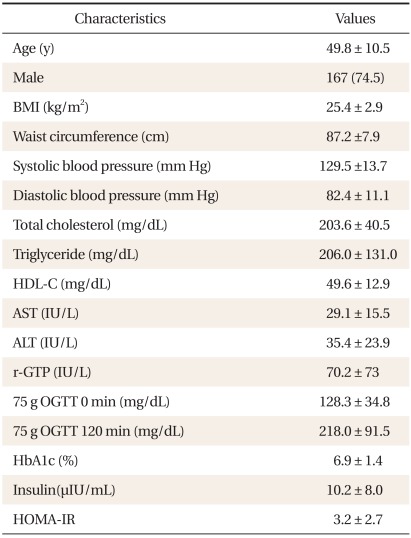
Characteristics of the subjects (n = 224).
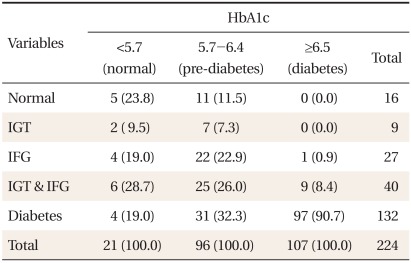
Glucose tolerance status according to the HbA1c categories and the oral glucose tolerance test.
The kappa index of agreement of 2003 ADA criteria with HbA1c criterion was 0.60, whereas that with FPG criterion was 0.65, and that with 2-hour plasma glucose criterion was 0.89, which was the highest among these three criteria. The number of subjects newly diagnosed with diabetes according to the 2009 ADA recommendation was 142 (63.4%) and the increase in prevalence by the additional application of HbA1c to the 2003 ADA criteria was 7.6%. Area under curve (AUC) for HbA1c was 0.86 (95% confidence interval [CI], 0.81 to 0.91), which was similar to AUC for FPG (0.89; 95% CI, 0.85 to 0.93) and lower than AUC for 2-hour plasma glucose (0.97; 95% CI, 0.94 to 0.99) (Table 1). The optimal threshold of HbA1c in identifying type 2 diabetes was 6.45%, with a sensitivity of 73.3%, specificity of 88.2%, positive predictive value of 99.3%, and negative predictive value of 23.2% (Figure 1).
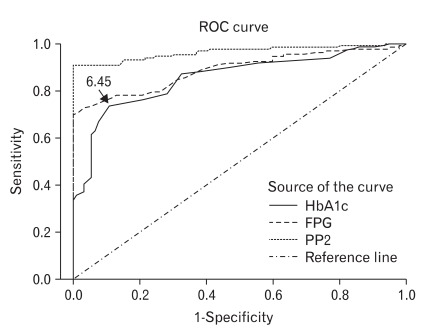
Receiver operating characteristic (ROC) curves for hemoglobin A1c (HbA1c) in identifying subjects with diabetes by the 2003 American Diabetes Association (ADA) criteria. Diagnal segments are produced by ties. FPG: fasting plasma glucose, PP2: two hour plasma glucose during 75 g oral glucose tolerance test.
Spearman's correlation coefficients of blood glucose concentrations with HbA1c and metabolic risk factors are shown in Table 3. Spearman's correlation coefficient of HbA1c with FPG and with 2-hour plasma glucose were similar (0.82, P < 0.01 and 0.78, P < 0.01, respectively) and that between FPG and 2-hour plasma glucose was 0.82 (P < 0.01) (Table 3). FPG showed significant correlation with triglyceride (r = 0.17, P < 0.05), systolic blood pressure (r = -0.16, P < 0.05), and HOMA-IR (r = 0.30, P < 0.01). Two hour plasma glucose showed significant correlation with systolic blood pressure (r = -0.17, P < 0.05), diastolic blood pressure (r = -0.15, P < 0.05), and HOMA-IR (r = 0.2, P < 0.01). HbA1c showed statistically significant correlation with systolic blood pressure (r = -0.16, P < 0.05), diastolic blood pressure (r = -0.18, P < 0.05), total cholesterol (r = 0.16, P < 0.05), triglyceride (r = 0.21, P < 0.01), and HOMA-IR (r = 0.16, P < 0.05).
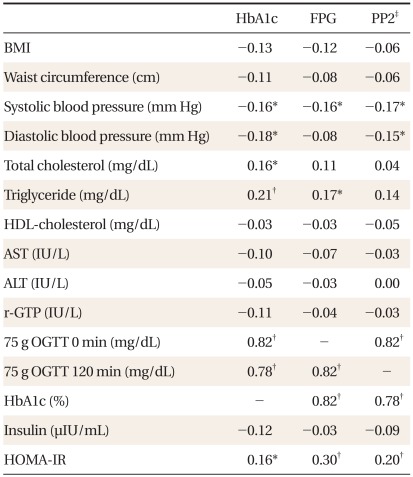
Spearman's correlation coefficients for the relationship between glycemic measures as well as with other metabolic variables with adjustment for age and sex.
DISCUSSION
This study investigated the diagnostic usefulness of HbA1c criterion by comparing it with the 2003 ADA criteria among high risk subjects whose FPG was 100 mg/dL or more. The prevalence of newly diagnosed diabetes was 58.2% according to the 2003 ADA criteria, but 47.8% by HbA1c criterion, suggesting that HbA1c underestimated the prevalence of diabetes by 10.4% compared with 2003 ADA criteria. These results corresponded to recent research results.16-18) The prevalence of newly diagnosed diabetes in the US Nutritional Health & Nutrition Examination Survey (NHANES) study on 14,611 persons aged 20 or more was 5.0% by OGTT and 1.8% by HbA1c, which underestimated the prevalence of diabetes by nearly 66% compared with OGTT.16) In a recent study of the residents of Qingdao, China, HbA1c diagnosed only 30% of the diabetes diagnosed by OGTT,17) and the Rancho Bernado study also showed that the sensitivity of HbA1c was lower compared with that of OGTT.18) Therefore, the results of this study and the previous studies suggest that diagnosing diabetes only through the HbA1c criterion is not recommended because there is the possibility that the prevalence of diabetes may be underestimated by using just HbA1c criterion.
In a situation where the prevalence of diabetes is increasing, as seen in Korea, diagnosing diabetes only through the HbA1c criterion may delay the early diagnosis of diabetes, which results in a different treatment goal for cardiovascular risk factors such as cholesterol, triglyceride, and blood pressure, and the frequency of complications of diabetes is expected to increase. Therefore, diabetes should be diagnosed with HbA1c and plasma glucose together.
When subjects were classified into normal, pre-diabetes and diabetes according to the criteria of plasma glucose and HbA1c respectively, 90.7% of diabetic subjects by HbA1c were also diabetic by OGTT, but 9.3% of them were pre-diabetic by just OGTT. Only 56.2% of HbA1c assessed pre-diabetic subjects were pre-diabetic by OGTT, and only 23.8% of HbA1c assessed normal subjects were normal by OGTT, indicating that the concordance rate of HbA1c and OGTT diagnosis was 69.6%. OGTT missed 9.3% of the diabetic subjects detected by HbA1c, but HbA1c missed 26.5% of diabetic subjects detected by OGTT. This difference in diagnostic methods is presumed to reflect the different physiological aspects of plasma glucose.14) It is thought that a prospective cohort study is needed to investigate whether there is any difference in the incidence rate of diabetic complications depending on diagnostic methods.
Until now, Korean reports showed various cut-off values (5.3-6.4%) of HbA1c for diagnosing diabetes.19-23) Bae et al.20) conducted the OGTT on 1,482 subjects not yet diagnosed with diabetes, and reported that the cut-off value of HbA1c was 5.95% (sensitivity, 60.8%; specificity, 85.6%). Kim et al.24) conducted the OGTT on 392 persons who had IFG or were in the high risk group, and reported that the cut-off value of HbA1c was 6.1% (sensitivity, 81.8%; specificity, 84.9%). The cut-off value of HbA1c in this study was 6.45%. The reason why the cut-off value of HbA1c was reported differently in these studies was most likely due to differences in the subjects' age, method of recruitment, gold standard for diagnosis of diabetes, and risk factors such as obesity.25) The study for the proper cut-off value of HbA1c for diagnosing diabetes should be conducted among representative Korean people such as Korean NHANES (KNHANES).
In this study, HbA1c showed significant relationships with metabolic risk factors, including systolic blood pressure, diastolic blood pressure, triglyceride, total cholesterol, and HOMA-IR, but the degree of these relationships was not very high (Spearman's correlation coefficient of 0.2). The relationship of metabolic risk factors with FPG or with 2-hour plasma glucose was similar to that with HbA1c. This result supports the observation that HbA1c and cardiovascular risk factors have a significant relationship,26) and it corresponds with previous reports showing that HbA1c is superior or similar to FPG or 2-hour plasma glucose in predicting death rate from cardiovascular disease.10,27) Lorenzo et al.28) conducted OGTT and examined the association of HbA1c with FPG, 2-hour plasma glucose, and metabolism risk factors on 385 adults who had IGT, IFG or HbA1c of 5.7-6.4%. They showed that HbA1c had lower correlation coefficients with metabolic risk factors than with FPG or 2-hour plasma glucose. It is difficult to directly compare our study with theirs because their research was limited to subjects with HbA1c of 5.7-6.4%. In this study, a negative correlation of HbA1c with systolic blood pressure and diastolic blood pressure was found.29) We believe this was because factors such as anti-hypertensive medication were not adjusted. Further research should be done after adjusting such factors.
There were a few limitations to this study. First, the prevalence of diabetes was relatively high because this study was conducted on the high risk group with FPG ≥ 100 mg/dL, and it was difficult to generalize the results of this study since the analysis was done on a relatively small number of subjects. However, considering that the OGTT was conducted mainly on subjects with high FPG, it would be appropriate for the results of this study to be applied clinically. Second, this study was done on only 224 subjects in whom 75 g OGTT was undertaken out of 1,825 persons with FPG ≥ 100 mg/dL. An analysis of the difference in metabolic risk factors was not conducted. Third, FPG or random plasma glucose should be measured twice or more on different days at the time of diagnosis diabetes, but in this study diagnosis of diabetes was done by conducting OGTT once. However, this study has an advantage that it examined the diagnostic usefulness of HbA1c by comparing HbA1c, a new diagnostic criterion for diabetes, with OGTT.
In conclusion, HbA1c in the high risk group of diabetes with increased FPG underestimated the prevalence of diabetes, but showed moderate agreement with 2003 ADA criteria. The appropriate cut-off value of HbA1c was 6.45%, which was similar to the recommended diagnostic criterion of HbA1c by 2009 ADA.