Cardiopulmonary Fitness Is Independently Associated with Insulin Resistance in Non-Diabetes Mellitus Patients of a University Hospital in Korea
Article information
Abstract
Background
Insulin resistance, decreased response of peripheral tissue to normal insulin levels, is known to be related to cardiometabolic diseases. Cardiopulmonary fitness is also considered to be related to these comorbidities. Therefore, we investigated the relationship between insulin resistance and cardiopulmonary fitness by performing a 3-minute step test in a Korean non-diabetes mellitus (DM) population.
Methods
A total of 118 non-DM subjects were enrolled during their routine health check-up. Insulin resistance was measured by calculating homeostatic model assessment-insulin resistance (HOMA-IR), and a 3-minute step test was performed to measure cardiopulmonary fitness.
Results
Post-60 seconds exercise heart rate after 3-minute test (R60 heart rate) was correlated with age (r = -0.21, P = 0.02), education (r = 0.17, P = 0.04), body mass index (r = 0.23, P = 0.01), waist circumference (r = 0.28, P < 0.01), fasting insulin (r = 0.28, P < 0.01), HOMA-IR (r = 0.25, P < 0.01), low density lipoprotein-cholesterol (r = 0.28, P < 0.01), high sensitivity C-reactive protein levels (r = 0.22, P = 0.02), and baseline heart rate (r = 0.56, P < 0.01). In a step-wise multiple regression analysis, baseline heart rate (β = 0.79, P < 0.001), HOMA-IR (β = 0.65, P = 0.02), and systolic blood pressure (β = 0.15, P = 0.03) were identified as explanatory variables for R60 heart rates.
Conclusion
Our results suggested that cardiopulmonary fitness was associated with insulin resistance in non-DM patients of a university hospital in Korea. Further studies are needed to elucidate the underlying mechanisms.
INTRODUCTION
Insulin resistance, the decreased response of peripheral tissue to normal insulin levels, is a known underlying cause of type 2 diabetes mellitus (DM), and is also associated with increased risk of co-morbidities including metabolic syndrome and cardiovascular disease.1) Therefore, it would be useful to find the related factors associated with insulin resistance.
Cardiopulmonary fitness, also called cardiopulmonary endurance or aerobic fitness, is the ability to exercise continuously for extended periods without tiring while working the heart and lungs. Cardiopulmonary fitness is measured by the maximal oxygen consumption test (VO2max) or sub-maximal test including treadmill test. However, these methods require time, qualified personnel, and resources. The 3-minute step test is a relatively quick and easy test for measuring cardiopulmonary fitness and the correlation between the results of the 3-minute step test and maximal oxygen consumption test (VO2max) has been validated in many studies.2-5)
Increased cardiopulmonary fitness is known to reduce the risk of cardio-metabolic diseases.6-10) It has been reported that low cardiopulmonary fitness is an independent predictor of all-cause and cardiovascular disease mortality. Cardiopulmonary fitness is considered to affect these co-morbidities by regulating cardiac output and blood pressure.11) Furthermore, the association between cardiopulmonary fitness and insulin resistance has been reported in adults with DM or healthy young adolescents.10,12-14) Although, the precise role of cardiopulmonary fitness in insulin resistance has not been fully elucidated, increased cardiopulmonary fitness is thought to influence the expression of the glucose transporter and insulin signaling pathway. However, there are no current studies that evaluate the association between insulin resistance and cardiopulmonary fitness in the adult population without a history of DM. Therefore, this study investigated the relationship between insulin resistance and cardiopulmonary fitness by performing a 3-minute step test in non-DM patients of a university hospital in Korea.
METHODS
1. Subject
Study subjects consisted of 226 patients who visited the department of family medicine in Severance Hospital for a routine health check up between September 2009 and October 2011. Among 226 patients, a total of 175 patients agreed to receive the exercise test including step test. Written informed consent was obtained from all participants. All subjects completed a questionnaire about lifestyle factors including alcohol consumption, cigarette smoking, and exercise. Of the participants, we excluded the subjects with underlying medical conditions including a history of DM, chronic liver disease, chronic kidney disease, coronary artery occlusive disease, or cancer. People with abnormal liver or kidney function were also excluded. Abnormal liver function was defined as serum aspartate aminotransferase or alanine aminotransferase concentrations >100 IU/L. Abnormal kidney function was defined as serum creatinine concentration >1.4 mg/dL. We also excluded participants who were taking any medications that affect cardio-metabolic function including oral hypoglycemic agents, insulin agents, anti-hypertensive agents, or anti-obesity agents. Participants who could not undertake a fitness evaluation because of physical or psychological conditions were also excluded. After exclusion, a total of 118 adults without DM were finally included in this study (Figure 1).

Patient selection flow-chart for our study evaluating the association of cardiopulmonary fitnesss and insulin resistance.
2. Anthropometric Measurement
Body mass index (BMI) was calculated by dividing weight by square of height (kg/m2). Waist circumference (WC) was measured at the midpoint between the lower border of the rib cage and the iliac crest. Body fat percentage was measured by bioelectric impedance analysis equipment (Inbody 330; Biospace, Seoul, Korea). Brachial artery blood pressure was measured with a sphygmomanometer with the subject in a sitting position at rest for two minutes.
3. Blood Collection and Biochemical Analysis
Subjects were requested to fast at least 8 hours before the blood test. Venous blood was collected, centrifuged, and the separated serum was frozen immediately at -80℃. Serum levels of fasting glucose, total cholesterol (TG), high density lipoproteincholesterol (HDL)-C, and triglycerides were assayed using an ADIVA 1650 chemistry system (Seimens, Tarrytown, NY, USA). Fasting insulin was assayed via electrochemiluminescence immunoassay using Elecsys 2010 (Roche, Indianapolis, IN, USA), high sensitive C-reactive protein (hs-CRP) was measured using an ADIVA 1650 chemistry system (Siemens; Tarrytown, NY, USA). Insulin resistance (as determined with the homeostasis model assessment of insulin resistance [HOMA-IR]) was calculated by a formula, HOMA-IR = fasting plasma insulin level (µU/mL) × fasting plasma glucose level (mmoL/L) /22.5/18.
4. Young Men's Christian Association 3-Minutes Step Test
The standardized 3-minute step test (step height of 30.5 cm) was used to evaluate cardiopulmonary fitness. Before the test, the procedures of the step test were explained and shown to the participants. Prior to the step test, heart rate monitor was attached. After at least 5 minutes resting in a seated position, participants' heart beat was measured using a heart rate monitor before the test. The test began by demonstrating the alternating stepping cadence to the subject: in time with the beat, step one foot up on the bench (1st beat), step up with the second foot (2nd beat), step down with one foot (3rd beat), and step down with the other foot (4th beat.) The subject was allowed to practice the stepping to the metronome cadence, which was set at 96 beats per minute (4 clicks = one step cycle) for a stepping rate of 24 steps per minute. The participants stepped up and down on the platform at the given rate for a total of 3 minutes. The participants immediately stopped on completion of the test and sat down and remained still. Starting within 5 seconds, the tester was to count the subject's heart for one complete minute.
5. Statistical Analysis
Normally distributed data was expressed as mean ± SD, and non-normally distributed data was expressed as median and interquartile range. Pearson and Spearman correlation analysis was performed to evaluate relationships between R60 minutes and other metabolic variables. Multiple linear regression analysis was used to identify factors contributing to R60 heart rates. We performed all statistical analyses using the SPSS ver. 18.0 (SPSS Inc., Chicago, IL, USA). Statistical significance was defined as P < 0.05.
RESULTS
Table 1 shows the basic characteristics of the 118 subjects. The mean age of subjects was 37.06 ± 12.52 years. The mean baseline heart rate was 76.82 ± 10.95 beat/min and the mean heart rate after 60 seconds resting (R60 heart rates) was 94.18 ± 15.91 beat/min.
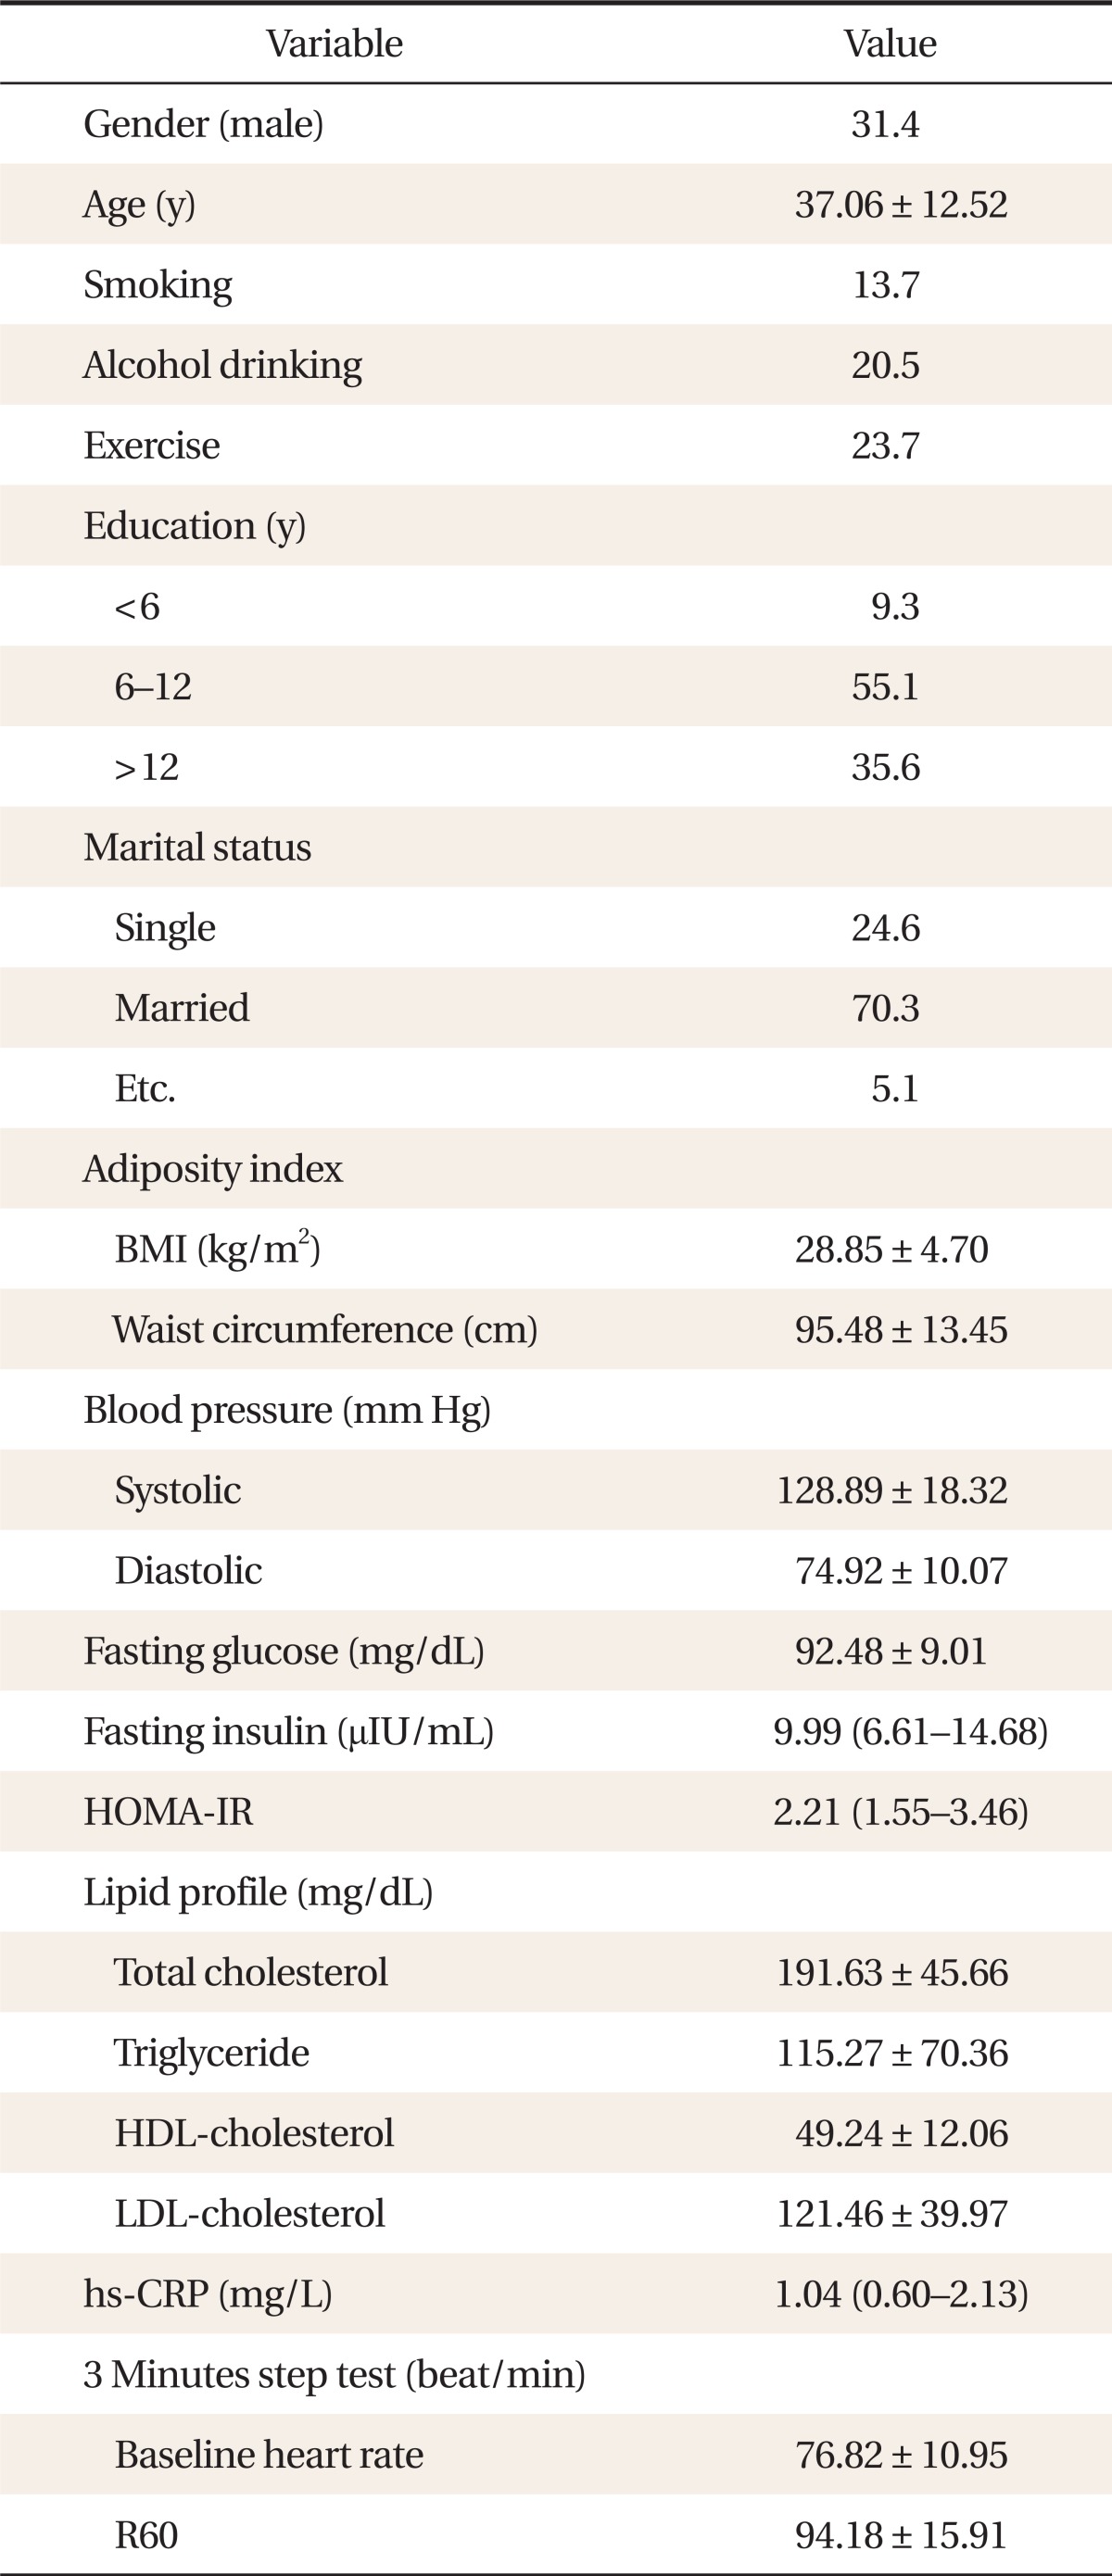
Clinical characteristics of study subjects (n = 118)
The relationship between R60 heart rate and other clinical parameters is shown in Table 2. R60 heart rate was correlated with age (r = -0.21, P = 0.02), education (r = 0.17, P = 0.04), BMI (r = 0.23, P = 0.01), WC (r = 0.28, P < 0.01), fasting insulin (r = 0.28, P < 0.01), HOMA-IR (r = 0.25, P < 0.01), low density lipoprotein-cholesterol (r = 0.28, P < 0.01), hs-CRP levels (r = 0.22, P = 0.02), and baseline heart rate (r = 0.56, P < 0.01). Figure 2 shows the relationship between HOMA-IR and R60 heart rates. HOMA-IR had a positive correlation with R60 heart rates.
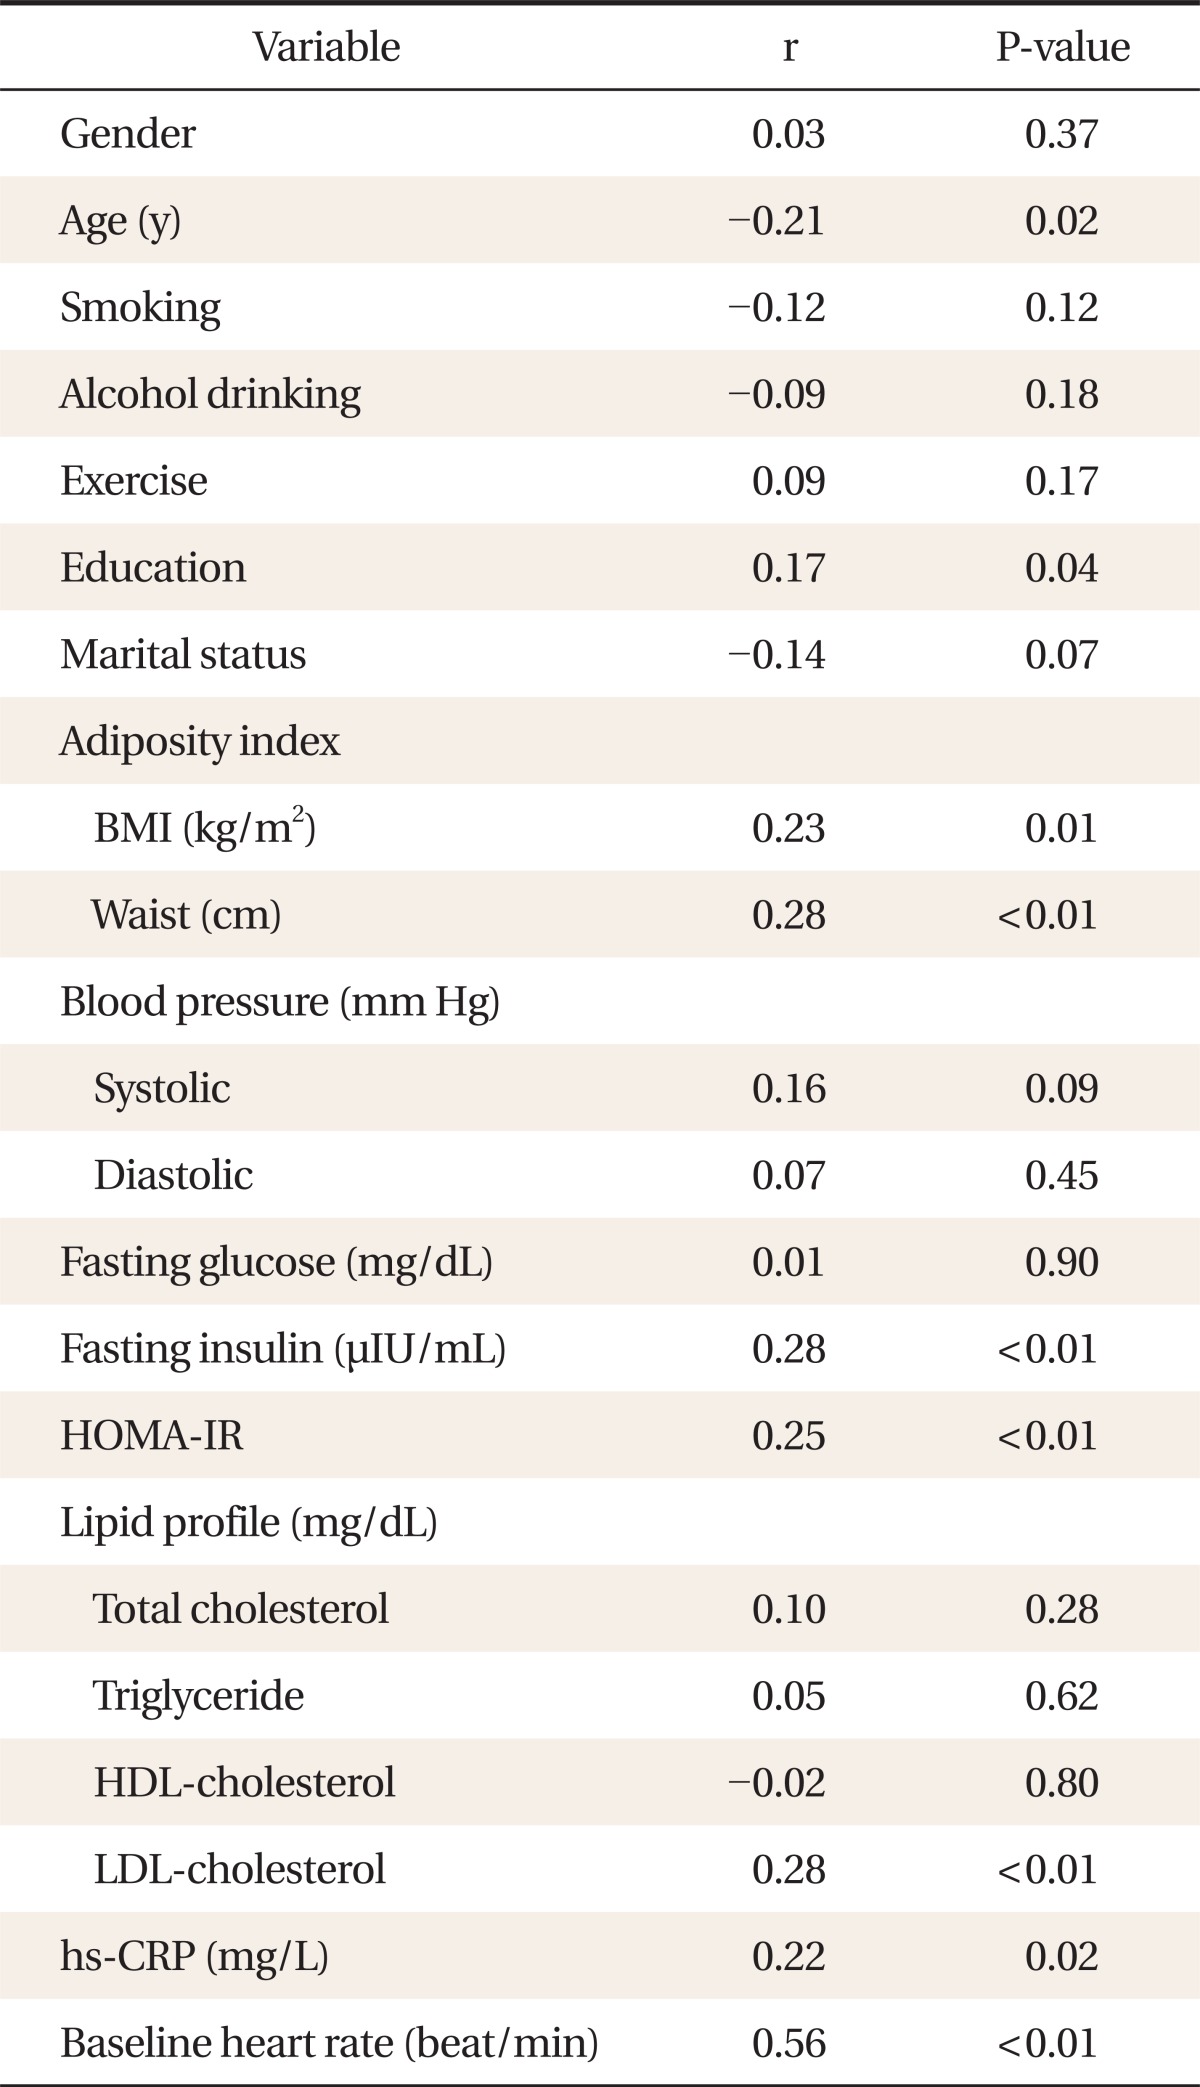
The correlation between R60 and clinical parameters
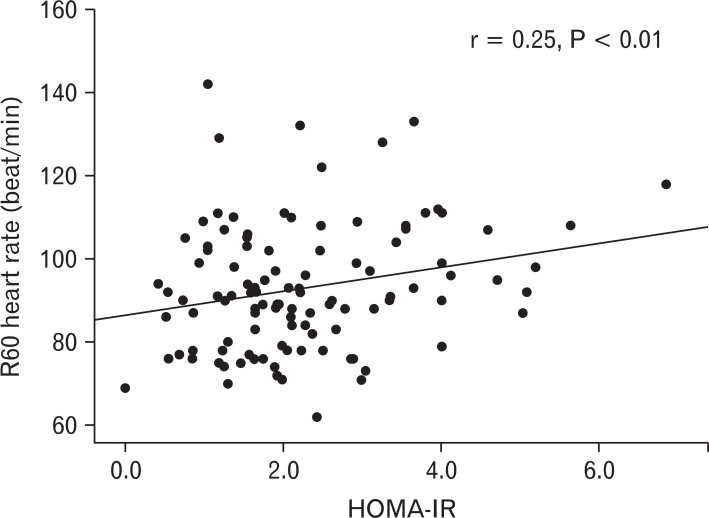
The relationship between homeostasis model of assessment of insulin resistance (HOMA-IR) and post-exrcise 60 seconds heart rate (R60).
The independent association between R60 heart rate and other clinical parameters is shown in Table 3. After step-wise multiple regression analysis, baseline heart rate (β = 0.79, P < 0.001), HOMA-IR (β = 0.65, P = 0.02), and systolic blood pressure (β = 0.15, P = 0.03) were identified as explanatory variables for R60 heart rates, explaining a total of 35% of the variance in R60 heart rates.
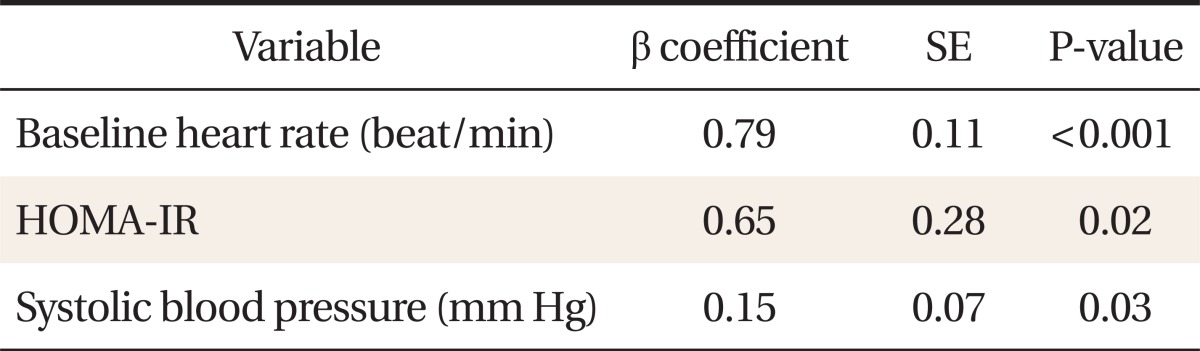
Stepwise multiple regression analysis for access the independent relationships between R60 levels and clinical parameters
DISCUSSION
Our cross-sectional study showed an inverse relationship between insulin resistance and cardiopulmonary fitness by analyzing the data of 118 non-DM people. This relationship was significant after adjusting for other covariates.
Our result was consistent with previous studies. Wei et al.15) found low cardiopulmonary fitness was related to increased risk for impaired fasting glucose and type 2 DM. Similarly, Sawada et al.16) and Lee et al.17) also reported an association between cardiopulmonary fitness and DM development. However, previous studies only enrolled adults with a history of DM or impaired fasting glucose. To our knowledge, this is the first study to evaluate the relationship between insulin resistance and cardiopulmonary fitness in an adult population without a history of DM.
The precise underlying mechanisms that explain the relationship between cardiopulmonary fitness and insulin resistance have remained uncertain. However possible mechanisms have been proposed. Current reviews suggested that an active lifestyle has favorable effects on glucose metabolism and insulin sensitivity through several mechanisms involving an increased level of the glucose transporter (GLUT)-4 protein, which is the main isoform in skeletal muscles involved in the uptake of glucose through insulin stimulation. Cardiopulmonary fitness training increases GLUT-4 concentration in healthy middle-aged and old men whether they have DM or not.13,18,19) After 12 weeks of cardiopulmonary fitness training, GLUT-4 levels increased to 60% in individuals with impaired glucose tolerance, and 11% in the glucose disposal group.20) Therefore, the expression of the glucose transporter may be the link between cardiopulmonary fitness and insulin resistance.
This study has several limitations. First, our cross-sectional design is limited in establishing causality between cardiopulmonary fitness and insulin resistance. Second, we enrolled a small number of participants who visited a single hospital for a general health check-up and agreed to receive the exercise function test; thus, this study may have been affected by selection bias. Therefore, our results do not allow for a generalization of the data to the population at large. Third, despite a direct measure of maximal oxygen uptake being the gold standard, we assessed cardiopulmonary fitness by using a 3-minute step test. However, the correlation between the results of the 3-minute step test and maximal oxygen consumption test (VO2max) has been validated in many studies. Furthermore the 3-minute step test is a relatively quick and easy test for measuring cardiopulmonary fitness and can be easily used in the clinical setting.
In conclusion, the high cardiopulmonary fitness represented by post-exercise heart beat was associated with reduced insulin resistance in non-DM people of a university hospital in Korea. Although it is impossible to determine causality based on this study, our findings collectively suggest that it would be feasible to measure cardiopulmonary fitness by performing a step test on subjects with a high risk of insulin resistance in the clinical setting. Further studies are needed to elucidate the underlying mechanisms in this study.
Notes
No potential conflict of interest relevant to this article was reported.