In this section, we explain the actual number of observations used in a multivariate analysis when one or more explanatory variables have missing values, which appeared in the articles titled, "Postmarketing surveillance study of the efficacy and safety of Phentermine in patients with obesity," by Kim et al.1) and "Relationships between dietary habits and allostatic load index in metabolic syndrome patients," by Kim2) published in September 2013.
MISSING VALUES IN MULTIVARIATE ANALYSES
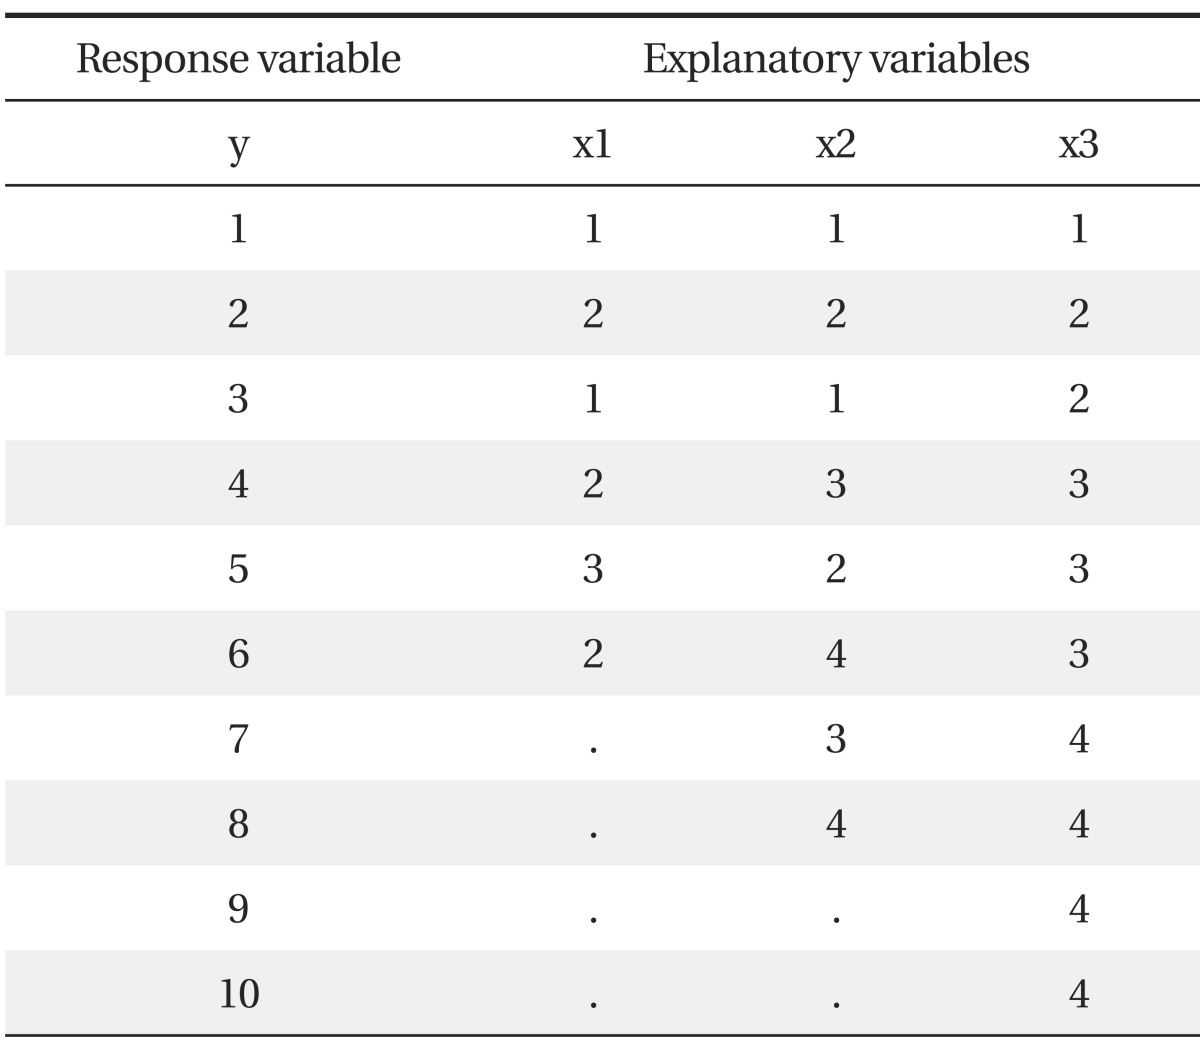
When there are some missing values in one or more variables, most researchers choose one of the following strategies for analysis: 1) delete all observations which have missing values or 2) use all observations regardless of missing values. The purpose of this section is to show how many observations are actually analyzed in multivariate analyses, such as multiple linear regression analysis or multiple logistic regression analysis, when there are different numbers of missing values in each explanatory variable. Let's perform a multiple linear regression using the following hypothetical data (Table 1).
In this data, explanatory variable x1 has four, x2 has two, and x3 has no missing values, respectively (denoted as a dot), and we will perform three analyzing processes using SPSS, 1) Pearson correlation analysis, 2) multiple linear regression analysis, and 3) stepwise multiple linear regression analysis.
PEARSON CORRELATION ANALYSIS
From the menus choose:
Analyze
Correlate
Bivariate...
Select all variables: y, x1, x2, x3
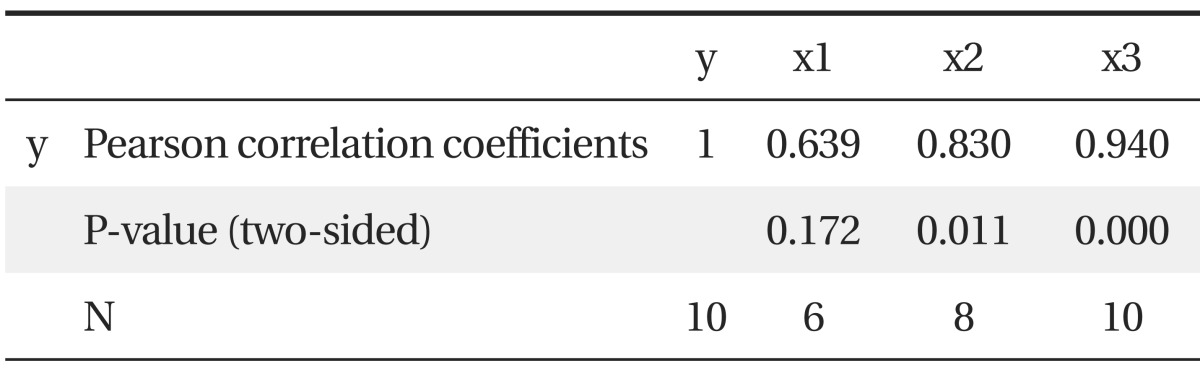
We obtain the following results: (Table 2).
X3 has the highest correlation with y, and explanatory variables, and x1, x2, and x3 are analyzed by using only their valid observations, 6, 8, and 10, respectively.
MULTIPLE LINEAR REGRESSION ANALYSIS
From the menus choose:
Analyze
Regression
Linear...
Choose dependent variable: y
Independent variables: x1, x2, x3
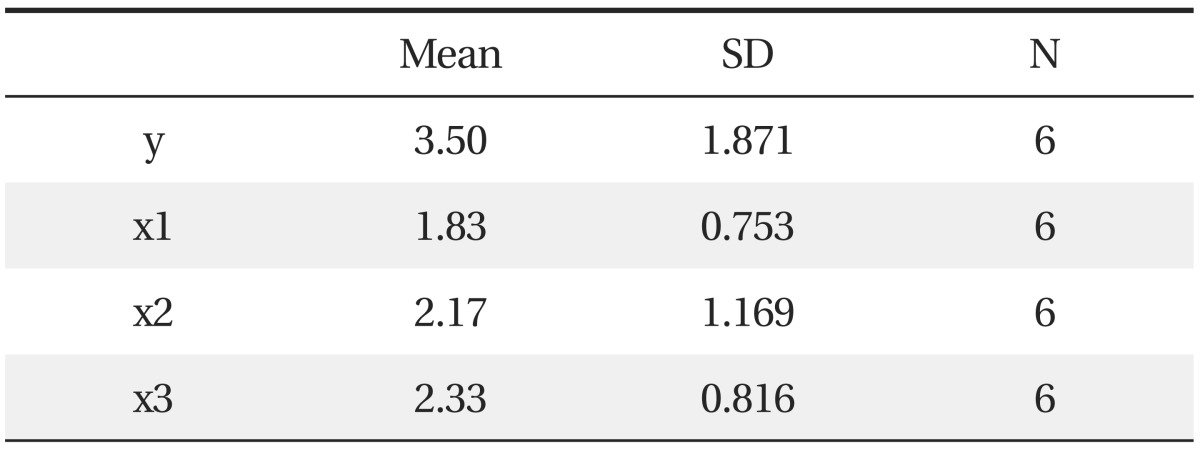
Options: statistics: descriptive statistics
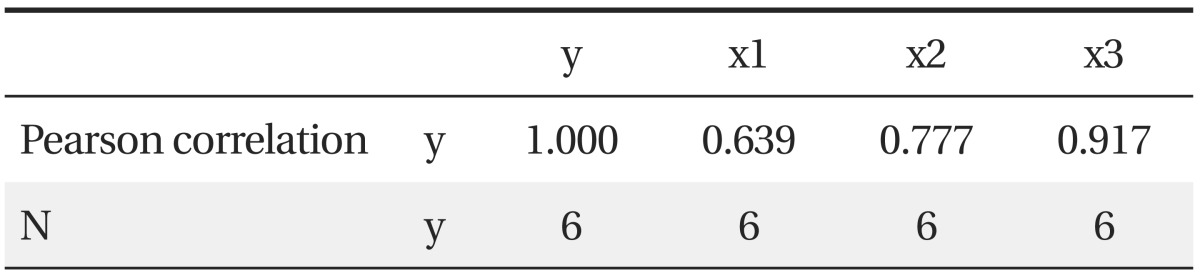
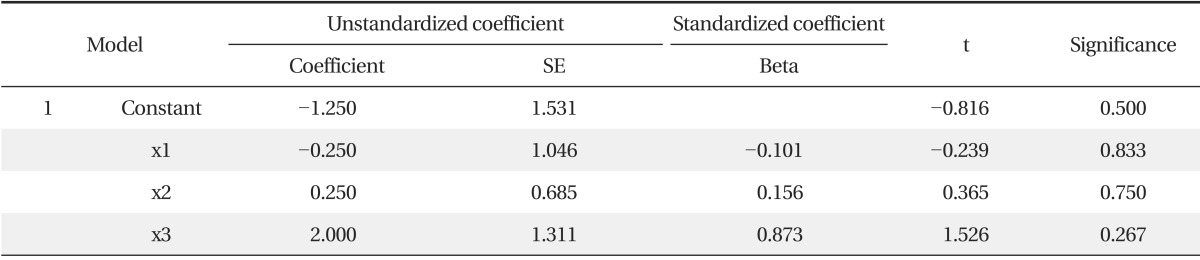
X3 has the highest correlation with y, but all analyses (descriptive statistics, correlation analysis, and multiple regression analysis) are performed using only six observations which have no missing values for all dependent variables.
STEPWISE MULTIPLE LINEAR REGRESSION ANALYSIS
(Menus, variable selection, and options are the same as the above)
Variable selection methods: stepwise
Descriptive statistics (the same as above results)
Correlation coefficients (the same as above results)
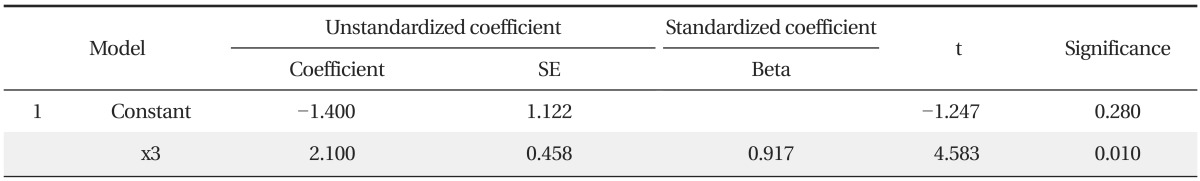
From the total degrees of freedom (df = 5) in the analysis of variance table, a stepwise multiple regression analysis is performed using only six observations which have no missing values for all explanatory variables, even though the results show that only one variable, x3, which has no missing values, remains in the final model.
As we can see from the above three results, the actual number of observations analyzed in a multivariate analysis is the minimum number of valid observations of all explanatory variables we had intended to include in the analysis, regardless of the variable selection methods.