Korean J Fam Med Search

CLOSE


Korean J Fam Med > Volume 36(4); 2015 > Article
Lee, Hahm, Park, Choi, Yoon, Choi, and Jeon: Measuring Low Density Lipoprotein Cholesterol: Comparison of Direct Measurement by HiSens Reagents and Friedewald Estimation

Abstract

Background

Directly measured low density lipoprotein cholesterol (DLDLC) has been reported to be more accurate than calculated low density lipoprotein cholesterol (CLDLC) using the Friedewald equation. However, some limitations of DLDLC have been reported. In this study, we evaluated differences between CLDLC and DLDLC measured using HiSens reagents.

Methods

Data were collected from 582 persons undergoing routine physical examinations at a general hospital. LDLC measurements were made directly or estimated using the Friedewald formula, and were classified according to the National Cholesterol Education Program's Adult Treatment Panel III guidelines. The relationship between these differences and other clinically relevant factors, such as triglyceride (TG) levels, were examined using multiple logistic regression analysis.

Results

The DLDLC and CLDLC were strongly correlated according to simple linear regression analysis (r=0.917, P<0.001) but the mean difference between measurements was -11.0±15.3 (-62 to 90.5) mg/dL (P<0.001). For more than 10 mg/dL of their absolute differences, the DLDLC was typically lower than the CLDLC. The highest discrepancies in LDLC measurements occurred when LDLC was more than 160 mg/dL and less than 190 mg/dL. Differences in LDLC measurements were prone to striking negative and positive biases dependent on CLDLC and TG concentrations, respectively (all r>0.5).

Conclusion

Unlike other studies, DLDLC was significantly lower than CLDLC and the large differences in LDLC concentrations were not dependent on TG concentration. Our work suggests that verification of DLDLC accuracy is needed and differences in LDLC measurements should be accounted for in making clinical decisions.

INTRODUCTION

Low density lipoprotein cholesterol (LDLC) is a major risk factor in atherosclerosis and coronary heart disease (CHD) and a main target for diagnosis and treatment of hyperlipidemia.1) The National Cholesterol Education Program Adult Treatment Panel III (NCEP ATP III) guidelines for hyperlipidemia, which are the most commonly referred to guidelines, were recently updated to ATP IV.2,3) These guidelines suggest that the calculated LDLC (CLDLC), assessed using the Friedewald formula, should be the primary lipid target for CHD risk reduction.4) The reference method for measuring LDLC is beta quantification.1,5) Friedewald-estimated LDLC is used in clinical practice because it is more convenient and less expensive than the more complicated and time-consuming beta quantification.6) However, the CLDLC is inaccurate when triglycerides (TG) are greater than 400 mg/dL, which occurs in dysbetalipoproteinemia and hyperlipoproteinemia secondary to diabetes, as well as when patients have not fasted.7,8,9,10)
Because of the limitations of the Friedewald calculation, homogenous methods capable of full automation have been introduced for directly quantifying LDLC.11) The direct LDLC (DLDLC) quantification produces variable results due to differences in the homogenization method and reagents. The Cholesterol Reference Method Laboratory Network (CRMLN) of the Centers for Disease Control of the United States certifies manufacturers of clinical diagnostic products and offers a list of validated reagents for accurate LDLC quantification.12) However, there are hospitals using the direct LDLC assay with components not listed by the CRMLM, which has led to questions regarding the assay's validity. Therefore, we evaluated assay performance using the domestic HiSens reagent in comparison to the LDLC calculated using the Friedewald equation.

METHODS

1. Population

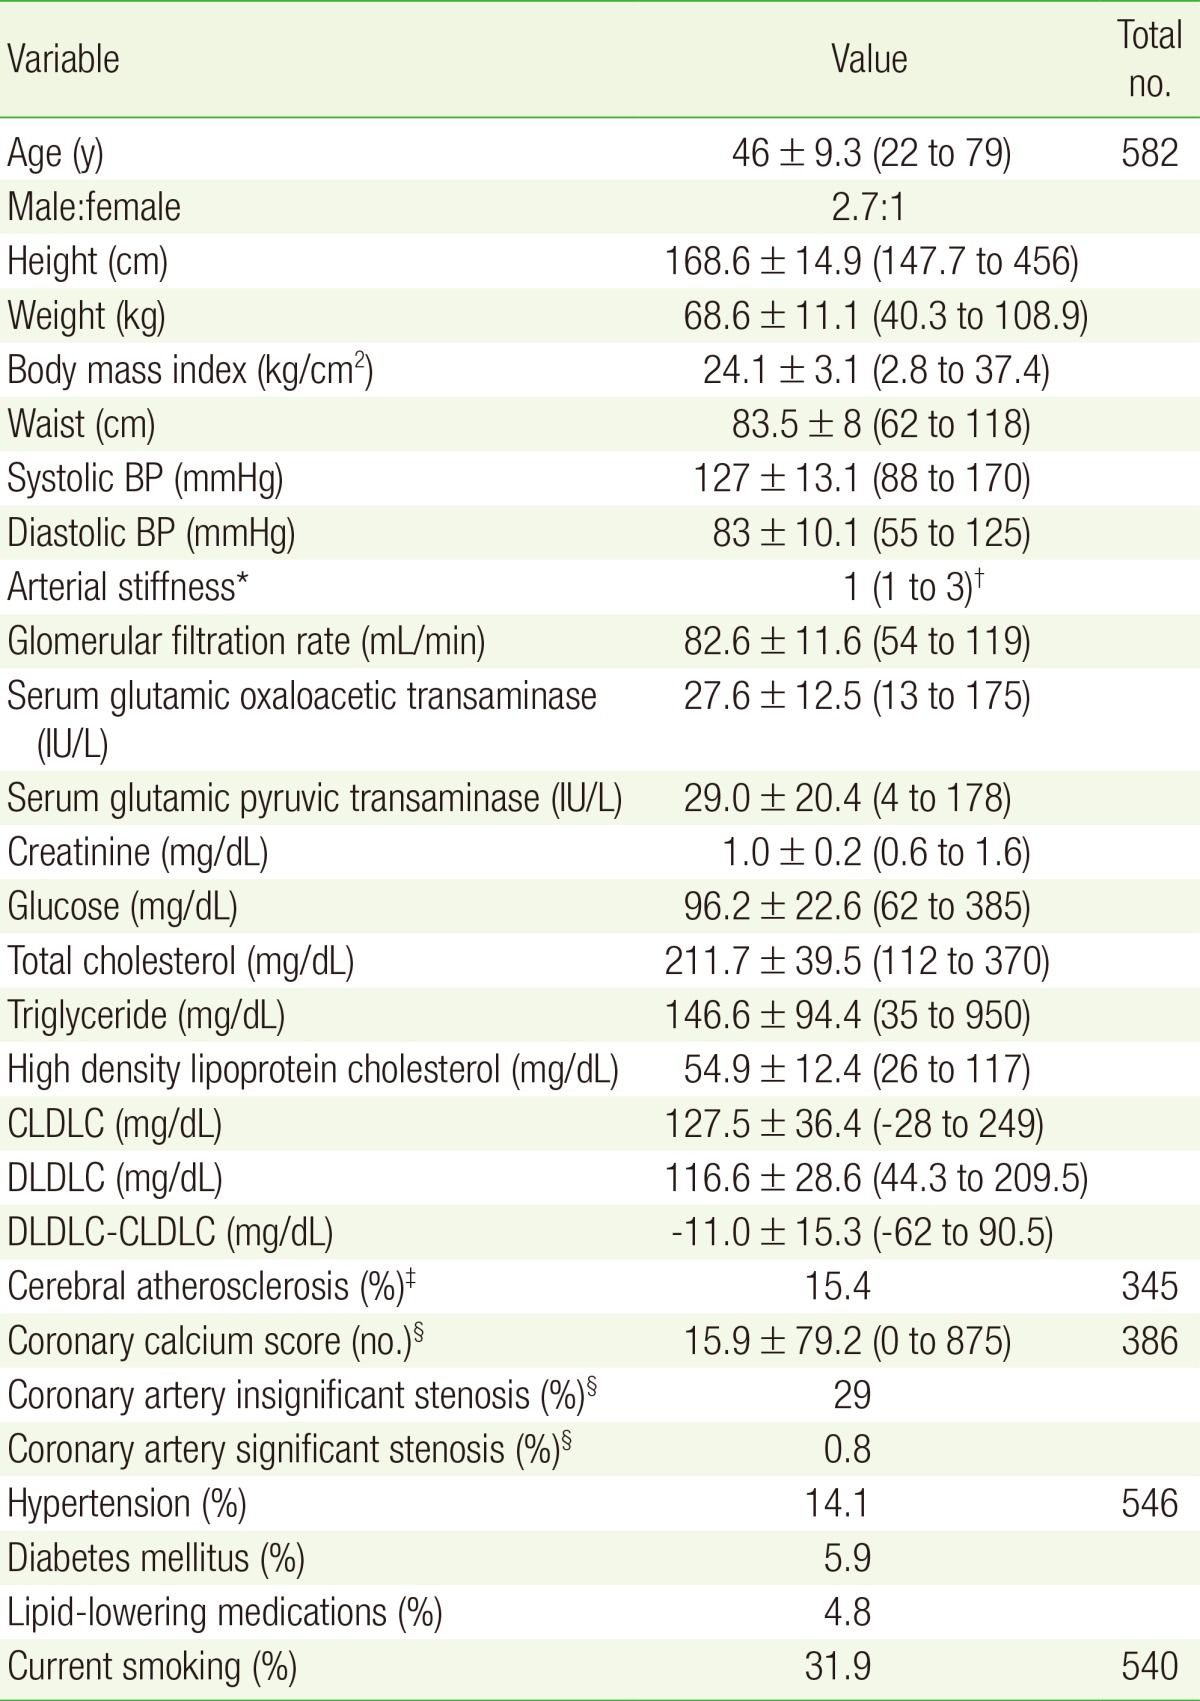
Our population consisted of 582 subjects who visited the health promotion center of the KEPCO Medical Center in Seoul, Repulic of Korea for general health check-ups between November 2012 and February 2013. Lipid profiles in the 12-hour fasting state, among other values, were analyzed (Table 1). All data were obtained by retrospective review of electronic medical records. The study protocol was reviewed and approved by the institutional review board of the KEPCO Medical Center (No. HIRB-2014-002).

2. Lipid Measurement

CLDLC was calculated using the Friedewald equation (LDLC =[total cholesterol (TC)]-[high density lipoprotein cholesterol (HDLC)]-TG/5).13) TC and TG were measured using the AU CHOLESTEROL A reagent and the AU TRIGLYCERIDE agent (Beckman Coulter Inc., Galway, Ireland). DLDLC and HDLC were measured directly using the HiSens LDLC and HiSens HDLC reagents (HBI Co. Ltd., Anyang, Korea), respectively. All lipid profiles except CLDLC were measured using the Olympus AU2700 chemistry analyzer (Beckman Coulter Inc., Fullerton, CA, USA).
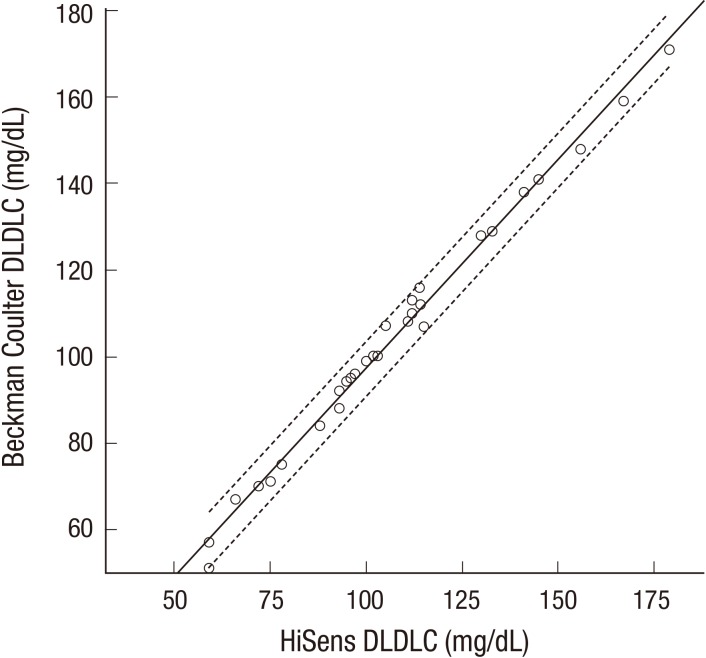
To verify the accuracy of DLDLC quantification using HiSens reagents, 30 samples with TG levels less than 400 mg/dL were randomly collected for quality control. DLDLC concentrations were compared to concentrations measured using the Beckman Coulter 5821 analyzer and dedicated reagent (BCDR) using simple regression analysis.

3. Statistical Analysis

The means±standard deviations and medians for continuous variables and proportions (percentiles) for categorical variables were calculated for all descriptive statistics. The differences in LDLC concentrations were analyzed by two sample paired t-tests, linear regression analysis using Pearson's correlation coefficients, and the multiple logistic regression analysis. A P-value of less than 0.05 was considered statistically significant. All statistical analyses were performed with the statistical software package PASW SPSS ver. 18.0 (SPSS Inc., Chicago, IL, USA).

RESULTS

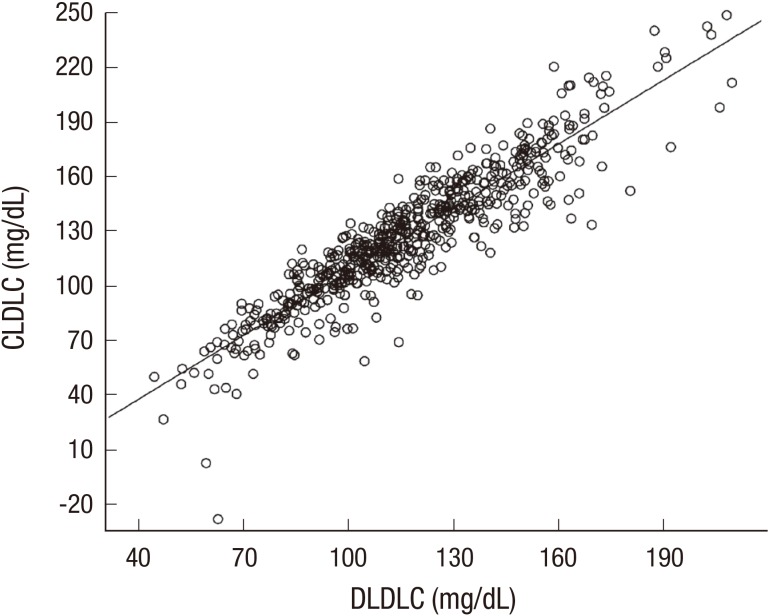
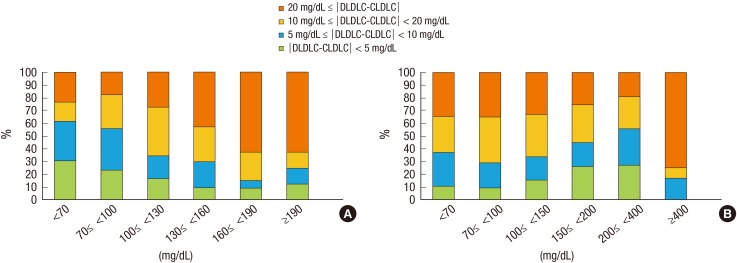
The population baseline characteristics are listed in Table 1. The mean of DLDLC and CLDLC were 116.6±28.6 mg/dL (range, 44.3 to 209.5 mg/dL) and 127.5±36.4 mg/dL (range, -28 to 249 mg/dL), respectively. The DLDLC and CLDLC values were strongly correlated according to simple linear regression analysis (Pearson's correlation coefficient r=0.917, P<0.001) (Figure 1). However, the mean difference between DLDLC and CLDLC was -11.0±15.3 mg/dL (range, -62 to 90.5 mg/dL), and the DLDLC was significantly lower than CLDLC (P<0.001). For 61.9% of subjects, the absolute difference in LDLC measurements was more than 10 mg/dL, and for 86.9% of these subjects, the DLDLCs were lower than the CLDLCs. For 30.9% of subjects, the absolute difference in LDLC measurements was more than 20 mg/dL, and for 87.8% of these subjects, the DLDLCs were lower than the CLDLCs. The fraction of subjects with the absolute difference, more than 20 mg/dL of LDLC measurements increased dependent to DLDLC concentrations (Figure 2). Simple linear regression analysis suggested that the difference in LDLC measurements was negatively correlated with DLDLC and CLDLC (Figure 3). The categorical concordance of LDLC measurements according to the NCEP ATP III guidelines was only high in LDLC concentrations less than 70 mg/dL and 190 mg/dL or more (Table 2). The differences in LDLC measurements were positively correlated with TG concentration (r=0.557, P<0.001) (Figure 3). The fraction of subjects with the absolute difference, more than 10 mg/dL of LDLC measurements decreased dependent to TG concentrations except for 400 mg/dL or more unlike DLDLC (Figure 2).
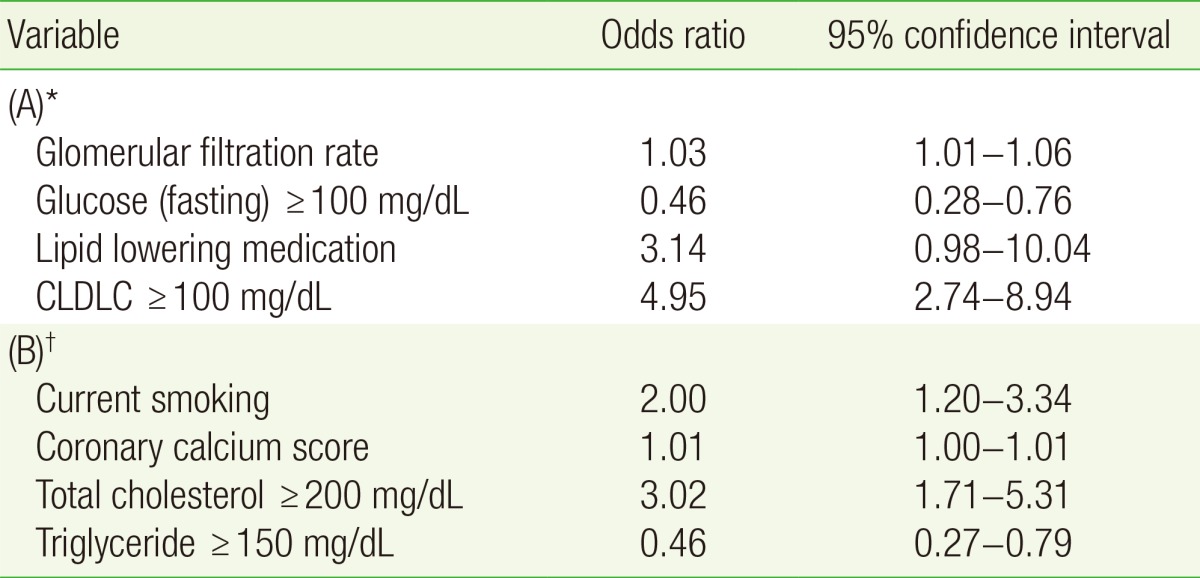
Among other factors, TC and HDLC were negatively correlated with the difference in LDLC measurements, while glucose was slightly positively correlated (simple linear regression) (Figure 3). The multiple logistic regression analysis showed that high glucose, glomerular filtration rate, and high CLDLC were significantly associated with high LDL differences (Table 3). Lipid lowering medications were also associated with high differences in LDL measurements, but the statistical significance was slightly low (P=0.054). Additionally, current smoking, coronary calcium score, high TC, and high TG were significantly associated with very high LDL differences, but the goodness of fit for the logistic regression was slightly low (P=0.047, estimated by the Hosmer-Lemeshow test). The HiSens DLDLC concentrations were strongly correlated the with Beckman Coulter DLDLC measurements (simple linear regression, r≥0.975) (Figure 4).

DISCUSSION

We evaluated the differences in LDLC concentrations measured by the HiSens reagent and those calculated using the Friedewald equation. According to previous studies, calculations of LDLC based on the Friedewald equation (CLDLC) correlated well with quantification of LDLC (DLDLC), but generally, CLDLC was underestimated in comparison to DLDLC.1,4,6,14,15,16,17) Our results suggest that CLDLC generally correlated with DLDLC, but CLDLC was significantly higher than DLDLC, with a mean difference of -11.0±15.3 mg/dL. The DLDLC measured using the HiSens reagent was consistent with measurements made using BCDR (the mean difference was about 2.9 mg/dL, P<0.001), ensuring quality control. The highest discrepancies (62.5%) in LDLC occurred when the LDLC was higher than 160 mg/dL, but less than 190 mg/dL. These results suggest the possibility of improper management of patients with hyperlipidemia, including the general population without CHD risk, according to the ATP III or IV guidelines.
Large differences in LDLC measurements (≥10 mg/dL) were observed in more than half of the participants with serum TG levels less than 200 mg/dL, which is inconsistent with other studies.14,18) Serum TG levels of more than 400 mg/dL were associated with very large differences in LDLC measurements (≥20 mg/dL). Here we found that HDLC, obesity, diabetes, and gender, among the values reported by Choi et al.14) were not significantly associated with large differences in LDLC measurements. Diabetes and lipid lowering medications seemed to influence these results, but these were factors for a minority of patients.
Although the HiSens reagent for DLDLC measurements showed good correlation with other domestic reagent in a study,19) results were inconsistent with other studies, particularly in that the CLDLC was higher than DLDLC and the large differences in LDLC measurements were not generally dependent on TG concentrations, although high TG produced a positive bias. These discrepancies can be attributed to inaccuracies in either CLDLC or DLDLC estimations. It is known that the DLDLC procedure is more precise and accurate than the CLDLC, calculated using three analytical variables (TC, TG, and HDLC).11,20) However, some DLDLC measurements have been limited because of cholesterol rich very low density lipoprotein (VLDL) and intermediate density lipoprotein (IDL) for patients with diabetes or type III hyperlipidemia.21,22) The ultracentrifugation as a reference method measures LDL including IDL, and lipoprotein(a), which are all atherogenic particles. However, direct methods for measuring such particles are influenced by the VLDLC/TG ratio, the size of the LDL particle, and the wrong assignment of the calibrator value, etc. When the VLDL is rich in TG, direct methods tend to underestimate LDL-C22) and have been reported to be less reactive with lipoproteins, which contains small, dense LDL and/or lipoprotein(a).23)
High TG levels can cause low CLDLC if the TG ratio is not adjusted in the Friedewald equation.21,22,24) Both LDLC measurements can be negatively biased by high TG and the absolute difference between them can be reduced. Although the two DLDLC measurements were consistent with each other, neither of the two reagents used for our DLDLC measurements were verified by CRMLN, warranting further studies.
There were several limitations to the methodologies presented here. We did not compare the results with the reference method (beta quantification) or verified direct methods by CRMLN, for measuring LDLC. This study was cross-sectional and included healthy participants from one center. However, we found that there were differences between DLDLC and CLDLC, which could have a significant impact on clinical decisions.
In conclusion, DLDLC measurements were significantly lower than CLDLC measurements, and the differences between LDLC measurements were prone to negative and positive biases that were dependent on CLDLC and TG concentrations, respectively. In contrast to other studies, large differences in LDLC measurements were not dependent on TG concentrations. Our work suggests that verification of DLDLC accuracy is needed and differences in LDLC measurements should be accounted for in making clinical decisions.

Notes

CONFLICT OF INTEREST: No potential conflict of interest relevant to this article was reported.

References

1. Hur M, Kim CS, Park MJ, Kwak I, Lee KM. Analysis of low-density lipoprotein cholesterol by homogenous assay in comparison with Friedewald formula. Korean J Lab Med 2003;23:104-108.

2. Expert Panel on Detection, Evaluation, and Treatment of High Blood Cholesterol in Adults. Executive Summary of The Third Report of The National Cholesterol Education Program (NCEP) Expert Panel on Detection, Evaluation, And Treatment of High Blood Cholesterol In Adults (Adult Treatment Panel III). JAMA 2001;285:2486-2497. PMID: 11368702.
crossref pmid
3. Stone NJ, Robinson JG, Lichtenstein AH, Goff DC Jr, Lloyd-Jones DM, Smith SC Jr, et al. Treatment of blood cholesterol to reduce atherosclerotic cardiovascular disease risk in adults: synopsis of the 2013 American College of Cardiology/American Heart Association cholesterol guideline. Ann Intern Med 2014;160:339-343. PMID: 24474185.
crossref pmid
4. Otokozawa S, Ai M, Asztalos BF, White CC, Demissie-Banjaw S, Cupples LA, et al. Direct assessment of plasma low density lipoprotein and high density lipoprotein cholesterol levels and coronary heart disease: results from the Framingham Offspring Study. Atherosclerosis 2010;213:251-255. PMID: 20863498.
crossref pmid pmc
5. Brunzell JD, Davidson M, Furberg CD, Goldberg RB, Howard BV, Stein JH, et al. Lipoprotein management in patients with cardiometabolic risk: consensus conference report from the American Diabetes Association and the American College of Cardiology Foundation. J Am Coll Cardiol 2008;51:1512-1524. PMID: 18402913.
crossref pmid
6. Martin SS, Blaha MJ, Elshazly MB, Brinton EA, Toth PP, McEvoy JW, et al. Friedewald-estimated versus directly measured low-density lipoprotein cholesterol and treatment implications. J Am Coll Cardiol 2013;62:732-739. PMID: 23524048.
crossref pmid
7. Smets EM, Pequeriaux NC, Blaton V, Goldschmidt HM. Analytical performance of a direct assay for LDL-cholesterol. Clin Chem Lab Med 2001;39:270-280. PMID: 11350026.
crossref pmid
8. Kazi-Aoul T, Benmiloud M. The Friedewald formula: another restriction? Clin Chem 1987;33:1301PMID: 3594899.
crossref pmid
9. Matas C, Cabre M, La Ville A, Prats E, Joven J, Turner PR, et al. Limitations of the Friedewald formula for estimating low-density lipoprotein cholesterol in alcoholics with liver disease. Clin Chem 1994;40:404-406. PMID: 8131276.
crossref pmid
10. Nauck M, Warnick GR, Rifai N. Methods for measurement of LDL-cholesterol: a critical assessment of direct measurement by homogeneous assays versus calculation. Clin Chem 2002;48:236-254. PMID: 11805004.
crossref pmid
11. Min WK, Park HI, Jun KR, Chun S, Lee W. Factors affecting the difference between the low-density lipoprotein cholesterol concentrations measured directly and calculated using the Friedewald formula. J Lab Med Qual Assur 2008;30:233-235.

12. Centers for Disease Control and Prevention. Cholesterol Reference Method Laboratory Network (CRMLN) [Internet]. Atlanta (GA): Centers for Disease Control and Prevention; [cited 2015 Jan 20]. Available from: http://www.cdc.gov/labstandards/crmln_clinical.html

13. Friedewald WT, Levy RI, Fredrickson DS. Estimation of the concentration of low-density lipoprotein cholesterol in plasma, without use of the preparative ultracentrifuge. Clin Chem 1972;18:499-502. PMID: 4337382.
crossref pmid
14. Choi SY, Park HE, Kim MK, Shin CS, Cho SH, Oh BH. Difference between calculated and direct-measured low-density lipoprotein cholesterol in subjects with diabetes mellitus or taking lipid-lowering medications. J Clin Lipidol 2012;6:114-120. PMID: 22385544.
crossref pmid
15. Sibal L, Neely RD, Jones A, Home PD. Friedewald equation underestimates low-density lipoprotein cholesterol at low concentrations in young people with and without Type 1 diabetes. Diabet Med 2010;27:37-45. PMID: 20121887.
crossref pmid
16. Scharnagl H, Nauck M, Wieland H, Marz W. The Friedewald formula underestimates LDL cholesterol at low concentrations. Clin Chem Lab Med 2001;39:426-431. PMID: 11434393.
crossref pmid
17. Jun KR, Park HI, Chun S, Park H, Min WK. Effects of total cholesterol and triglyceride on the percentage difference between the low-density lipoprotein cholesterol concentration measured directly and calculated using the Friedewald formula. Clin Chem Lab Med 2008;46:371-375. PMID: 18254713.
pmid
18. McNamara JR, Cohn JS, Wilson PW, Schaefer EJ. Calculated values for low-density lipoprotein cholesterol in the assessment of lipid abnormalities and coronary disease risk. Clin Chem 1990;36:36-42. PMID: 2297935.
crossref pmid
19. Woo HY, Kim YJ, Park H. Evaluation of HiSense(TM) reagents for chemistry autoanalyzer. J Lab Med Qual Assur 2006;28:189-198.

20. Can M, Acikgoz S, Mungan G, Ugurbas E, Ankarali H, Sumbuloglu V, et al. Is direct method of low density lipoprotein cholesterol measurement appropriate for targeting lipid lowering therapy? Int J Cardiol 2010;142:105-107. PMID: 19135270.
crossref pmid
21. Wagner AM, Zapico E, Bonet R, Perez A, Ordonez-Llanos J. The effect of VLDL particles on the accuracy of a direct LDL-cholesterol method in type 2 diabetic patients. Clin Biochem 2003;36:177-183. PMID: 12726925.
crossref pmid
22. Esteban-Salan M, Guimon-Bardesi A, de La Viuda-Unzueta JM, Azcarate-Ania MN, Pascual-Usandizaga P, Amoroto-Del-Rio E. Analytical and clinical evaluation of two homogeneous assays for LDL-cholesterol in hyperlipidemic patients. Clin Chem 2000;46(8 Pt 1):1121-1131. PMID: 10926892.
crossref pmid
23. Usui S, Kakuuchi H, Okamoto M, Mizukami Y, Okazaki M. Differential reactivity of two homogeneous LDL-cholesterol methods to LDL and VLDL subfractions, as demonstrated by ultracentrifugation and HPLC. Clin Chem 2002;48:1946-1954. PMID: 12406980.
crossref pmid
24. Suh B, Kim D. The comparison analysis between measured and estimated LDL-cholesterol. Korean J Health Promot Dis Prev 2007;7:7-23.

Figure 1

Correlation of DLDLC and CLDLC. Y=1.168X-8.621, Pearson's correlation coefficient r=0.917, r2=0.840, P<0.001 for simple linear regression (solid line). DLDLC, direct low density lipoprotein cholesterol; CLDLC, calculated low density lipoprotein cholesterol.

kjfm-36-168-g001.jpg
Figure 2

Distribution (%) of the absolute differences in LDLC measurements according to (A) DLDLC and (B) TG concentration sections. DLDLC, direct low density lipoprotein cholesterol; CLDLC, calculated low density lipoprotein cholesterol; TG, triglyceride.

kjfm-36-168-g002.jpg
Figure 3

Correlations among clinical variables and LDLC differences using simple linear regression (solid line). (A) Y=-0.168X+8.621, r=0.313, r2=0.098. (B) Y=-0.280X +24.800, r=0.667, r2=0.444. (C) Y=0.090X-24.215, r=0.557, r2=0.310. (D) Y=-0.152X+21.165, r=0.392, r2=0.153. (E) Y=-0.170X-1.610, r=0.138, r2=0.019. (F) Y=0.087X-19.329, r=0.128, r2=0.016. All P-values < 0.05. DLDLC, direct low density lipoprotein cholesterol; CLDLC, calculated low density lipoprotein cholesterol.

kjfm-36-168-g003.jpg
Figure 4

Correlation of DLDLC values measured using the HiSens reagent and DLDLC values measured using the Beckman Coulter 5821 analyzer and dedicated reagent. Y=0.962X+1.175, r=0.996, r2=0.992, P<0.001 for simple linear regression (solid line). Dotted line: 95% confidence interval. DLDLC, direct low density lipoprotein cholesterol.

kjfm-36-168-g004.jpg
Table 1

Baseline characteristics

kjfm-36-168-i001.jpg

Values are presented as mean±SD (range) unless otherwise indicated.

BP, blood pressure; CLDLC, calculated low density lipoprotein cholesterol; DLDLC, direct low density lipoprotein cholesterol; baPWV, brachial-ankle aortic pulse wave velocity.

*Arterial stiffness is graded according to the baPWV: 1 (soft, baPWV<900 cm/s), 2 (hardish, baPWV<1,600 cm/s), 3 (hard, baPWV<2,500 cm/s). The value is presented as the median (range). Evaluated by brain and carotid magnetic resonance and angiography. §The calcium score and coronary artery stenosis were evaluated by electron-beam computed tomography and coronary computed tomography angiogram, respectively.

Table 2

The categorical concordance of LDLC measurements according to the National Cholesterol Education Program's Adult Treatment Panel III guidelines

kjfm-36-168-i002.jpg

Values are presented as number (%).

LDLC, low density lipoprotein cholesterol.

Table 3

Variables significantly associated with large differences between DLDLC and CLDLC using multiple logistic regression analysis (n = 328)

kjfm-36-168-i003.jpg

DLDLC, direct low density lipoprotein cholesterol; CLDLC, calculated low density lipoprotein cholesterol.

*10 mg/dL ≤│DLDLC-CLDLC│<20 mg/dL. P>0.05 as estimated by the Hosmer-Lemeshow test. │DLDLC-CLDLC│≥20 mg/dL. P=0.047 as estimated by the Hosmer-Lemeshow test.

TOOLS
Share :
Facebook Twitter Linked In Google+ Line it
METRICS Graph View
  • 4 Web of Science
  • 4 Crossref
  • 4 Scopus
  • 3,327 View
  • 20 Download


ABOUT
ARTICLE CATEGORY

Browse all articles >

BROWSE ARTICLES
INFORMATION FOR AUTHORS AND REVIEWERS
Editorial Office
Room 2003, Gwanghwamun Officia, 92 Saemunan-ro, Jongno-gu, Seoul 03186, Korea
Tel: +82-2-3210-1537    Tax: +82-2-3210-1538    E-mail: kjfm@kafm.or.kr                

Copyright © 2024 by Korean Academy of Family Medicine.

Developed in M2PI

Close layer
prev next