The Association between Sleep Duration and Hypertension in Non-obese Premenopausal Women in Korea
Article information
Abstract
Background
Previous studies have revealed that sleep duration is linked to both obesity and hypertension. Here, we evaluated the association between sleep duration and hypertension in obese and non-obese premenopausal women using representative national survey data from the Korean population.
Methods
A total of 4,748 subjects over 20 years of age from the Korean National Health and Nutrition Examination Survey from 2010 to 2012 were included. To control for risk factors, multivariable logistic regression was used to calculate the adjusted odds ratios and 95% confidence intervals of hypertension across the following sleep duration categories: <6, 6-8, and >8 h/d.
Results
Among the participants, 367 subjects (7.7%) had hypertension. Their mean sleep duration was 7 hours. In the non-obese subjects, after controlling for potential confounding variables, the odds ratio for hypertension was 1.86 fold greater in those with a sleep duration of <6 hours (odds ratio, 1.79; 95% confidence interval, 1.05 to 3.03) as compared to those who slept for 6.8 hours. However, there was no association between sleep duration and the risk of hypertension in obese subjects. Long sleep duration (over 8 h/d) was not associated with hypertension in either the non-obese or the obese subjects in this study.
Conclusion
Short sleep duration (less than 6 h/d) may be a significant risk factor for hypertension in non-obese premenopausal women. However, there is no association between sleep duration and the risk of hypertension in obese women.
INTRODUCTION
High blood pressure is a risk factor for ischemic heart disease syndromes and cerebrovascular disease, the main causes of more than 7 million deaths in the world each year.1) The worldwide prevalence of high blood pressure exceeded 25% in 2000, and is predicted to increase to 29% by 2015.2) Many studies on risk factors have been conducted in order to try to prevent high blood pressure, and age and family history and also adjustable factors such as socio-economic level, smoking, eating habits, and stress are related to high blood pressure.34)
Improvement of eating habits has been considered for prevention and control of high blood pressure, and lately, many studies on the connection between sleeping hours and high blood pressure have been conducted. Several foreign studies reported that short sleeping hours can be a risk factor for high blood pressure,56) and they showed inconsistent results for a connection between long sleeping hours and high blood pressure.789) In South Korea, there are studies showing that people sleeping less than 5 hours have a high prevalence of obesity, high blood pressure, and diabetes in comparison with people sleeping 7 hours.101112) Young women show the strongest connection between short sleeping hours and high blood pressure. However, most of these studies were performed abroad, and little research on this topic has been conducted in Korea. Sleeping hours can change due to country and cultural differences and also due to population characteristics such as ethnicity, age, and sex, so it is difficult to generalize the results of foreign studies for all people in South Korea.1314)
Therefore, this research desires to verify a connection between sleep and high blood pressure targeting adult premenopausal women in South Korea, and to compare and analyze the risk of high blood pressure by sleeping hours according to the body mass index (BMI) of the subjects.
METHODS
1. Subjects
This research is based on the 5th National Nutrition Survey conducted in 2010, 2011, and 2012. The National Nutrition Survey is a cross-sectional survey that the Ministry of Health and Welfare and Korea Centers for Disease Control and Prevention conducted to evaluate people's health and to use the data as an index for health policy and program evaluation, so representative subjects were selected by stratified multistage sampling.15)
The subjects in this analysis included 4,788 women. Excluded were 11,616 men, 2 780 women under age 20, and 6,350 postmenopausal women from the original 25,534 subjects. Excluded postmenopausal women included those reporting both natural and artificial menopause. In addition, women of 8 menstruations were included. The final analysis included 4,748 people after excluding an additional 40 people whose data on sleeping hours, obesity, and high blood pressure were incomplete.
2. Anthropometric Measurements
The study used data on height, weight, and blood pressure measured in a health examination,15) and data on health behavior including sleeping hours and demographic and socio-economic characteristics of subjects in a health survey distributed as part of the National Nutrition Survey.
1) Height, weight, and girth
Height and weight were measured in subjects wearing a gown based on the anthropometric rule, and reliable measured values were obtained with internationally authorized anthropometric equipment. Girth was measured in the slimmest part between the subcostal interface and iliac crest in an erect posture.
2) Blood pressure
The average of systolic and diastolic blood pressure measured twice at 5-minute intervals after a 5-minute rest in a sitting posture was used.
3) Sleeping hours
This research used the response time written as 00 to 24 hours in response to the question "How long do you usually sleep at night?"
4) Confounding variables
Total educational years were divided into less than 6 years, 7–12 years, and more than 13 years. Those reporting more than 13 years were classified as 'women with more than a high school diploma.' Monthly mean family income adjusted by the number of family members was divided into under one million won, one million to two million won, two million to three million won, and more than three million won, and a case under one million won was classified as 'low income level.' Marital conditions were divided into single, living with a spouse, and married but not living with a spouse due to divorce, separation, or death.
Smoking was divided into 'not smoking' and 'smoking at present.' Smokers include those answering "smoking every day" or "smoking sometimes" to the question "Are you smoking now?" 'Monthly drinking' included women who answered that they drank more than a glass of liquor over the last month, and 'high risk drinking' included women who drank more than 30 g of alcohol per day. For physical activity, 'hard physical activity' was more than 20 minutes of hard physical activity (running, climbing) more than three times a week, and 'moderate physical activity' was more than 30 minutes of moderate physical activity (swimming, tennis) more than five times a week. 'Walking activity' was more than 30 minutes of walking more than five times a week. Women with more than moderate physical activity were classified as 'women with proper exercise.'15)
3. Clinical Definitions
1) Obesity
BMI was calculated using the measured height and weight (kg/m2), and according to the standard of The Korean Society for the Study of Obesity, >25 BMI was classified as obese.
2) Hypertension
Hypertension was defined as a case of more than 140 mm Hg systolic blood pressure, more than 90 mm Hg diastolic blood pressure, or taking antihypertensives.15)
4. Statistical Analysis
The complex sampling statistical analysis using Primary Sample Unit and kstrata by applying weighted values by individual is the same as the method used in the National Nutrition Survey. The statistical analysis used the SAS ver. 9.3 (SAS Institute Inc., Cary, NC, USA) survey procedure, and a P-value under 0.05 was defined as statistically significant.
General characteristics of the subjects are shown by number and percentage for categorical variables, and by average value (±standard deviation) for continuous variables. To compare differences between subjects according to sleeping hours, t-tests, analysis of variance, or a chi-square test was used.
Subjects were classified into two groups according to obesity, and multiple logistic regression analysis was conducted to compare and evaluate the risk of high blood pressure according to sleeping hours. In addition, age, factors of health behavior, disease history, and socialdemographic characteristics of the subjects were accounted for as potential confounding factors.
RESULTS
1. Profiles of Subjects
The mean age of the subjects was 35.5, and the prevalence of high blood pressure was 7.7%. In addition, mean sleeping time was 7 hours, and 82.8% were taking 6–8 hours of proper sleep.
When the general characteristics of the subjects were classified by sleeping hours, the shorter the sleeping hours, the higher was the age, BMI, systolic and diastolic blood pressure, and the prevalence of high blood pressure (P for the trend <0.05). In addition, there were no meaningful differences across the three sleeping time groups for girth, physical activity, or diabetes (Table 1).

Baseline characteristics across categories of sleep duration
2. Relationship between Sleep Duration and Hypertension
The prevalence of high blood pressure according to sleeping hours was 12.7%, 7.1%, and 4.1% for those sleeping <6 hours, 6–8 hours, and >8 hours, respectively. The shorter the sleeping hours, the higher the prevalence of high blood pressure was. In the obese group, the prevalence of high blood pressure decreased as sleeping hours increased, but this tread was not statistically significant (Table 2).
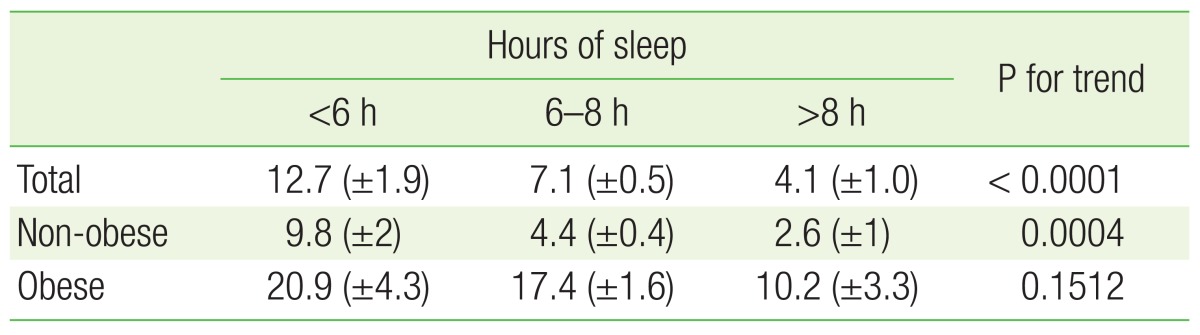
Association between sleep duration and prevalence of hypertension
As a result of calculating the odds ratio (OR) of high blood pressure according to sleeping hours on the basis of the 6–8 hours group, in the non-obese group, the OR of high blood pressure in the >6 hours group was 1.86 (95% confidence interval [CI], 1.09 to 3.17), as high as the OR of high blood pressure in the 6–8 hours group in model 1 with only age accounted for (Table 3). After accounting for factors of health behavior such as smoking, drinking, and physical activity (model 2), the shorter the sleeping hours, the more the risk of high blood pressure increased (OR, 1.79; 95% CI, 1.05 to 3.03). However, after the factors of hypercholesteremia, abdominal obesity, and social-demographic variables such as family income, educational level, and marriage are additionally accounted for (model 3), this statistically meaningful correlation between sleeping hours and hypertension is no longer maintained (OR, 1.53, 95% CI, 0.84 to 2.81). Meanwhile, there was no statistically meaningful connection between sleep duration and prevalence of high blood pressure in the obese group.
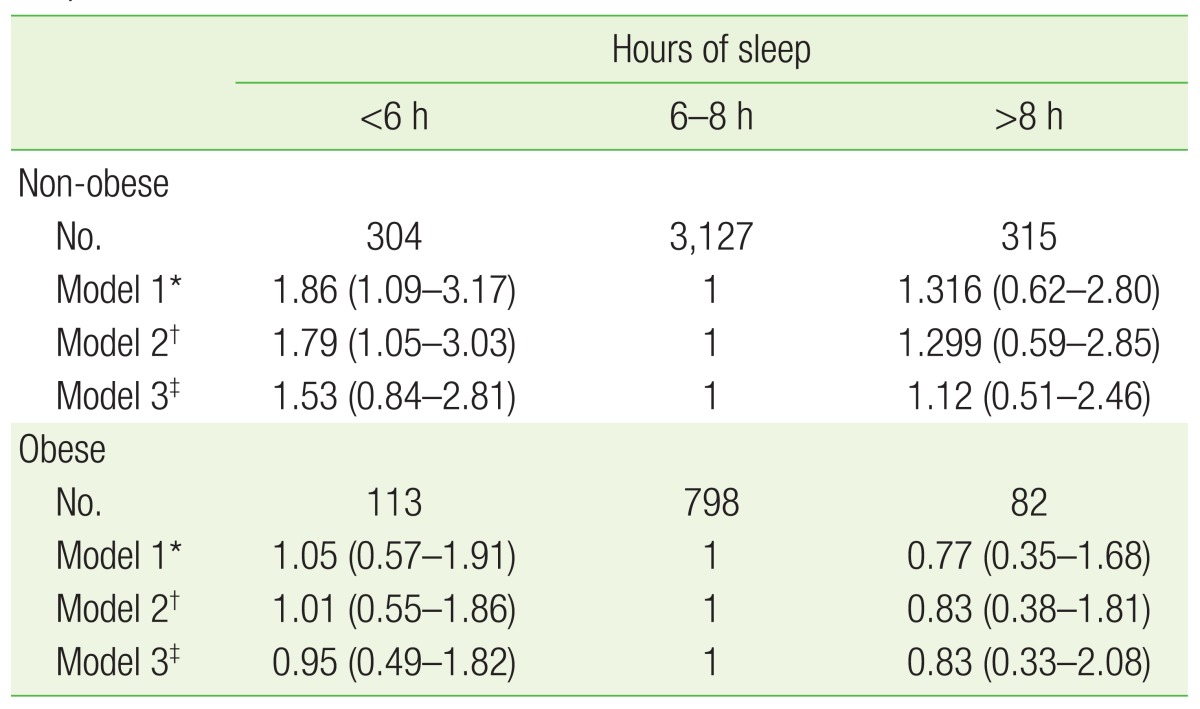
Odds ratio (95% confidence interval) of hypertension across categories of sleep duration
DISCUSSION
This study examined the prevalence of high blood pressure and general characteristics according to sleeping hours of premenopausal women who are over 20 years old based on National Nutrition Survey collected between 2010 and 2012, and compared and analyzed the relationship between sleeping hours and high blood pressure according to BMI. Across all of the subjects, shorter sleeping hours are associated with an increase in the prevalence of high blood pressure. However, in the non-obese group, the OR of high blood pressure in the group sleeping >6 hours was significantly higher than that in the 6–8 hours sleep group, but in the obese group, there was no statistically significant connection between sleeping hours and high blood pressure.
When considering these results, first, the sample size of obese subjects is smaller than the sample size of non-obese subjects, so statistical power may be too low. Second, sleep apnea syndromes commonly affect obese people. This is a risk factor for high blood pressure, and is related to sleeping hours,1617) so it can have an effect on any connection between sleeping hours and high blood pressure. However, our study did not consider variables related to sleep quality such as insomnia and sleep apnea. Third, this study is cross-sectional. Some obese people might attempt a correction of living habits such as moderation in drink, non-smoking, dietary treatment, and exercise for weight control, so any sleeping effect on blood pressure might decrease relatively. Fourth, the possibility that other unknown confounding factors are affecting the results cannot be excluded.
A mechanism explaining a connection between sleeping hours and high blood pressure is that an elevation in blood pressure in people with both normal and high blood pressure occurs due to excessive invigoration of the sympathetic nerves after short-term sleep deprivation.181920) In addition, if short sleeping hours are continued for a long time, structural adaptations such as hypertrophy of arteries and the left ventricle occur due to the increase of hemodynamic load, so the cardiovascular system is adjusted to maintain a higher blood pressure balance.21)
In previously conducted studies, the shorter sleeping hours are, the greater the risk of high blood pressure. This connection between sleeping hours and high blood pressure shows an age and sex-specific tendency. Several studies have shown this trend in adults under 60, but not in people over 60.78222324) This may be due to older retired individuals having more opportunities to catch up on sleep by napping. In addition, the probability of subjects with associated diseases such as high blood pressure and diabetes surviving to old age is relatively low.811)
In addition, in several studies, the connection between sleeping hours and high blood pressure was particularly marked for women. The mechanism for this is unknown, but the reason may be found in a role of hormones and psycho-social changes related to menopause.2526) There is no connection between sleep and high blood pressure in women over 60.1112) After menopause, the drop in estrogen can cause vasodilatation and the blood pressure of women after menopause can rise by 4–5 mm Hg.27) Therefore, this study targeted women before menopause in order to eliminate any effect of estrogen on blood pressure.
According to the results of this study, adult premenopausal woman with 6–8 hours of proper sleep showed the lowest prevalence of high blood pressure, which is consistent with previous research in other countries. However, when subjects were classified by BMI, there was no statistically significant correlation between sleep duration and hypertension in the obese group.
The study measured sleeping hours by self-report, so objective accuracy may be low, but a different study did report that the results of self-reports are in line with the results of measuring sleep duration with actinography.2829) In addition, because this is a cross-sectional study, the temporal order between sleeping hours and high blood pressure is unknown, so an accurate causal relationship cannot be proven. However, the relationship between sleeping hours and high blood pressure in premenopausal women was compared and analyzed by BMI, so it is meaningful to attempt a more segmentalized selection of subjects and analytical methods.
In conclusion, this research confirmed that the shorter sleeping hours are, the greater the prevalence of high blood pressure in adult premenopausal South Korean women. When the subjects were classified according to BMI, the non-obese group showed a meaningful connection after accounting for several confounding variables, but the obese group did not show a meaningful connection. In the future, large-scale prospective studies are needed to verify an accurate causal relationship between sleeping hours and high blood pressure.
Notes
CONFLICT OF INTEREST: No potential conflict of interest relevant to this article was reported.