Association between Socioeconomic Status and Cancer Screening in Koreans over 40 Years in Age Based on the 2010–2012 Korean National Health and Nutrition Examination Survey
Article information
Abstract
Background
We investigated the association between socioeconomic status (SES) and cancer screening in a Korean population aged 40 years or older.
Methods
This cross-sectional study included 12,303 participants (5,284 men and 7,019 women) who participated in the 2010–2012 Korean National Health and Nutrition Examination Survey. Self-reported questionnaires were used to assess participant's SES (household income, occupational, and educational status) and cancer screening behavior.
Results
Compared to the lowest household income group, the odds ratios (ORs) (95% confidence intervals [CIs]) for overall cancer screening of the highest income group were 2.113 (1.606–2.781) in men and 1.476 (1.157–1.883) in women; those for private cancer screening of the highest income group were 2.446 (1.800–3.324) in men and 2.630 (2.050–3.373) in women, while those for National Cancer Screening Programs (NCSP) in the highest income group were 1.076 (0.805–1.439) in men and 0.492 (0.388–0.623) in women. Compared to manual workers, ORs (95% CIs) for private cancer screening of office workers were 1.300 (1.018–1.660) in men and 0.822 (0.616–1.098) in women. In comparison to the least educated men, OR (95% CI) for private cancer screening of the most educated men was statistically significant (1.530 [1.117–2.095]).
Conclusion
Higher economic status was associated with higher rates of overall and private cancer screening in both sexes and a lower rate of NCSP in women. Male office workers and more educated individuals underwent private cancer screening at a higher rate than manual workers and less educated individuals, respectively.
INTRODUCTION
In South Korea, malignant neoplasm is a leading cause of death and its incidence has steadily increased over a number of years. According to the annual report on the causes of death from Statistics Korea, an overwhelming majority of the Korean patients who died from malignant neoplasm in 2013 were over 40 years of age.1) The age-standardized cancer incidence rates per 100,000 were 343.6 in men and 316.7 in women, which are similar to or higher than those of other developed countries (USA, 347.0 in men and 297.4 in women; UK, 284.0 in men and 267.3 in women; Japan, 260.4 in men and 185.7 in women) and are steadily growing.12) Although the best choice to reduce cancer mortality is prevention, the second best option appears to be detection of cancer at an early stage. South Korea has National Cancer Screening Programs (NCSP) that have been operating since 1999 and have provided a targeted population with free screening for five common cancers in Korea, including stomach, liver, colorectum, breast, and uterine cervix, every two years.
Socioeconomic status (SES) is associated with various types of cancer incidence and morbidities/mortalities, including cancer-related problems.3) In addition, it appears that SES affects health behaviors such as alcohol consumption, physical activity, cigarette-smoking, and dietary patterns, which are closely related to cancer development and outcomes.345) Socioeconomic deprivation results in reduced access to healthcare, which is a barrier to early detection of cancer and, thus, to better outcomes.6) Individuals with a low SES seem to be more susceptible to exposure to unhealthy foods, such as high-calorie but poor-nutrition foods. Unhealthy environments play an important role in the development and progression of serious diseases such as malignant neoplasm, resulting in poor prognosis.
Identifying an association between SES and participation in cancer screening can be helpful for developing a health policy and distributing limited public health resources fairly and efficiently. The aim of this study was to investigate the association of SES (household income, occupational, and educational status) with cancer screening in a Korean population over 40 years in age, after accounting for age and other confounding factors. In addition, we examined the relation of each SES to participation in private cancer screening and NCSP.
METHODS
1. Study Population
The Korean Ministry of Health and Welfare periodically conducts the Korean National Health and Nutrition Examination Survey (KNHANES), which is a nationwide survey representing the entire Korean population. This survey includes comprehensive information on health status, health behavior, socioeconomic demographics, and laboratory test results. Households were selected as the sampling units based on a stratified, multistage, probability-sampling design according to age, sex, and geographic area. Participants were asked to complete four types of questionnaires which are composed of a health interview, health behavior, health examination, and nutrition. Trained interviewers performed face-to-face health interviews at participants' houses. Citizens could refuse to participate in this survey according to the National Health Enhancement Act. Written informed consent was provided by participants. For further research, the Korea Centers for Disease Control and Prevention acquired participants' consent to use blood samples obtained during the health interview survey. Trained staff followed standardized steps to conduct the unified procedures. Body weight and height were measured to the nearest 0.1 kg and 0.1 cm, respectively, while participants wore light indoor clothes without shoes. Body mass index (BMI) was calculated as the ratio of weight in kilograms to squared height in meters (kg/m2).
This study was based on data from 19,599 adults from the 2010–2012 KNHANES. We excluded participants younger than 40 years, those who did not have data regarding socioeconomic variables such as household income, occupation, education, and marital status, and those who did not have information regarding cancer screening. After these exclusions, 12,303 participants (5,284 men and 7,019 women) were included in the final analysis. The Institutional Review Board of the Korea Centers for Disease Control and Prevention approved this study.
2. Definition of Socioeconomic Variables, Health Check-up, and Cancer Screening
Information on SES and health-related behaviors was obtained from the self-reported questionnaire answers during the interview for the relevant survey period. Participants answered an open-ended questionnaire, "What is your average monthly household income including salaries, property income, pension, government subsidies, and allowance?" The ministry of health and welfare classified individuals into four groups (lowest, middle-lowest, middle-highest, and highest) according to monthly household income. Occupational status was categorized into three groups: manual workers (clerk, service and sales workers, skilled agricultural, forestry, and fishery workers, persons who operate or assemble craft, equipment, or machines, and elementary workers), office workers (general managers, government administrators, professionals, and simple office worker), and others (unemployed persons, housekeepers, and students). Educational status was classified according to duration into less than 6 years, 6–<9 years, 9–<12 years, and ≥12 years.
Participants answered the following question about cancer screening, "Have you undergone cancer screening within the last two years?" The participants who answered "yes" were further questioned about the type of cancer screening. Cancer screening was re-categorized into private cancer screening or NCSP. Private cancer screening included cancer screening paid for by examinees at healthcare units including private general hospitals, health check-up centers, and public healthcare center under the Korean National Health Insurance Corporation. NCSP was defined as cancer screening that was performed without payment by the examinee and the entire cost was covered by National Health Insurance.
Individuals who engaged in vigorous-intensity physical activity at least three days per week or moderate-intensity physical activity including walking at least five days per week were defined as the regular exercise group. The Alcohol Use Disorders Identification Test (AUDIT) was used to assess alcohol-drinking status. Individuals who smoked cigarettes during the relevant survey period were categorized as current smokers. Daily calorie intake was monitored via 24-hour food recall and analyzed using CAN-Pro ver. 3.0 software (Korean Nutrition Society, Seoul, Korea). Marital status was classified into three groups: married and not separated, those who had married and lived with their spouse; single, those who were not married, those who were married but separated, widows/widowers, and divorcees; and non-responders, those who did not respond.
3. Statistical Analysis
To represent the general Korean population with minimal bias, sampling weights were applied to account for complex sampling. All data from continuous variables such as age, BMI, daily calorie intake, household income, and AUDIT are presented as the mean and standard errors (SEs), which were calculated using a complex samples plan for descriptive analysis. Data from categorical variables such as smoking status, physical activity, SES (income, occupational, and educational status), marital status, and cancer screening are presented as the percentage and SEs. Chi-square tests were used to compare percentages for cancer screening within two years according to SES. The odds ratios (ORs) and 95% confidence intervals (95% CIs) for cancer screening participation within two years were calculated using weighted multivariate logistic regression analyses after adjustment for age, each SES, and other covariates. SAS statistical software ver. 9.4 (SAS Institute Inc., Cary, NC, USA) was used to conduct statistical analyses. All statistical tests were two-tailed and P-value <0.05 was considered to be statistically significant.
RESULTS
The characteristics of the study participants are summarized in Table 1. The mean age was 54.8 years for men and 56.6 years for women. The participation rate for overall, private cancer screening, and NCSP within 2 years was 56.6%, 30.5%, and 27.0%, respectively, in men and 66.0%, 39.3%, and 30.3%, respectively, in women.
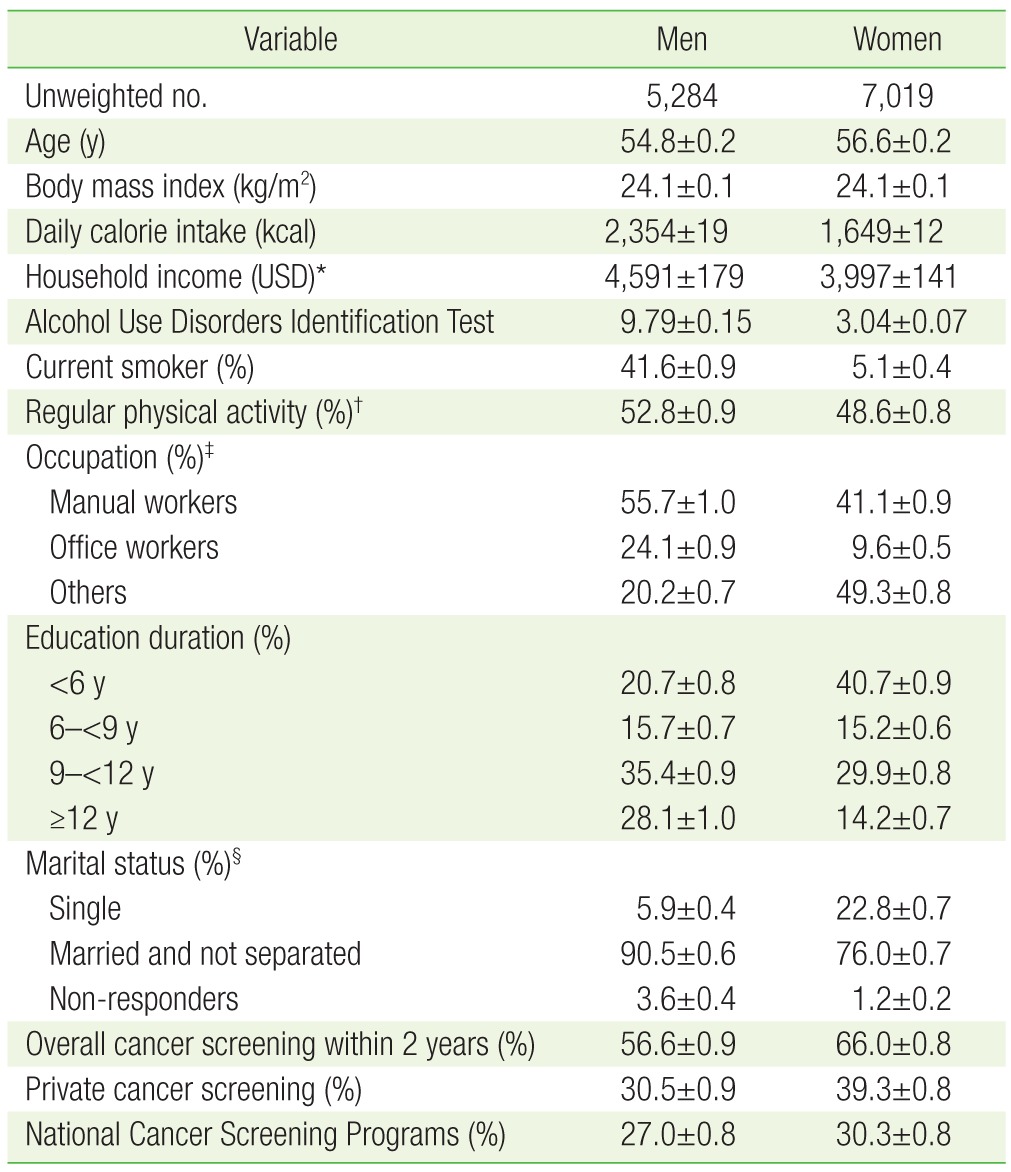
Subject characteristics
Figures 1,2,3 show the percentage of participants who underwent cancer screening within two years, according to SES. The highest income groups showed the highest percentage of overall cancer screening in both sexes (63.8% in men and 74.0% in women). Also, the high income groups underwent the highest percentage of private cancer screening in both sexes (39.2% in men and 52.7% in women) and the lowest rate of NCSP (24.3% in men and 23.8% in women) (Figure 1). Office workers underwent overall and private cancer screening at the highest frequency for men and women (61.4% and 73.3% of overall cancer screening, 37.2% and 45.2% of private cancer screening) (Figure 2). Also, the most educated group had the highest participation rate for overall and private cancer screening (60.4% in men and 71.8% in women for overall cancer screening, 36.9% in men and 48.0% in women for private cancer screening) (Figure 3).

Percentage of cancer screening within two years according to monthly household income. The P-values among monthly household income categories (lowest, middle-lowest, middle-highest, and highest group) were determined using chi-square test after weighting.
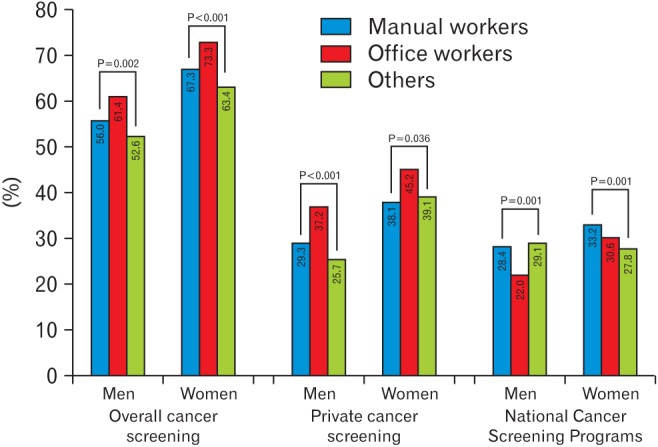
Percentage of cancer screening within two years according to occupational status. The P-values among occupational categories (manual workers, office workers, and others) were determined using chi-square test after weighting.
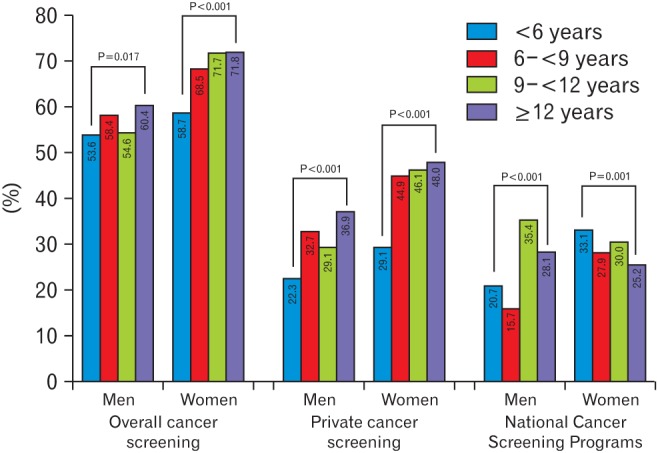
Percentage of cancer screening within two years according to educational status. The P-values for educational categories (<6 years, 6–<9 years, 9–<12 years, and ≥12 years) were determined using chi-square test after weighting.
In Table 2, we show the results of multivariate logistic regression for overall cancer screening after adjusting for age, BMI, daily calorie intake, smoking status, AUDIT score, physical activity, and marital status in addition to each SES including household income, occupational, and educational status. Compared to the lowest household income group, ORs (95% CIs) for overall cancer screening of the highest household income group were 2.113 (1.606–2.781) in men and 1.476 (1.157–1.883) in women. Compared to manual workers, ORs (95% CIs) of office workers were not significant for either sex (1.248 [0.982–1.586] in men and 1.041 [0.750–1.447] in women); ORs (95% CIs) of more educated groups were also not statistically significant.

Odds ratios for overall cancer screening according to socioeconomic status
In order to further investigate the association between SES and cancer screening type, logistic regression analyses were performed after stratifying private cancer screening and NCSP in Table 3. Compared to the lowest income group, ORs for private cancer screening of the highest income group were statistically higher (2.446 [1.800–3.324] in men and 2.630 [2.050–3.373] in women), while those for NCSP of women in the higher household income group were lower (0.735 [0.592–0.911] in middle-lowest group, 0.619 [0.491–0.781] in middle-highest group, and 0.492 [0.388–0.623] in the highest group). Compared to manual workers, ORs (95% CIs) for private cancer screening of office workers were 1.300 (1.018–1.660) in men and 0.822 (0.616–1.098) in women, while those for NCSP were not significant. Like occupational status, ORs for private cancer screening were statistically significant in the most educated men (1.530 [1.117–2.095]), while ORs for NCSP did not vary between sexes.

Odds ratios for private cancer screening and NCSPs according to socioeconomic status
DISCUSSION
The major findings in this study are that both males and females with higher household income appear to be more likely to undergo cancer screening from a nationally representative sample, after controlling for age, BMI, smoking status, AUDIT score, physical activity, marital status, and occupational and education status. In particular, men and women with higher income had higher odds of partaking in private cancer screening, while women in the higher income group showed lower odds of undergoing NCSP. Male office workers and more educated men seem to receive private cancer screening more often.
Cancer is the leading cause of death in Korea. Cancer mortality can be reduced if we detect and treat pre-cancerous lesions and cancer at an early stage through awareness and a cancer screening system. Cancer screening programs aim to identify abnormalities suggestive of pre-cancerous lesions and to determine the type of cancer in order to promptly manage the disease. A screening program is an effective method for diagnosis and early intervention of frequent cancers for which cost-effective and acceptable screening tests and treatments are available to high-risk populations. Cancer is the most burdensome disease in Korea.78) In order to reduce the burden of cancer, NCSP provide free cancer screening of the stomach for all individuals aged over 40 years, the liver for individuals with hepatitis B or C virus or liver cirrhosis, the colorectum for individuals aged 50 years, the breast for women aged over 40 years, and the uterine cervix for women aged over 30 years. Screening methods are follows: stomach, gastric endoscopy or upper gastro-intestinal series, biennially; liver, ultrasound and serum alpha-fetoprotein, annually; colorectum, fecal occult blood test, annually; breast, mammography with palpation, biennially; and uterine cervix, pap smear test, biennially.910) In the private sector, individuals pay to undergo cancer screenings or health check-up. Many companies will pay the hospital fee for employees to undergo these welfare-type check-ups. As a result of these efforts in the public and private sectors, five-year relative cancer survival rates have steadily increased from 41.2% in 1993–1995 to 66.3% in 2007–2011 based on the period of diagnosis.1)
SES may influence an individual's health behavior and hospital use pattern in various ways. Factors known to contribute to socioeconomic inequality are closely related to different exposure to underlying risk factors such as smoking, access to screening programs, and diagnosis and treatment of cancers in a timely manner.11) In addition, individuals with lower SES have economic barriers, informational disparity, and weak support from their company to access health care.12) Hastert et al.3) reported that living in a lower SES area was related to a higher incidence of lung and colorectal cancer and total cancer mortality. Disparities in cancer screening for breast and uterine cervix in low SES also exist in Korea, based on the Korea National Cancer Screening Survey.13) Several Korean studies have revealed that socioeconomically deprived populations are associated with worse mortality outcomes for gastric cancer and female cancers such as breast, uterine, cervix, and ovary.4514) The percentage of potential cancer deaths that could be avoided by elimination of educational and racial disparities in the US is over 30%.11) Proper and timely distribution of limited health resources and better opportunities for free check-ups can improve health indicators.
A Korean qualitative study indicated that barriers to participation in cancer screening include lack of trust in NCSP and cancer screening units, knowledge regarding cancer screening necessity, and awareness of NCSP.6) In this study, odds for overall cancer screening were statistically significant for household income status, but not occupational and educational status. However, after stratifying cancer screening into private and NCSP, ORs for private cancer screening according to household income status tended to increase in both sexes and occupational and educational status in men showed statistical significance. Even the odds for NCSP with household income status in women showed a downward tendency. The above-mentioned barriers appear to contribute to the current study's findings. Limited healthcare resources should be efficiently and effectively distributed to the populations that absolutely require these medical services. Health authorities should do their best to develop policies to overcome these barriers, increase awareness of and trust in NSCP, control screening unit quality, and inform the population about cancer screening necessity. Providing information on cancer screening to the public, especially individuals with low SES, can increase early detection of cancer, improve treatment outcomes, promote national health, and reduce social cost. As a virtuous circle, reduced cost should promote national health and welfare.
This study has several limitations that should be considered when interpreting the findings. First, it was difficult to confirm whether socioeconomic deprivation was a risk factors related to low cancer screening because of the cross-sectional design of the study. Although several previous studies have demonstrated that low SES is associated with low cancer screening participation, advanced cancer detection by delayed screening can cause economic and occupational deprivation. However, in contrast to economic and occupational status, education is rarely affected by previous cancer diagnosis except in terms of childhood cancer. The causality between SES and cancer screening does not matter because authorities should be concerned about all vulnerable social groups. Second, we could not fully exclude the effect of information bias because the data used in this study were based on results from self-reported questionnaires. For the reason that self-reported surveys regarding anticipated answers sorted to socially undesirable groups tend to be underestimated, individuals that actually should have been classified as lower SES might have been classified as higher SES. Third, cancer type, screening units and methods could not be identified and differentiated. Some participants were confused about the type of cancer screening they underwent.
In spite of these potential limitations, this study has several strengths. To the best of our knowledge, this is the first study to report the associations between SES and overall cancer screening within two years. First, we applied sampling weights to all analyses to retain representativeness to the entire Korean population. Second, cancer screening was reclassified into private cancer screening and NCSP according to payment methods. Although previous studies have reported the relationship of SES to screening for individual cancer types such as stomach, breast and cervix cancer,13151617) they have not integrated any cancer screening nor stratified cancer screening into private cancer screening or NCSP. We included integrated cancer screening, not typebased cancer screening. Third, screening participation data were limited to the last two years in order to investigate whether SES is associated with recent cancer screening.
In conclusion, higher economic status is associated with a higher participation rate in overall and private cancer screening in both sexes and a lower participation rate in NCSP in women. Male office workers and more educated individuals undergo private cancer screening at a higher rate than manual workers and less educated individuals, respectively.
Notes
CONFLICT OF INTEREST: No potential conflict of interest relevant to this article was reported.
ACKNOWLEDGMENTS
We appreciate the help of those working for the Korea Centers for Disease Control and Prevention and individuals participating in the KNHANES V.