Body Mass Index and Mortality according to Gender in a Community-Dwelling Elderly Population: The 3-Year Follow-up Findings from the Living Profiles of Older People Surveys in Korea
Article information
Abstract
Background
Body mass index is widely regarded as an important predictor of mortality. The purpose of this study was to investigate the relationship between body mass index and mortality and to compare community-dwelling elderly people in South Korea according to sex.
Methods
Data were collected from the 2008 and 2011 Living Profiles of Older People Surveys, which comprised 10,613 community-living South Korean men and women aged 65 years or older. The participants were stratified into five groups according to body mass index as defined by the World Health Organization guidelines. The sociodemographic characteristics of participants and mortality rates were compared across the body mass index groups.
Results
The highest survival rates were observed in men with a body mass index of 25.0–29.9 kg/m2. A similar trend was observed in women, but it was not statistically significant. After adjusting for covariates, this association was also found in men across all BMI index groups, but not in women.
Conclusion
This study supports previous findings that overweight or mild obesity is associated with the lowest mortality and suggests that the current categories of obesity require revision. Furthermore, the absence of statistically significant findings in the female cohort suggests that body mass index is not a suitable predictor of mortality in women and that an alternative is required.
INTRODUCTION
Over the past five decades, obesity has become a major cause of increased healthcare costs and decreased quality of life in many countries. 1) Furthermore, obesity is strongly associated with hypertension, type 2 diabetes, and atherosclerotic cardiovascular disease.12) A number of studies have reported that a high body mass index (BMI) is associated with different types of cancer.3) The proposition that overweight or obesity is associated with a greater risk of mortality than normal weight is controversial.4) This obesity paradox has been corroborated by studies involving a range of ethnic groups and patients with a chronic morbidity, such as hypertension, diabetes mellitus, chronic kidney disease, or heart failure.5678)
The World Health Organization (WHO) has reported that the worldwide prevalence of obesity has approximately doubled since 1980.9) Studies have also found that the increased prevalence of obesity in South Korea is associated with an increased incidence of obesity-related diseases, with an estimated socioeconomic cost of 1,792.3 billion Korean won (KRW) in 2008.1011)
A study based on the Korea National Health and Nutrition Examination Survey data (2012) found that the prevalence of age-specific obesity, as defined by the WHO criteria, was not higher in South Korea than in other countries.11) However, for Asians, the WHO suggested using more lenient BMI categories compared with those used in Europe: normal, 18.5–22.9 kg/m2; overweight, 23–24.9 kg/m2; moderate obesity, 25–29.9 kg/m2; and severe obesity, ≥30 kg/m2. This is because although South Korea has a lower obesity prevalence, a higher sensitivity in terms of obesity-related risk factors and cardiovascular-related mortality has been reported.12131415)
The BMI criteria set out by the WHO have been generally accepted; however, many nations try to adjust the criteria for obesity according to the ethnic composition of their populations. A number of studies have reported the association between BMI and mortality in South Korea.41617181920) However, there are limited studies specifically investigating the association between BMI and mortality according to sex in the elderly.
The purpose of this study was to analyze the BMI in community-dwelling persons aged 65 and over in order to compare participants who survived a 3-year follow-up (survival group) and those who were registered as deceased at follow-up (deceased group). This study also evaluated the current criteria for the definition of obesity.
METHODS
1. Subjects
Data were obtained from the 2008 Living Profiles of Older People Survey (comprising 15,146 participants aged 60 years or older) and the 2011 Living Profiles of Older People Survey (comprising 10,003 participants aged 60 years or older). The Living Profiles of Older People Survey is conducted every 3 years to guide the implementation of evidence-based policies for the aging population and includes a number of indicators to monitor trends in the health, lifestyle, and welfare status of Korean elderly people. The surveys were conducted by the Ministry of Health and Welfare of South Korea. Using a multistage cluster sampling design, elderly individuals were selected from households stratified into 25 districts (7 metropolitan and 18 provincial). Trained interviewers conducted the interviews at each participant's home and measured baseline characteristics, health status, and life status.
Of 15,146 eligible participants, those who were not over 65 years of age in 2008 were excluded (n=3,059). Individuals who failed to answer one or more questions in 2008 living profiles of older people survey (n=1,450) and those who did not provide an answer for the survey items, death and suicide, were also excluded (n=24). In total, 10,613 participants were included in the study.
2. Measurements
1) Sociodemographics and covariates
A total of 10,613 participants were divided into death and survival groups in 2011. The sociodemographic characteristics of the two groups included age, sex, BMI, existence of a spouse, residence, education level, employment, household income, smoking status, alcohol drinking status, and exercise. The following covariates, which are known to be associated with increased mortality, were also considered: Korean instrumental activities of daily living (K-IADL), Geriatric Depression Score (GDS), Mini-Mental Status Examination (MMSE), and comorbidities such as hypertension, dyslipidemia, and diabetes mellitus.
2) Body mass index
The BMI was calculated as the subject's weight (kg) divided by the square of height (m2), and categorized into five groups (<18.5, 18.5–22.9, 23.0–24.9, 25.0–29.9, and ≥30 kg/m2) according to the criteria set out by the WHO. We separately compared each calculated odds ratio (OR) of mortality in men, women, and across all participants.
3) Smoking
Three smoking subgroups were identified: never smokers, past smokers, and current smokers. The never smokers had never smoked in their lifetime, past smokers had smoked more than 5 pack-years but were not currently smoking, and current smokers had smoked more than 5 pack-years and were currently smoking.
4) Alcohol intake
Alcohol intake was classified as two or more, one, or no alcoholic drinks per week.
5) Exercise
The subjects were asked about the frequency (times/wk) and duration (minutes) of physical activity according to intensity (light, moderate, or vigorous). Energy expenditure according to intensity of physical activity was assigned the following metabolic equivalents (metabolic equivalents [METs] in mL·kg-1·min-1) for light, moderate, and vigorous intensity activity: 3.3, 4.0, and 8.0 METs, respectively. Exercise time is calculated as vigorous physical activity time×2 plus moderate physical activity time. The exercise subgroups were classified according to the duration of exercise time as follows: at least 150 minutes per week or less than 150 minutes per week.
6) Education
Education was classified as education for at least 8 years or education for less than 8 years.
7) Household income
Household income was classified as less than 679,000 KRW or 679,000 KRW or more. An income of 679,000 KRW represents the upper three quartiles of total personal monthly household income.
8) Assessment of Korean instrumental activities of daily living
Activities of daily living were assessed according to the K-IADL. K-IADL is calculated as an aggregate of the following 10 activities: grooming, doing housework, preparing meals, doing laundry, taking a short trip, using transportation, shopping, managing money, using a telephone, and taking medication. Participants were classified as fully independent, partially dependent, or fully dependent with respect to each activity.
3. Statistical Analysis
We assessed the baseline characteristics of participants after allocating them to two groups (death and survival groups) in 2011. Continuous variables were analyzed using the independent t-test, and categorical variables were analyzed using the χ2 test to compare the two groups.
Multiple logistic regression analysis was performed after designating the death and survival variants as 0 and 1, respectively. The stepwise method was used for variable selection and a P-value <0.05 was considered statistically significant. The selected variables were assessed by multiple logistic regression analysis. The OR was calculated by setting the BMI category 18.5–23.0 kg/m2 as the reference group. Statistical analyses were performed using R ver. 3.2.3 software (R Foundation for Statistical Computing, Vienna, Austria).
RESULTS
Table 1 shows the sociodemographic characteristics and functional status of participants. Of 10,613 subjects enrolled in the study, 6.2% (657) died and 93.8% (9,956) survived by 2011. The mean ages of participants in the death and survival groups were 76.99 and 72.63 years, respectively, and the proportion of male participants in each group was 57.2% and 40.7%, respectively. Subjects who were underweight (BMI <18.5 kg/m2) had a higher mortality rate (16.0% vs. 5.0%, P<0.001), whereas the moderate obesity group (25.0–29.9 kg/m2) showed lower mortality rates (17.2% vs. 27.7%, P<0.001). The participants who died during the follow-up period exercised less (≥150 minutes per week: 2.6% vs. 6.7%, P<0.001), were more dependent in terms of instrumental daily activities (K-IADL score ≥11: 45.1% vs. 23.2%, P<0.001), and had the highest score for symptoms of depression (GDS score ≥8, 37.6% vs. 24.6%, P<0.001). We also compared the two groups according to the following variables: smoking, alcohol intake, education level, employment status, residence, household income, cognitive functional status, and existence of hypertension, dyslipidemia, and diabetes mellitus. There were statistically significant differences between the two groups, except for smoking and education level.
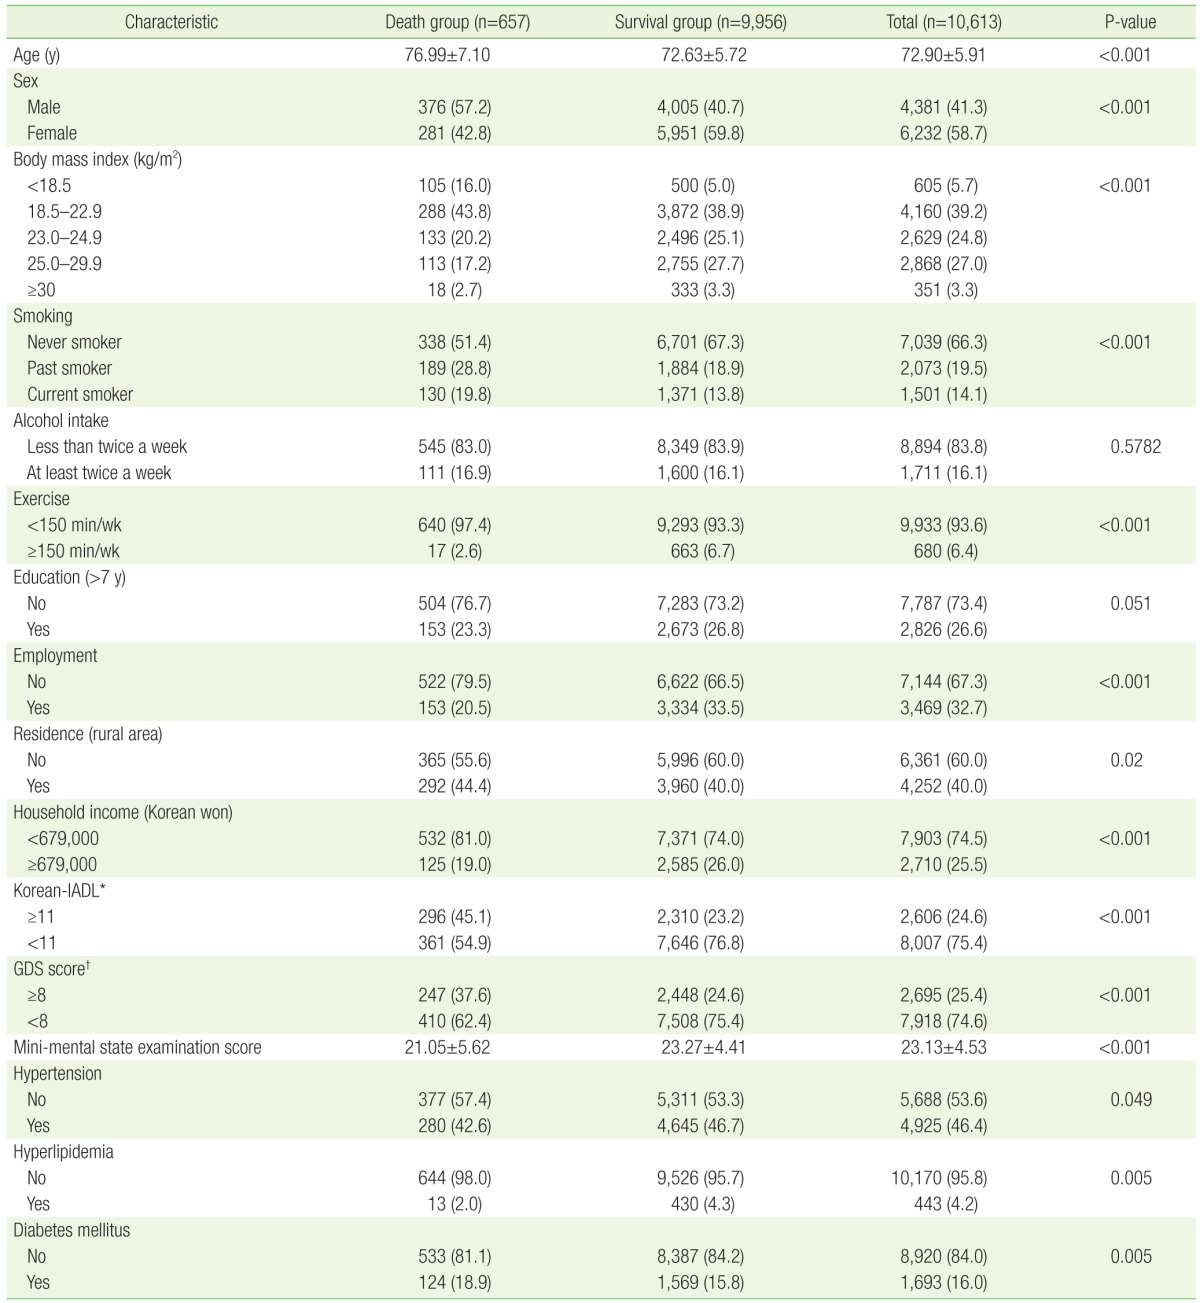
Baseline characteristics of the subjects in 2008 (n=10,613)
The risk of mortality according to BMI in the groups of men, women, and both sexes, is shown in Table 2. The mortality risk according to the BMI in the unadjusted analysis (model 1) was significantly different from that of the diverse variant-adjusted analyses (models 2, 3, and 4). In the case of model 1, mortality in the underweight group (BMI <18.5 kg/m2) had a higher OR than that of the reference group across sexes (men: OR, 3.42; women: OR, 2.25; total: OR, 2.80; P<0.001). The moderate obesity (BMI 25.0–29.9 kg/m2) group showed a lower risk of mortality than the reference group across sexes (men: OR, 0.55; women: OR, 0.63; total: OR, 0.55; P<0.001). In model 2, adjusted for age, there was a significantly higher risk of mortality in the severe obesity group (BMI ≥30 kg/m2) than in the reference group in men and women. However, the decreased mortality risk in the moderate obesity group shown in the model 1 analysis was not observed. In the analysis adjusted for age, smoking, alcohol intake, and exercise level (model 3), the mortality was increased in the underweight group compared with the reference group across all groups stratified by gender, but decreased mortality in the moderate obesity group was found only in men. In model 4, adjusted for education level, employment, residence, household income, K-IADL, GDS, MMSE, and presence of hypertension, dyslipidemia, and diabetes mellitus in addition to those factors adjusted for model 3, showed the same trend as in model 3 (Table 2).
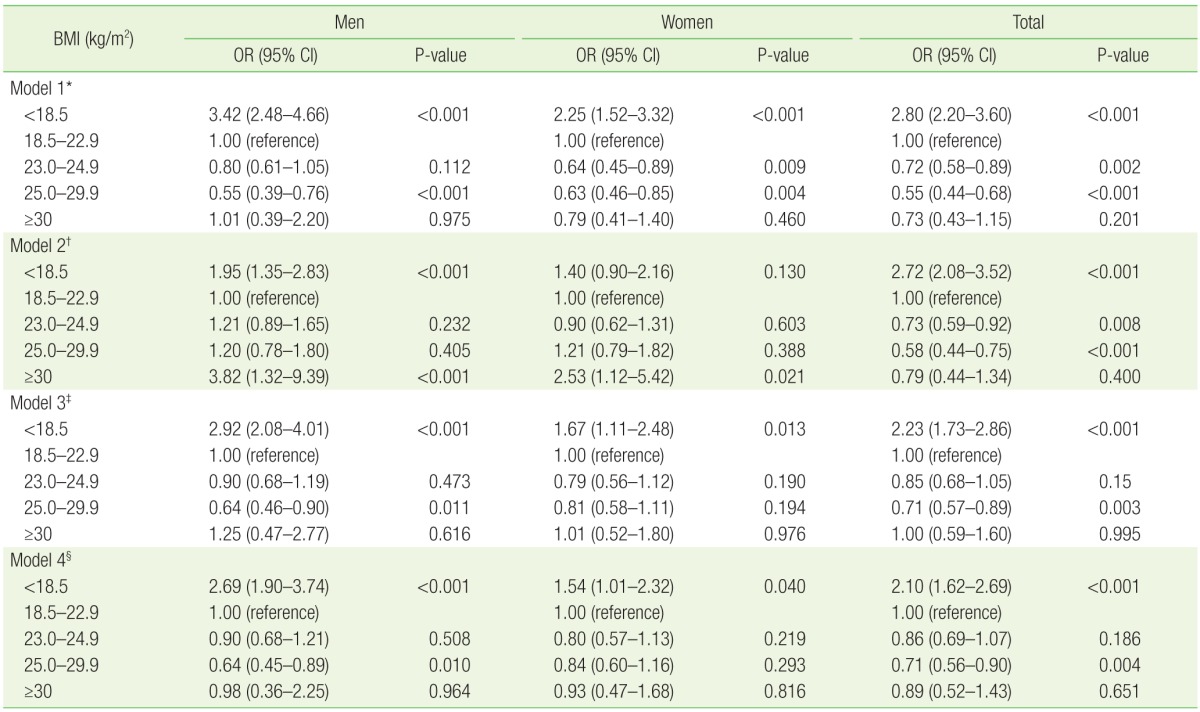
ORs for mortality according to sex by BMI categories in Korean elderly in 2008–2011
DISCUSSION
In this study, using the WHO criteria for the definition of obesity, adapted to the Asian context, the risk of mortality in the moderate obesity group (BMI 25.0–29.9 kg/m2) was lower than in the normal weight group (reference group, BMI 18.5–22.9 kg/m2), and the underweight group (BMI <18.5 kg/m2) had a 2.10-fold higher mortality rate than the reference group. These results are consistent with previous research and support the association between BMI and mortality in elderly people.1621222324) The lowest mortality rate was found in elderly male subjects in the moderate obesity group (BMI 25.0–29.9 kg/m2), although this was not observed for corresponding elderly female subjects.
In previous studies examining the association between BMI and mortality, an increased mortality rate was observed in the underweight and severe obesity group, which demonstrated a U-shaped association. 1621222324) The BMI category of 21.0–27.4 kg/m2 has been identified as the group with the lowest mortality rates. Researchers have suggested that the lower and upper limit of the standard BMI range should be altered from the current value of 18.5 to 21.0 kg/m2 and from 23.0 to almost 27.5 kg/m2, respectively.17) A number of large-scale cohort studies also recommend adjusting the standard BMI range.161821) Furthermore, another study proposed that the optimal BMI range should be age- and sex-specific as BMI has been shown to increase depending on age in both sexes.19)
Research in South Korea on the effects of frailty and BMI on mortality rates in community-dwelling elderly people showed that frailty and BMI significantly increased the mortality rate in men and women.20) In our study, the analysis was stratified according to sex, and the association between BMI and mortality rate was statistically significant in men, but not in women, after adjusting for confounding variables.
Dorn et al.25) reported that mortality secondary to cardiovascular disease, the most common cause of death in the elderly, is lower in women than in men in this age group. This may explain the lack of a statistically significant association between BMI and mortality rate in older women compared with men.
Furthermore, there are differences in body composition and body fat distribution between women and men. The BMI in men is largely determined by muscle mass rather than body fat mass, whereas the BMI in women is generally determined by the latter. Therefore, the BMI categories are not equally applicable to both sexes, and the waist to hip circumference ratio, which measures women's obesity by reflecting body fat distribution, appears to be a more accurate predictor of mortality than BMI.25) This is consistent with evidence suggesting that abdominal obesity is an independent risk factor for increased mortality and that both BMI and the waist to hip circumference ratio are important predictors of mortality.26) Therefore, in older women, it is important to examine alternative measurements of body fat distribution in addition to BMI.
There are several limitations to our study. First, the number of subjects was relatively small compared with earlier large-scale cohort studies. Furthermore, the limited 3-year follow-up period made it difficult to identify BMI or existing comorbidity as the primary cause of death.
Nonetheless, our study is distinct from other studies because we adjusted for older age-specific factors strongly associated with mortality in this age group, such as K-IADL, MMSE, and GDS scores. Moreover, this is the first study to investigate sex-specific mortality rates according to BMI. Further studies examining the association between BMI and increased mortality rates in men and women over a longer follow-up period are required.
Notes
CONFLICT OF INTEREST: No potential conflict of interest relevant to this article was reported.