Evaluation of the Predictive Index for Osteoporosis as a Clinical Tool to Identify the Risk of Osteoporosis in Korean Men by Using the Korea National Health and Nutrition Examination Survey Data
Article information
Abstract
Background
We previously proposed the Predictive Index for Osteoporosis as a new index to identify men who require bone mineral density measurement. However, the previous study had limitations such as a single-center design and small sample size. Here, we evaluated the usefulness of the Predictive Index for Osteoporosis using the nationally representative data of the Korea National Health and Nutrition Examination Survey.
Methods
Participants underwent bone mineral density measurements via dual energy X-ray absorptiometry, and the Predictive Index for Osteoporosis and Osteoporosis Self-Assessment Tool for Asians were assessed. Receiver operating characteristic analysis was used to obtain optimal cut-off points for the Predictive Index for Osteoporosis and Osteoporosis Self-Assessment Tool for Asians, and the predictability of osteoporosis for the 2 indices was compared.
Results
Both indices were useful clinical tools for identifying osteoporosis risk in Korean men. The optimal cut-off value for the Predictive Index for Osteoporosis was 1.07 (sensitivity, 67.6%; specificity, 72.7%; area under the curve, 0.743). When using a cut-off point of 0.5 for the Osteoporosis Self-Assessment Tool for Asians, the sensitivity and specificity were 71.9% and 64.0%, respectively, and the area under the curve was 0.737.
Conclusion
The Predictive Index for Osteoporosis was as useful as the Osteoporosis Self-Assessment Tool for Asians as a screening index to identify candidates for dual energy X-ray absorptiometry among men aged 50–69 years.
INTRODUCTION
Osteoporosis patients have a high risk of fracture, which increases morbidity and mortality.1) The prevalence of osteoporosis increases with aging and is especially high in postmenopausal women. However, according to recent reports, the incidence of osteoporosis in men has increased. The prevalence of osteoporosis in Korean men ranges from 7.3% to 13.1%.234) The incidence of osteoporosis in men is affected by smoking status and alcohol consumption.5)
Osteoporosis is symptomless, but after bone fracture, which occurs in 30% of men with osteoporosis, morbidity and mortality increase. Men with hip fractures have 2 to 3 times higher morbidity and mortality rates than women.6) For these reasons, the importance of early detection and effective treatment of osteoporosis for prevention of fractures in men is increased.
According to current guidelines, men aged 70 years or older should undergo bone mineral density (BMD) testing by dual-energy X-ray absorptiometry (DXA).7) In addition, men aged 50–69 years who have additional risk factors for secondary osteoporosis such as a history of fracture, delayed puberty, hypogonadism, hyperparathyroidism, and use of glucocorticoids should undergo DXA.78) However, the suitability of DXA testing in men aged 50–69 years may be inappropriate. Thus, several clinical tools for identifying those at risk of osteoporosis and those suitable for DXA have been proposed.9101112)
The Osteoporosis Self-Assessment Tool for Asians (OSTA) is one such tool. The OSTA is used to classify individual risk of osteoporosis. It is considered simple and effective, and has been validated for use in women in Asian and Caucasian populations.131415) The index has also been validated in American and Asian studies.10111216) Theses studies also enrolled men aged over 70 years. However, men aged over 70 years should undergo DXA regardless of their risk factors or index score.78) It is more important to identify the group at high risk for osteoporosis and to perform DXA in men aged under 70.
In a previous report, we proposed a Predictive Index for Osteoporosis (PIO) that could be used to determine the increased risk of osteoporosis in Korean men under 70 years old.17) The results for Korean men under 70 years old indicated that both OSTA and PIO were useful for determining the risk of osteoporosis and identifying those who should undergo DXA. However, that study only included subjects at a single center and the study sample size was small. In the present study, we aimed to determine whether the PIO can predict the risk of osteoporosis and if it can be useful in selecting candidates for BMD testing among Korean men aged 50–69 years.
METHODS
1. Subjects
The present study was based on data obtained from the Korea National Health and Nutrition Examination Survey (KNHANES) conducted between 2008 and 2011 (KNHANES IV-V). Since 1998, the KNHANES has been performed periodically by the Korea Centers for Disease Control and Prevention. The KNHANES is a cross-sectional, nationwide survey. The survey's sample population is chosen by stratifying household units, followed by a multistage sampling process. The KNHANES data are considered representative of the entire Korean population. All KNHANES participants provide written informed consent.
In the present study, we only included men aged 50–69 years who had undergone DXA. Men aged 70 years or older should undergo DXA, regardless of their osteoporosis risk; therefore, risk assessment indices are not needed for men over 70 years. We excluded individuals who had chronic liver disease, chronic kidney disease, thyroid disease, rheumatoid arthritis, asthma, or any malignancy. After these exclusions, 2,519 men were enrolled in our study.
2. Measurements
The KNHANES included a self-reported health behavior questionnaire and health examinations. The health behavior questionnaire surveys demographic information, health status, and health behavior, and also includes questions related to income, marital status, smoking habits, alcohol consumption, and exercise. Subject height (m) and weight (kg) were measured. Body mass index (BMI) was calculated by dividing weight by the square of height. All data were gathered by trained staff using standardized tools. BMD was measured by using a DXA scanner (Hologic, Bedford, MA, USA). Lumbar spine (L1–4) and proximal femur BMD values were obtained. The presence of osteoporosis was defined by the mean of lumbar spines (L1–4), femoral neck, or total femur T-scores ≤−2.5 SD, according to the World Health Organization criteria. Subjects with foreign bodies in the bones, such as surgical pins or cement, or with evidence of compression fractures or degenerative changes, were excluded from the analysis.
3. Clinical Assessment Index
The current study used 2 indices to assess the risk of osteoporosis in Korean men aged 50–69 years. First, a subject's PIO score was computed by using {age in years (+10; for current smoker only)/weight in kilograms}.17) In addition, a subject's OSTA score was calculated by using {(weight in kilograms−age in years)×0.2}, truncated to yield an integer (Figure 1).16)
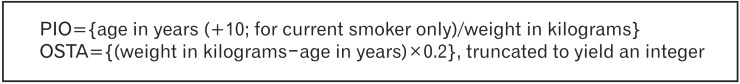
Calculation method for PIO and OSTA. PIO, Predictive Index for Osteoporosis; OSTA, Osteoporosis Self-Assessment Tool for Asians.
4. Statistical Analysis
The present study used a complex sample general linear model and complex sample logistic regression analysis to compare group characteristics. To compare the predictability of an osteoporosis risk between the PIO and OSTA indices, receiver operating characteristic (ROC) analysis was conducted. A minimum value of {(1−sensitivity)2+(1−specificity)2} was used to determine the cut-off point for the PIO and OSTA indices. Outcomes were considered statistically significant if the P-value was <0.05. All statistical analyses were conducted by using IBM SPSS software ver. 20.0 (IBM Co., Armonk, NY, USA) and dBSTAT ver. 4.0 (Seoul, Korea).
RESULTS
1. Clinical Characteristics of Subjects
A summary of the general characteristics of the study subjects are presented in Table 1. In our study group, 2,519 men aged 50–69 years were included. The mean age of the participants was 57.6 years, and 61.8% of the subjects were current smokers. The mean PIO index and OSTA index values were 0.96±0.00 and 1.76±0.05, respectively.
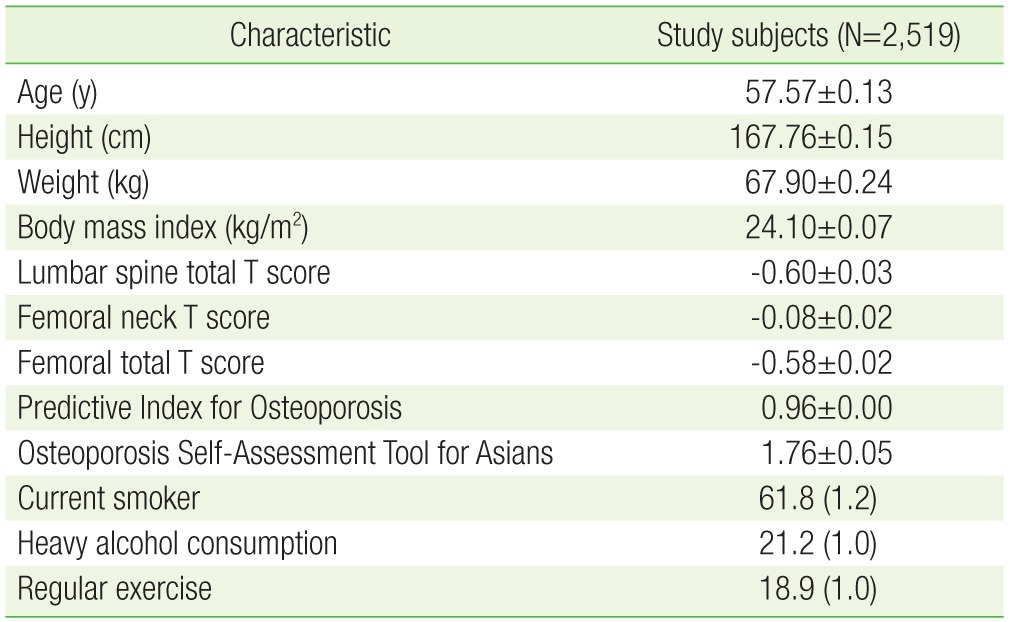
General characteristics of the study subjects
The results obtained by comparative analysis of the 2 groups are summarized in Table 2. The prevalence of osteoporosis in the lumbar spine or proximal femur in our study group was 4.9%. In men aged 50–69 with osteoporosis, the mean of lumbar spine T scores was −2.82±0.05, and the femoral neck and total femoral T scores were −1.86±0.07 and −0.18±0.08, respectively. More smokers were in the osteoporosis group, with a prevalence of 70.3%, compared with the 61.3% in the normal or osteopenia group (P=0.083).
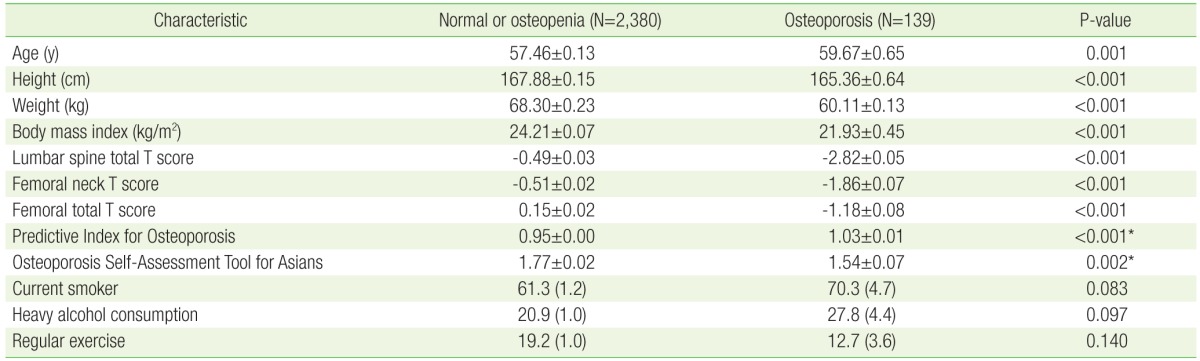
General characteristics of study subjects according to bone mineral density status
After adjustment for age and BMI, the mean OSTA index was 1.77±0.02 in the normal or osteopenia groups and 1.54±0.07 in the osteoporosis group. The mean OSTA index was significantly different between the 2 groups (P=0.002). The mean of PIO was also different in the 2 groups, with statistical significance. As seen in Table 2, the mean value of PIO was 0.95±0.00 in the normal or osteopenia group and 1.03±0.01 in the osteoporosis group (P<0.001).
2. Optimal Index Cut-off Values
Based on the levels of sensitivity and specificity, the optimal cut-off value for the indices to predict the presence of osteoporosis in Korean men aged 50–69 was calculated. The optimal cut-off value for the PIO was 1.07 obtained by the minimum value of {(1−sensitivity)2+(1−specificity)2}. At that cut-off, the sensitivity of the index used to predict osteoporosis was 67.6%, and specificity was 72.7%. With the PIO index, the positive likelihood ratio for osteoporosis was 2.48 and the negative likelihood ratio was 0.45.
According to the definition, the cut-off value for OSTA was 0.5. At that value, the index's sensitivity and specificity were 71.9% and 64.0%, respectively. The positive and negative likelihood ratios of OSTA index for osteoporosis were 2.00 and 0.44, respectively.
The ROC curves for the PIO and OSTA indices are presented in Figure 2A and Figure 2B, respectively. At the respective optimal cut-off values, the area under the curve (AUC) was 0.743 for the PIO index (P<0.001; 95% confidence interval [CI], 0.70 to 0.79) and 0.737 for the OSTA index (P<0.001; 95% CI, 0.69 to 0.78). However, no statistically significant difference was detected between the 2 ROC graphs (P=0.203).
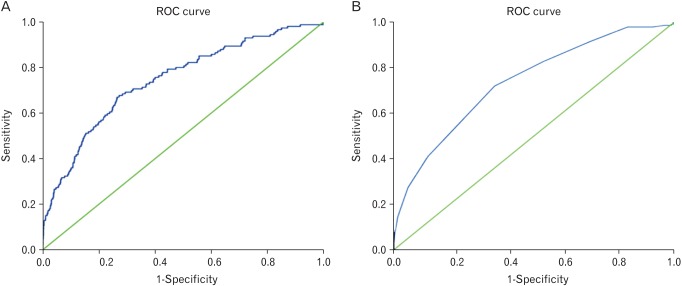
ROC curves of PIO and OSTA corresponding with osteoporosis. (A) PIO. (B) OSTA. PIO, Predictive Index for Osteoporosis; OSTA, Osteoporosis Self-Assessment Tool for Asians; ROC, receiver operating characteristic.
DISCUSSION
The results of this study indicated that the easily calculated PIO was a valid predictive index that can be used in Korean men 50–69 years of age to classify the risk of osteoporosis and to select candidates suitable for DXA.
To overcome the single-center, small-sample-size limitations of our previous study, we analyzed data obtained from KNHANES in this study. The osteoporosis portion of KNHANES involved a large-scale, nationwide Korean survey of BMD. The KNHANES data were nationally representative and strictly quality controlled by the government. In our analysis, we used the entire set of KNHANES BMD data, if the data were not excluded by our criteria.
In our previous study, the PIO had a greater AUC of 0.74 (P<0.001) than that of OSTA (AUC, 0.69; P<0.001). In this study, the 2 indices had similar AUCs. The difference between the results of these 2 studies may be due to the inclusion of current smoking as a risk factor in the PIO formula. Assessment of smoking status for the prediction of osteoporosis was supported by recent research results. For example, in the Framingham study, current smokers exhibited greater bone loss than former or never smokers.18) Moreover, in a meta-analysis-based study, smoking status was more closely associated with the presence of osteoporosis in men than in women.19)
In a previous study, the cut-off values for PIO and OSTA were 0.87 and 2.5, respectively.17) The differences between those values and the 1.07 and 0.5 found in the present study may be due to differences in the characteristics of the 2 study populations. In the current study, the subjects were older and had lower mean weight than those in the previous report. The mean age of the participants in the previous study was 54.3±7.9 years, whereas the mean age in the current study was 57.6±0.1 years. The mean weight in the previous study was 72.2±2.9 kg, whereas the mean weight in the current study was 67.9±0.2 kg.
The current study has limitations. First, our data source was limited to Korean men. Second, both the diagnosis and treatment of osteoporosis are directed at prevention of future bone fractures. Thus, it is more important to predict fracture risk rather than the risk of osteoporosis. Fracture risks are more complicated to assess because such risks are related to both BMD and bone quality. Recently, a Fracture Risk Assessment Tool (FRAX) designed to allow prediction of a 10-year fracture probability was proposed.20) However, FRAX requires BMD results and may not be suitable for application in a primary care setting. Until a new fracture probability index with high predictive accuracy and a novel osteoporosis screening test are developed, DXA screening and FRAX are the most suitable tools for the prevention of osteoporotic fractures. Third, the amount of tobacco and length of time a man has smoked are important risk factors in the development of osteoporosis However, in our PIO formula, we only considered current smoking status as a risk factor for osteoporosis. Clearly, it is good to consider many risk factors when predicting osteoporosis, but a simple index is more valuable in a primary healthcare setting. Regardless of the limitations of our research, our results are meaningful for the detection of osteoporosis and the prevention of osteoporotic fractures. We expect that future studies on PIO and other indices may assist in identifying fracture risks.
In conclusion, for Korean men 50–69 years of age, PIO is easy to calculate, and like OSTA, is useful when selecting candidates for DXA testing.
Notes
CONFLICT OF INTEREST: No potential conflict of interest relevant to this article was reported.