Association between Obesity and Neighborhood Socioeconomic Status in Korean Adolescents Based on the 2013 Korea Youth Risk Behavior Web-Based Survey
Article information
Abstract
Background
An increase in the obese adolescent population is being recognized as a serious medical and social problem. The present study aimed to examine the association between neighborhood socioeconomic status (SES) and obesity in Korean adolescents based on total available resources and local social inequality models.
Methods
The present study used data from the 2013 Korea Youth Risk Behavior Web-based Survey in analyzing 72,438 Korean adolescents aged 12–18. The analysis investigated obesity odds ratio (OR) according to neighborhood SES adjusted for age and individual SES indices, which included family affluence scale (FAS), education level of parents, cohabitation with parents, and weekly allowance. Obesity OR was investigated according to neighborhood SES by FAS, and according to FAS by neighborhood SES.
Results
After adjusting for age and individual SES variables, there was no significant association between neighborhood SES and adolescent obesity for either boys or girls. However, girls in the high FAS group showed a pattern of lower neighborhood SES being associated with a significant increase in risk of obesity; in the high neighborhood SES group, boys showed a pattern of higher FAS being associated with a significant increase in risk of obesity, whereas girls show a pattern of decrease.
Conclusion
Although limited, the present study demonstrated that some girl groups exhibited a pattern of lower neighborhood SES being associated with an increase in risk of obesity, as well as a gender-based difference in risk of obesity by individual SES. Therefore, measures to prevent adolescent obesity should be established with consideration for differences in risk according to individual and neighborhood SES.
INTRODUCTION
With a rapid increase in prevalence worldwide, adolescent obesity is being recognized as an important health issue.1) South Korea is also experiencing an increase in obese adolescents due to overnutrition and lack of physical activity. According to recently published reports by Statistics Korea and the Korea Ministry of Gender Equality & Family, the prevalence of obesity in Korean adolescents was 15.3% in 2013, with boys (16.7%) being 2.8% higher than girls (13.9%); these numbers represented a 3.0% and 4.4% increase in prevalence of adolescent obesity in boys and girls, respectively, since 2006.2)
Adolescent Obesity can not only contribute to physical ailments that can occur during adolescence, such as hypertension, diabetes, and dyslipidemia, but can also lead to mental disorders, including eating disorders, depression, and suicide.34) Moreover, adolescent obesity mostly leads to adult obesity,5) causing various physical, mental, and social issues.67) Thus, preventive prescreening and management of adolescents with a high risk of obesity are of utmost importance.8)
The causes of obesity include demographic, health behavior, and psychological factors, as well as environmental factors that include family, school, and community, and are associated with each other in a complex manner.9101112) An individual's socioeconomic characteristics can lead to obesity since these are associated with health behaviors such as nutritional intake and physical activity. Moreover, a community possesses the physical and social traits that can influence an individual's health, and the socioeconomic characteristics of a region can influence the onset of obesity, since they are related to physical, cultural, and human infrastructure that can influence the health of individuals within that region.13)
Among prior studies that examined the influence of socioeconomic characteristics of a region on personal health, Stafford and Marmot approached the topic using two models. The first model was the collective resource model, which was based on the hypothesis that residents in affluent neighborhoods would have better health status than those in impoverished neighborhoods, since they had greater advantages in utilizing material and social resources (social support structure, community services, etc.). The second model was the local social inequality model, which was based on the hypothesis that a greater gap between the socioeconomic status (SES) of an individual and his or her neighborhood would indicate poorer health status of the individual. This study concluded that since the SES of a neighborhood has the trait of influencing the total available resources within the community, it can also influence the health of individuals.
However, most existing studies that analyzed the associations between socioeconomic characteristics of neighborhoods and obesity have limitations from using indicators that reflected only some of the characteristics, such as work, residence, and education. Moreover, there have been no studies in Korea that have used data representative of Korean adolescents. Thus, the present study aimed to examine the association between neighborhood SES and obesity in Korean adolescents using data from the 2013 Korea Youth Risk Behavior Web-based Survey (KYRBWS).
METHODS
1. Subjects
The present study used raw data from the 2013 KYRBWS, which was obtained from the homepage of KYRBWS after complying with the usage protocol of the Korea Centers for Disease Control and Prevention (KCDC).14) The Korean version of the regional Deprivation Index (DI) from Health Promotion Strategies and Program Development for Health Inequalities Alleviation that was published in December 2009 by an academic cooperation foundation of Hanyang University was also used.15)
KYRBWS is an anonymous online survey in a self-reporting format that Korea Health and Human Services, KCDC, and the Korea Ministry of Education, Science, and Technology have conducted annually since 2005 among middle and high school students in Korea to investigate health status. The survey was developed for sample schools according to city size, regional group, and school type among 16 major cities and provinces in Korea, and one sample class per grade level was randomly selected. All students in the sample classes were then surveyed on 126 questions in 15 categories, including smoking, drinking, physical activity, dietary habits, mental health, health equity, and others; the survey was conducted between June 1 and July 17, 2013 on 72,435 students from a total of 800 schools (400 middle and 400 high schools), and the response rate was 96.6%, with 36,655 boys and 35,780 girls participating in the survey.
2. Variable Measurements
Self-reported height and weight were used to calculate body mass index (BMI, kg/m2), and weight status was classified as percentile according to gender- and age-specific BMI on the 2007 Korea National Growth Chart for Children and Adolescents. The subjects were classified as underweight for <5 percentile, normal weight for ≥5 to <85 percentile, overweight for ≥85 to <95 percentile, and obese for ≥95 percentile or BMI ≥25.
The indicators used in estimating personal SES were family affluence scale (FAS), education level of parents, cohabitation with parents, and weekly allowance. FAS was classified into three groups of low-tier (0–2 points), middle-tier (3–5 points), and high-tier (6–9 points), based on total score from questions and scores of: number of cars owned (none [0], one [1], and two or more [2]); have own room (no [0] and yes [1]); number of family weekend vacations during the past year (none [0], once [1], twice [2], and three or more times [3]); and number of household computers (none [0], one [1], two [2], and three or more [3]). Education level of parents was classified into three groups of middle school or less, high school graduation, and college or higher; cohabitation with parents was classified into four groups of no parents, father only, mother only, and both parents. Weekly allowance was classified as low-tier for 0–9,999 Korean won (KRW), middle-tier for 10,000–49,999 KRW, and high-tier for ≥50,000 KRW.
The Korean version of the neighborhood DI for area units of si- (city), gun- (county), and gu- (district) was classified into tertiles of low region (third tertile), middle region (second tertile), and high region (first tertile), which were used as indicators representing neighborhood SES. Neighborhood DI was an index derived from adding the standardized scores from a total of 8 subindices of DI that reflected neighborhood SES by using 2% of sample survey data from the 2005 population and housing survey, which the Korea Health Promotion Foundation used in Health Promotion Strategies and Program Development for Health Inequalities Alleviation. The index was calculated by adding the scores from rates of poor living environment, elderly population, population with education level below high school graduation, household members belonging to low social class, apartment households, single households, female-headed households, non-car-owning households (urban), and non-car-owning households (rural).
3. Analysis
IBM SPSS ver. 21.0 (IBM Co., Armonk, NY, USA) was used for statistical analysis, with statistical significance set to 0.05. Data from KYRBWS were surveyed via systematic sampling and contained weighted values; hence, statistical analysis was performed by applying the weighted values. Differences in prevalence of obesity between males and females based on the subject's age, FAS, education level of parents, cohabitation with parents, weekly allowance, and neighborhood SES were analyzed using the chi-square test. For assessment of an independent association between adolescent obesity and neighborhood SES based on individual SES and a total available resource model, multivariate logistic regression analysis was performed with the first step adjusted for age (model 1), and the second step adjusted for age, FAS, education level of parents, cohabitation with parents, and weekly allowance (model 2).
For assessment of an independent association between adolescent obesity based on a local social inequality model and neighborhood SES, multivariate logistic regression analysis adjusted for age, education level of parents, cohabitation with parents, and weekly allowance was used to compare the obesity odds ratios (OR) according to neighborhood SES by FAS. To examine the combined influences of individual and neighborhood SES on adolescent obesity, multivariate logistic regression analysis was performed with the first step adjusted for age (model 1) and the second step adjusted for age, education level of parents, cohabitation with parents, and weekly allowance (model 2). For assessment of an independent association between individual SES and adolescent obesity that excluded the socioeconomic influences of the neighborhood, multivariate logistic regression analysis adjusted for age, education level of parents, cohabitation with parents, and weekly allowance was used to compare the obesity OR according to FAS by neighborhood SES.
RESULTS
1. General Characteristics of Study Subjects
The mean ages of boys and girls were 15.0±0.4 and 14.9±0.4 years, respectively, while mean BMI was 20.4±SE kg/m2 and 19.9±SE kg/m2, respectively. Prevalence of obesity was significantly higher in boys, at 13.1%, versus 6.2% in girls (P-value <0.001). FAS consisted of 11.3% in the low-tier, 51.7% in the middle-tier, and 37.0% in the high-tier, with a mean FAS score of 4.8 points for both boys and girls. The most common education levels of parents were college or higher for fathers at 43.3% and high school graduation for mothers at 41.6%. Living with both parents (82.4%) was most common for cohabitation with parents, while the middle-tier (53.4%) was the most common weekly allowance.
2. Prevalence of Obesity according to Socioeconomic Variables of Individuals and Neighborhoods
The differences in prevalence of obesity according to socioeconomic variables of individuals are shown in Table 1. Significant differences were seen according to education level of parents, cohabitation with parents, and weekly allowance in boys, and according to FAS, education level of parents, and cohabitation with parents in girls. In girls, lower FAS was associated with a significant increase in prevalence of obesity, while in boys and girls both, lower education level of parents was associated with a significant increase in prevalence. Prevalence of obesity according to cohabitation with parents was the highest in the groups that lived with only father or mother for boys and girls, respectively, while it was lowest in the groups that lived with no parent or both parents for boys and girls, respectively. In boys, more weekly allowance was associated with a significant increase in prevalence of obesity. Only girls showed a significant increase in prevalence of obesity according to lower neighborhood SES.

Prevalence of obesity according to individual and neighborhood SES in boys and girls
3. Obesity Odds Ratio according to Socioeconomic Variables of Individuals and Neighborhoods
The obesity OR of boys and girls according to individual SES is shown in Table 2. Relative to the high FAS group, obesity OR of boys in the low FAS group was significantly low, with higher FAS tending to show a significant increase in OR; in girls, obesity OR in the low FAS group was significantly higher than that of the high FAS group. When paternal education levels were compared to the college or higher group, both boys and girls showed that lower education level resulted in a significant increase in obesity OR. For maternal education level, only girls tended to show lower education level resulting in a significant increase in OR. Obesity OR according to cohabitation with parents was significantly high in the groups that lived with father only for boys, and mother only for girls, relative to the group living with both parents. Meanwhile no significant differences in OR were seen in boys or girls for weekly allowance.

Adjusted ORs for obesity according to individual and neighborhood SES in boys and girls
Obesity OR in boys and girls by neighborhood SES based on a total available resource model is shown in Table 2. Obesity OR was significantly higher in girls from the low-tier neighborhood group than in the high-tier neighborhood group, while boys did not show any significant difference. The effects of neighborhood SES on obesity based on the local social inequality model are shown in Table 3. Boys showed no significant difference in obesity OR according to neighborhood SES by FAS, while girls exhibited a pattern of significant increase in obesity OR with lower neighborhood SES in the high-tier FAS group, as well as an increase in obesity OR, although not significant, with lower neighborhood SES in the low-tier FAS group.
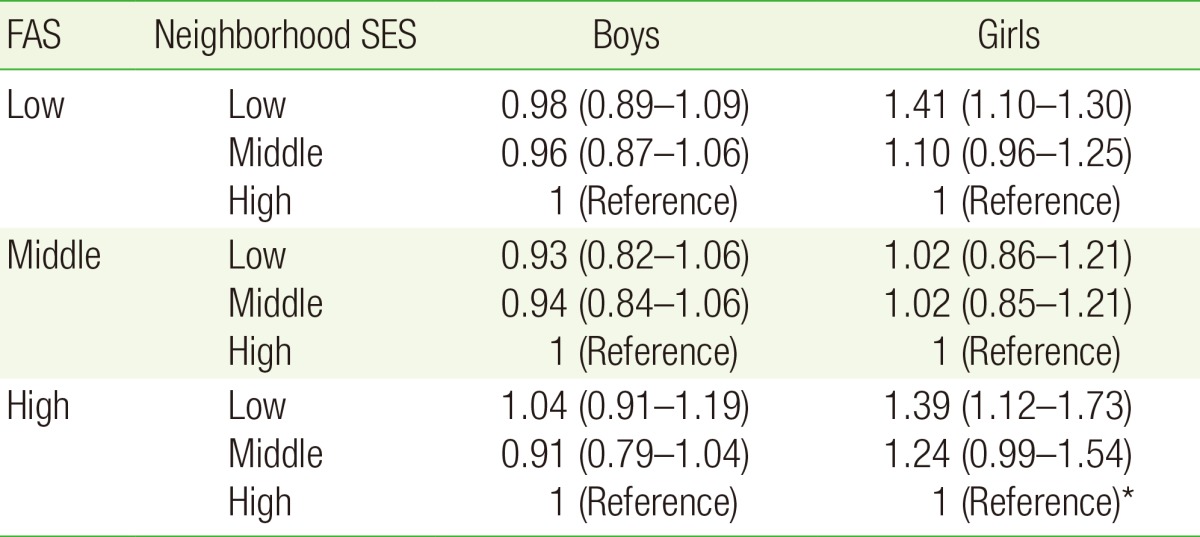
Adjusted ORs for obesity according to neighborhood SES among FAS in boys and girls
The influence of individual SES on adolescent obesity with exclusion of socioeconomic influences of the neighborhood is shown in Table 4. Boys exhibited a pattern of higher FAS being associated with a significant increase in obesity OR in the high and low neighborhood SES groups, whereas girls tended to show higher FAS being associated with a decrease in obesity OR in the high neighborhood SES group.
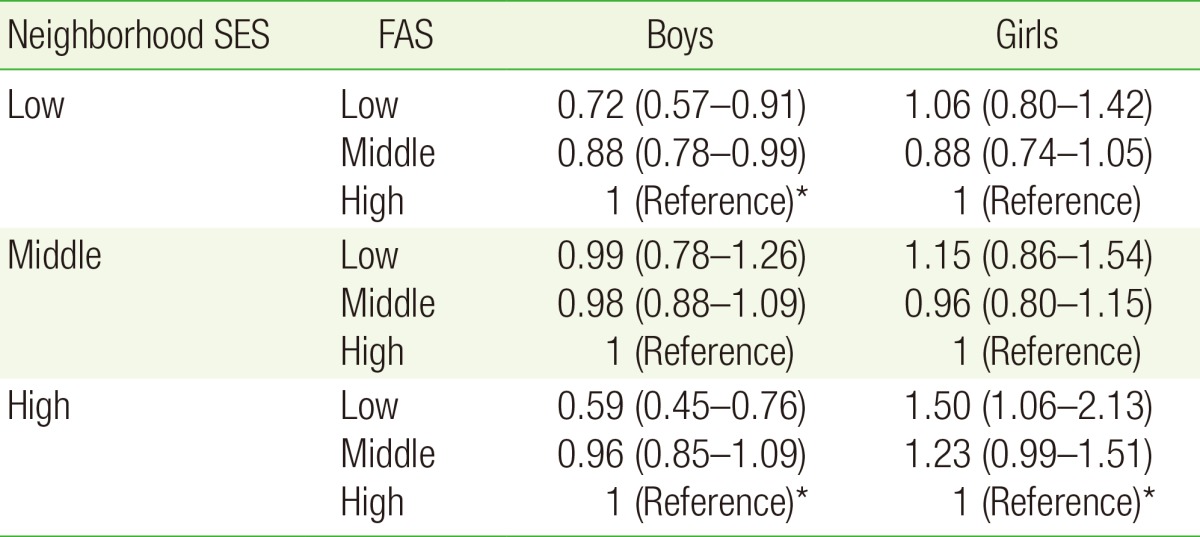
Adjusted ORs for obesity according to FAS among neighborhood SES in boys and girls
DISCUSSION
The present study used the data from the 2013 KYRBWS in examining the influences of socioeconomic factors on adolescent obesity at both individual and neighborhood levels. In both boys and girls, neighborhood SES did not significantly influence obesity, but girls did exhibit a pattern of lower neighborhood SES being associated with a significant increase in risk of obesity in the high FAS group. The association between individual SES and adolescent obesity showed a pattern of genderbased differences; boys in high SES neighborhoods showed higher FAS being associated with a significant increase in risk of obesity, whereas girls showed higher FAS being associated with a significant decrease in risk of obesity.
In a review of prior studies analyzing the association between regional socioeconomic characteristics and obesity in adolescents, a study on Canadian adolescents found that for lower neighborhood SES, that took into consideration local unemployment rate and population, a rate of education level below middle school was associated with an increase in consumption of unhealthy foods, and lower individual SES was associated with decreased physical activities; hence, the study reported that individual and regional SES was directly associated with adolescent obesity.16) A study on American adolescents reported that in addition to individual characteristics, such as monthly household income, a lower regional SES based on poverty rate and physical surroundings was significantly associated with an increase in obesity in children and adolescents.17) Another study on American adolescents found that having decreased access to service resources within the community, such as walkways, playgrounds, recreational spaces, and welfare facilities, resulted in an increase in obesity rate.18) Yet another study from America reported that when adolescent obesity rate was investigated according to distribution of neighborhood sports facilities, an increase in social capital within a neighborhood increased the number of available sports facilities, which in turn decreased the adolescent obesity rate.19)
Although many studies have reported that individual and neighborhood SES is closely associated with adolescent obesity, the present study did not find a clear-cut association. However, girls in the high FAS group did show a pattern of significantly increased risk of obesity in association with lower neighborhood SES. This demonstrated, in a limited manner, that the association between neighborhood SES and adolescent obesity was based on the total available resources model, which hypothesizes that accessibility of physical and social resources within the community of residence influences the health of individuals; this is in contrast to the local social inequality model, which hypothesizes that relative deprivation due to differences in the levels of individual SES, and socioeconomic level of the neighborhood that the individual resides in, influence the individual's health. In other words, higher neighborhood SES means having a more abundant supply of physical and social resources within the community that are needed for prevention and management of obesity; hence, the risk of obesity would decrease due to more favorable conditions for utilizing such resources.
Relationships between individual SES and obesity based on gender showed patterns that differed from each other. These patterns also appear in adults, with numerous studies reporting that obesity in men was associated with income, but in women was associated with education level.202122232425) The reason that risk of obesity according to individual SES differs by gender is believed to be due to gender-based differences in awareness of and satisfaction with body type.26) With advances in society, awareness of obesity has also increased; due to the sociocultural influence of preference for thin body types, interest in weight control increases as well. However, women more than men are sensitive to outer appearance or body type; since there is a tendency for obesity in women to act as a disadvantage in the market economy, women show a strong tendency to prefer a thin body type compared to men. Moreover, women often attempt to control their weight, since their interest in body type is higher when SES factors such as income and education level are higher; they become dissatisfied with their body type as a result of being overly conscious of it. Because of this, a significant decrease in the risk of obesity may have been seen in girls with higher FAS.20272829) In contrast, men are freer than women from social pressures related to body type,30) and tend to take on a somewhat cynical attitude toward taking measures to prevent obesity and improve health.31) Moreover, because of psychological characteristics that view a larger body as physically superior to a thin body type,20) men are believed to show results that differ from women.
The significance of the present study is that it used data from Korea that were representative of the entire nation; it also used the Korean version of the neighborhood DI, which is an index that comprehensively assesses neighborhood SES, in identifying relative differences within the community; furthermore, it analyzed the independent influences of neighborhood SES on adolescent obesity by controlling for various individual indices. However, the Korean version of the neighborhood DI used to estimate SES was derived from a 2% sample of survey data from a 2005 population and housing survey; thus, the study has the limitation associated with use of a sample rather than a full enumeration survey. Moreover, because the regional units analyzed in the Korean version neighborhood DI and 2013 KYRBWS were not the same, there are limitations in making an accurate estimation of neighborhood SES. Furthermore, because KYRBWS was conducted in a self-reporting format, inaccurate data may have been entered through failing to realize that the numbers had changed, which can present limitations in interpretation of the results.32) The present study applied conventional single-level analysis to multilevel data that combined individual level variables with regional level variables. This presents limitations in the interpretation of the results, since analyzing multilevel data at an individual level cannot satisfy the independence of observation assumption; in contrast, analysis at a regional level can cause contextual and ecological fallacies, since individual level variables are aggregated for use. Therefore, for more in-depth analysis on how individual and neighborhood SES influences obesity, future studies that use multilevel model analysis are needed.
Although limited to only some groups of girls, the present study did identify a pattern of lower neighborhood SES leading to an increase in risk of obesity, and also confirmed a genderbased difference in risk of obesity according to individual SES. Therefore, in establishing measures for prevention and management of adolescent obesity, it is necessary to reinforce individualized support in high SES regions, and strengthen the physical, cultural, and human infrastructure within the community in low SES regions. It is equally necessary to devise educational and policy measures aimed at boys in high individual SES groups and girls in low SES groups.
Notes
CONFLICT OF INTEREST: No potential conflict of interest relevant to this article was reported.