Disparity in Health Screening and Health Utilization according to Economic Status
Article information
Abstract
Background
Cardiovascular disease (CVD) has become the most common cause of mortality and morbidity worldwide. Health screening is associated with higher outpatient visits for detection and treatment of CVD-related diseases (diabetes mellitus, hypertension, and dyslipidemia). We examined the association between health screening, health utilization, and economic status.
Methods
A sampled cohort database from the National Health Insurance Corporation was used. We included 306,206 participants, aged over 40 years, without CVD (myocardial infarction, stroke, and cerebral hemorrhage), CVD-related disease, cancer, and chronic renal disease. The follow-up period was from January 1, 2003 through December 31, 2005.
Results
Totally, 104,584 participants received at least one health screening in 2003–2004. The odds ratio of the health screening attendance rate for the five economic status categories was 1.27 (95% confidence interval [CI], 1.24 to 1.31), 1.05 (95% CI, 1.02 to 1.08), 1, 1.16 (95% CI, 1.13 to 1.19) and 1.50 (95% CI, 1.46 to 1.53), respectively. For economic status 1, 3, and 5, respectively, the diagnostic rate after health screening was as follows: diabetes mellitus: 5.94%, 5.36%, and 3.77%; hypertension: 32.75%, 30.16%, and 25.23%; and dyslipidemia: 13.43%, 12.69%, and 12.20%. The outpatient visit rate for attendees diagnosed with CVD-related disease was as follows for economic status 1, 3, and 5, respectively: diabetes mellitus: 37.69%, 37.30%, and 43.70%; hypertension: 34.44%, 30.09%, and 32.31%; and dyslipidemia: 18.83%, 20.35%, and 23.48%.
Conclusion
Thus, higher or lower economic status groups had a higher health screening attendance rate than the middle economic status group. The lower economic status group showed lower outpatient visits after screening, although it had a higher rate of CVD diagnosis.
INTRODUCTION
Cardiovascular disease (CVD) has recently become the most common cause of mortality and morbidity in the world.12) South Korea's National Health Insurance Corporation (NHIC) has launched a population based screening and prevention program for CVD. This prevention program regularly screens for diabetes mellitus, hypertension, and dyslipidemia as modifiable CVD risk factors.34)
Few studies have been conducted to examine the association between economic status and CVD-related conditions that affect the general population with access to national health screening programs and health utilization services.356) Some studies have reported greater health utilization in higher economic status groups.678) However, a limitation of these studies is the use of relatively small samples.67) Additionally, occupation types and real estate ownership have been used as indicators of economic status. However, these may not accurately reflect economic status.78)
Screening is associated with more outpatient visits for detection and treatment of CVD-related conditions such as diabetes mellitus, hypertension, and dyslipidemia.9) The relationship between economic status and health utilization is well known. However, only a few studies have analyzed a nationwide database to examine the association of health utilization after participating in a health screening program, according to economic status. Thus, we aimed to determine the association of a nationwide health screening program with economic status. We conducted a cross sectional study using a population-cohort database.
METHODS
1. Study Population and Design
The NHIC is a mandatory social insurance program that covers nearly the whole Korean population (96.9%). A biennial health screening program was developed for the early detection of CVD-related conditions for those aged over 40 years.
The health screening examination assists in detecting and identifying CVD-related conditions, including diabetes mellitus, hypertension, and dyslipidemia.9) We analyzed data from NHIC members who participated in the screening program from 2003–2004. Attendees who reported an outpatient visit related to the health screening program were defined as patients who visited an outpatient clinic within a year after the screening.
From these members, we excluded participants who already had CVD (myocardial infarction, stroke, and cerebral hemorrhage), CVDrelated disease (diabetes mellitus, hypertension, and dyslipidemia), cancer, and chronic renal disease. We included members aged over 40 years because, in South Korea, most screening programs begin at the age of 40 years. Finally, 306,206 NHIC members who met the criteria were included.
As the health screening is conducted biennially, we defined the screening attendees as those who had been invited and participated in the health screening program in 2003–2004. The health screening attendance rate was analyzed as well as the diagnostic rate of CVD-related conditions among people who received the health screening. Furthermore, we conducted an analysis of the rate of outpatient visits after health screening. We defined the outpatient visit period as January 1, 2003 to December 31, 2005.
2. Data Collection
We used the NHIC sample cohort database, which consists of information about NHIC member's basic health conditions and health screening data, disability registry, costs incurred, and monthly insurance premiums that are based on economic status. The database also contains information about related mortality (e.g., death date and reason for death).
The NHIC medical service claim data set during 2002 is composed of diagnostic codes that are based on the International Classification of Diseases, tenth revision.10) The Charlson comorbidity index (CCI), a weighted measure of comorbidity, was used to explain comorbidities. We used claim data records to detect visits to outpatient clinics. The NHIC claim records during 2002–2005 include information on healthcare expenditure and health care utilization related to inpatient and outpatient visits, treatment costs incurred for hypertension, diabetes, dyslipidemia, and other related conditions, and expenses for monitoring and diagnosis. Data for the year 2002 was used for detecting underlying diseases and generating information for the CCI.
In South Korea, insurance premiums are decided according to income levels. The monthly insurance premium is calculated based on private auto tax, real estate holdings, and annual income. To assign income levels appropriately, all members are classified into grades that are determined according to points assigned for their income. The insurance premium is calculated for the corresponding points.
In the NHIC cohort database, economic status is divided into 10 groups of insurance members according to insurance premiums, except for the Medicaid group. We modified the economic status groups into five categories by merging two groups into one. Although the categories may not fully reflect the economic status of the NHIC members, insurance premiums reflected the overall income distribution.
The National Disability Registry was used to identify people with disabilities. We created a variable indicating whether the person had a disability or not.11) Screening data consisted of health questionnaires, physical examinations, and laboratory data. Health questionnaires included lifestyle information related to smoking status (current smoker, non-smoker, or ex-smoker) and alcohol intake (non-drinker or drinker). Physical examinations included measurement of height, weight, and blood pressure. Body mass index (kg/m2) was calculated as the weight (kg) divided by height (m) squared. The laboratory data consisted of fasting blood glucose, total cholesterol, hemoglobin, blood urea nitrogen, creatinine, aspartate transaminase, alanine transaminase, and urine analysis. For this study, only fasting blood glucose and total cholesterol levels were included.
3. Study Outcomes
In this study, ‘attendee’ meant patients who participated in the health screening program in 2003 or 2004, and ‘non-attendee’ meant those who did not participate in the program during this period. The number of attendees and non-attendees was 104,584 and 201,622, respectively. We analyzed the distribution of economic status between the two groups.
The NHIC advises participants with abnormal test results to visit a hospital for consultation, to evaluate for a CVD-related condition. Therefore, we checked whether these participants visited a hospital for consultation after their health screening. We analyzed the rate of outpatient visits after the health screening among those who had met the diagnostic criteria for diabetes mellitus, hypertension, or dyslipidemia and had not been previously diagnosed. The number of patients who were advised to visit the out-patient units for each CVD-related condition was as follows: diabetes mellitus (n=1,997), hypertension (n=9,687), and dyslipidemia (n=2,774).
In our study, hypertension was defined as systolic blood pressure over 140 mm Hg or diastolic blood pressure over 90 mm Hg.12) Diabetes mellitus was defined as serum fasting glucose level ≥126 mg/dL.13) Dyslipidemia was defined as serum cholesterol level ≥240 mg/dL.14) We obtained screening results from only the first visit; therefore, some differences may exist between the initial and final diagnoses.
4. Statistical Analysis
Descriptive statistics were used to report the NHIC cohort database characteristics. Values were presented as the mean±standard deviation and frequencies (percentages). A chi-square test was applied for the analysis of the distribution of characteristics, diagnostic rate, and screening attendance rate. We also used a logistic regression to give a P-value to determine trends in the screening attendance rate. We also compared the distribution of basic characteristics, biennial health screening attendance rate, and outpatient visit rate after health screening, by economic status. Stata ver. 14.0 (Stata Corp., College Station, TX, USA) was used for all statistical analyses. The P-value for statistical significance of the two-tailed test was P<0.05.
Results
The differences in characteristics between attendees and non-attendees are described in Supplementary table 1. The difference between male and female attendees are presented in Table 1. Characteristics of participants by economic status are described in Supplementary table 2. Among 306,206 participants, 104,584 people attended the biennial health screening at least once during 2003–2004. The characteristics of health screening attendees by economic status are shown in Supplementary table 3. Attendees with economic status 1 were fewer in number (15,213) compared to non-attendees with economic status 1 (28,216) (Table 2).
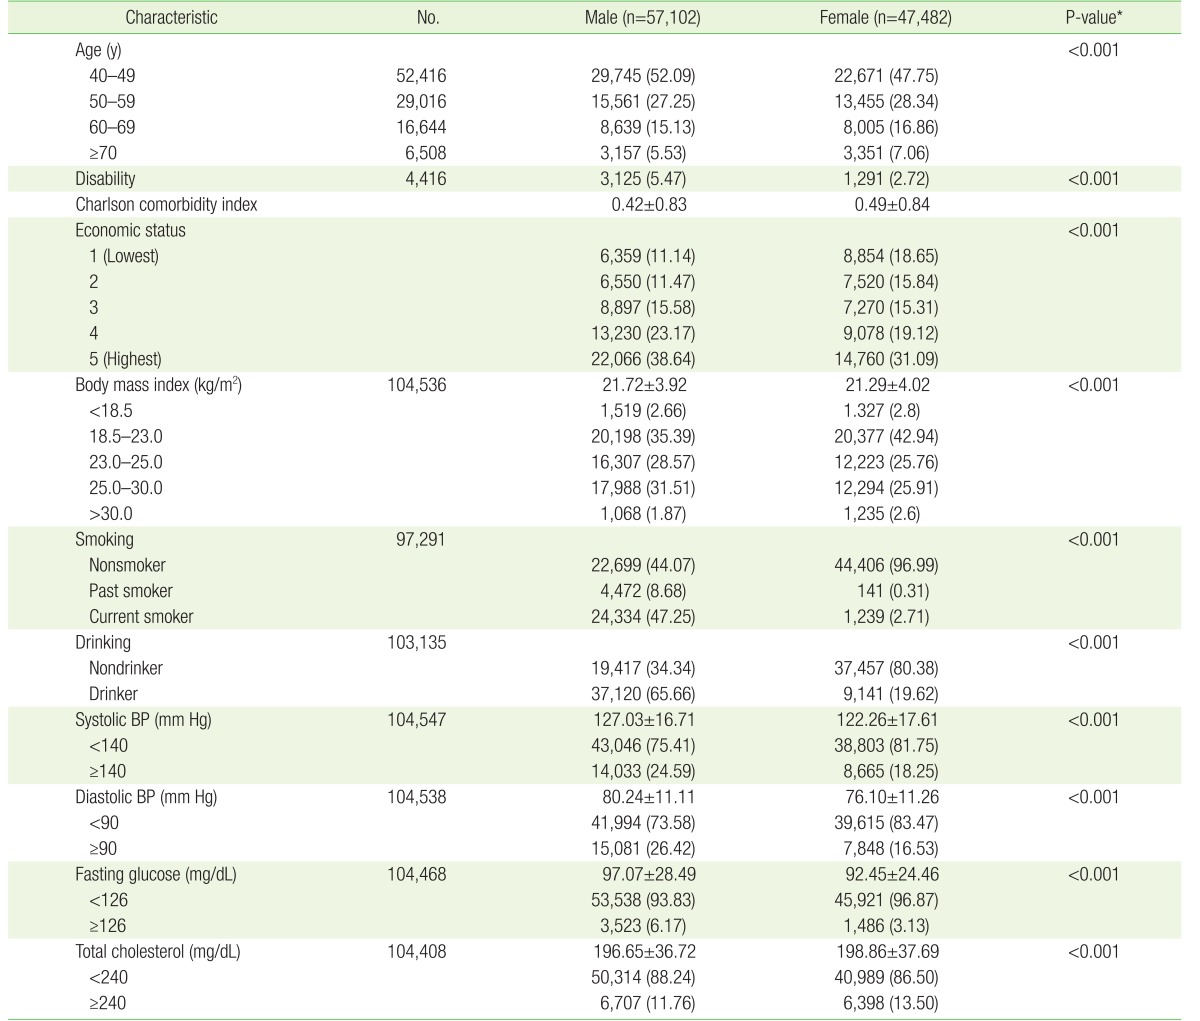
Characteristics of the health screening attendees by sex

Attendance rate of nationwide health screening program by economic status in 2003–2004
The middle economic status group had the lowest screening attendance rate: (35.03%, 30.79%, 29.74%, 32.88%, and 38.81% for economic status 1–5, respectively). Table 2 shows the odds ratios (ORs) and 95% confidence interval for the association between economic status and health screening attendance as follows: 1.27 (1.24–1.31), 1.05 (1.02–1.08), 1, 1.16 (1.13–1.19) and 1.50 (1.46–1.53) for economic status 1–5, respectively. We analyzed the adjusted ORs after adjusting for age, sex, CCI, and disability. The results were similar with adjusted results as follows: 1.33 (1.30–1.37), 1.07 (1.04–1.10), 1, 1.16 (1.13–1.19), and 1.50 (1.47–1.54) for economic status 1–5, respectively. Thus, the higher and lower economic status groups had a higher attendance rate compared to the middle economic status group (Table 2).
The number of cases in which people were diagnosed with CVD-related conditions was as follows: diabetes mellitus (n=5,009), hypertension (n=29,999), and dyslipidemia (n=13,105) (Table 3). The diagnostic rate for CVD-related conditions after health screening tended to decrease with an increase in economic status (diabetes mellitus: 5.94%, 5.36%, and 3.77%, respectively, for economic status 1, 3, and 5; hypertension: 32.75%, 30.16%, and 25.23%, respectively, for economic status 1, 3, and 5, and dyslipidemia: 13.43%, 12.69%, and 12.20%, respectively, for economic status 1, 3, and 5) (Table 3).

The outpatient clinic visit rate after attending the health screening program when diagnosed with diabetes mellitus, hypertension and dyslipidemia according to economic status
The rate of outpatient visits among those who were diagnosed by a health screening program was higher among attendees with a higher economic status. However, unlike diabetes mellitus and dyslipidemia, the rate of outpatient visits for hypertension was higher among attendees with a lower economic status (diabetes mellitus: 37.69%, 37.30%, and 43.70%, respectively, for economic status 1, 3, and 5; hypertension: 34.44%, 30.09%, and 32.31%, respectively, for economic status 1, 3, and 5; and dyslipidemia: 18.83%, 20.35%, and 23.48%, respectively, for economic status 1, 3, and 5) (Table 3). We also analyzed the rate of those diagnosed with a CVD-related condition and outpatient visits according to sex. The results were similar with original results (Supplementary tables 4, 5, 6, 7).
DISCUSSION
In our study, we found that participants in the middle economic status groups had the lowest rate of health screening program attendance. The lowest economic groups had the lowest rate of outpatient clinic visits even though they had higher rates of newly diagnosed diseases, as compared to participants with a higher economic status.
The middle economic status group showed the lowest screening attendance rate of all the groups. The lowest economic status groups had the second highest attendance rate. Although the reason is not clear, limited accessibility due to lack of time could be a key explanation for the phenomenon. There is little out of pocket cost for the health screening program in Korea. Therefore, cost may not be a barrier to screening attendance. Rather than cost, lack of time could be a problem. Korea has the third highest amount of working hours among the Organization for Economic Cooperation and Development countries (http://data.oecd.org/emp/hours-worked.htm) and the middle income group has a higher employment rate compared to the lower income group.
In South Korea, some participants use a private health screening program. We could not conduct an analysis on the private health screening rates because our study only used data from the nationwide health screening program database. It is possible that those from the middle economic status group attend a private health screening program more frequently than the lower economic status groups. This could explain why the lowest economic status group has the second highest health screening attendance rate and the middle economic status group had the lowest screening attendance rate. We found similar trends from the annual statistics of the Statistical Research Institute. These statistics include the health screening attendance rate from 2006–2012. The health screening attendance rates of the lowest and the highest income group were higher compared to middle income group. However, we could not compare the income groups because the data did not include actual income numbers.15) Although further research should be done, our study suggests that interventions to increase time availability and accessibility of health screenings should be considered for the middle economic status group.
It was interesting to note that the outpatient visit rates of attendees with diabetes mellitus or dyslipidemia tended to increase in the higher economic status group. However, the outpatient visit rates of attendees with hypertension showed the opposite.
In our study, the lowest economic status group showed the lowest outpatient visit rate of attendees with diabetes mellitus or dyslipidemia even though they had the highest diagnostic rate. Treatment cost could be a factor to explain this; therefore, ways to reduce the financial burden of treatment should be explored.
Unlike diabetes mellitus and dyslipidemia, the outpatient visit rate for hypertension was higher in the lower economic status group. The total number of those diagnosed with hypertension after heath screening was significantly higher than for the other CVD-related conditions (diabetes mellitus: 5,009, hypertension: 29,999, dyslipidemia: 13,105) (Table 3). The diagnostic rate for hypertension after health screening showed the same tendency for economic status 1 (5.94%, 32.75%, and 13.43%, respectively, for diabetes mellitus, hypertension, and dyslipidemia) (Table 3). These results are also confirmed by the fact that low economic status is a risk factor for CVD-related conditions.161718)
After we excluded participants with CVD-related conditions, there were more participants in the higher economic status group than in the lower economic status group. This means that many healthy participants without diseases belonged to the higher economic status group. This could have affected the results prior to the analysis (Supplementary table 1).
A limitation of our study is that we did not evaluate the educational status of the participants. Lower educational level may influence one's understanding of disease severity, which can affect health utilization. Additionally, a lower level of education has been reported in lower economic status groups.19) However, because educational level and economic status are generally closely related, this probably did not significantly affect the present results.
Very few studies have analyzed the relationship between economic status and health service utilization and screening. Several studies have shown higher health service utilization in higher economic status groups.20) One study used a national insurance database; however, the sample size was small. Other studies have used participants' occupation type and real estate ownership to assess their economic status.678)
Despite these limitations, because the NHIC determines the economic status of participants based on their insurance premium, our study can be regarded as a relatively accurate assessment of the economic status as compared to previous studies.
A strength of our study is that we used a nationwide database. All Koreans are required to join the NHIC. Participants who joined the NHIC showed a low rate of follow-up loss and censoring. Therefore, by using the sampled cohort database, our study was able to include a large number of participants. Through the analysis of the trends in health screening and utilization, this study can provide a basis for future national preventive health care policy development.
In conclusion, we found the higher or lower economic status groups had higher health screening attendance rates than the middle economic status group. The lower economic status group showed lower outpatient visits after screening, even though it had a higher diagnosis rate of CVD. Our findings will be of use in formulating national policies for people with lower economic status.
Notes
CONFLICT OF INTEREST: No potential conflict of interest relevant to this article was reported.
References
SUPPLEMENTARY MATERIALS
Supplementary tables 1-7 can be found via http://pdf.medrang.co.kr/KJFM/2017/038/KJFM038-04-08_Supple0.pdf.
Supplemental table 1
Characteristics of the cardiovascular health screening program attendees and non-attendees
Supplemental table 2
Characteristics of the National Health Insurance Corporation sample cohort database by economic status
Supplemental table 3
Characteristics of the health screening program attenders by economic status
Supplemental table 4
Attendance rate of nationwide health screening program according to male by economic status in 2003–2004
Supplemental table 5
Attendance rate of nationwide health screening program according to female by economic status in 2003–2004
Supplemental table 6
The outpatient clinic visit rate of males after attending the health screening program and diagnosed with diabetes mellitus, hypertension and dyslipidemia according to economic status
Supplemental table 7
The outpatient clinic visit rate of females after attending the health screening program and diagnosed with diabetes mellitus, hypertension and dyslipidemia according to economic status