• KAFM
  • Contact us
  • E-Submission
ABOUT
ARTICLE CATEGORY
BROWSE ARTICLES
AUTHOR INFORMATION

Articles

Original Article

Martin's Equation as the Most Suitable Method for Estimation of Low-Density Lipoprotein Cholesterol Levels in Korean Adults

Korean Journal of Family Medicine 2017;38(5):263-269.
Published online: September 22, 2017

Department of Family Medicine, Inje University Sanggye Paik Hospital, Seoul, Korea.

Corresponding Author: Jongwoo Kim. Tel: +82-2-950-1150, Fax: +82-2-952-4093, s2700@paik.ac.kr
• Received: October 20, 2016   • Revised: October 24, 2016   • Accepted: October 24, 2016

Copyright © 2017 The Korean Academy of Family Medicine

This is an open-access article distributed under the terms of the Creative Commons Attribution Non-Commercial License (http://creativecommons.org/licenses/by-nc/4.0/) which permits unrestricted noncommercial use, distribution, and reproduction in any medium, provided the original work is properly cited.

  • 9,182 Views
  • 124 Download
  • 29 Web of Science
  • 31 Crossref
  • 28 Scopus
prev next
  • Background
    Friedewald equation is the most widely used method for estimating low-density lipoprotein cholesterol (LDL-C) level. However, due to potential over- or underestimation, many studies have used a modified equation. This study aimed to compare estimates by 4 different equations to directly measured LDL-C concentrations in order to propose the most appropriate method for LDL-C estimation in the Korean population.
  • Methods
    We studied data of 4,350 subjects that included total cholesterol, high-density lipoprotein cholesterol (HDL-C), triglyceride (TG), and LDL-C concentrations that had been measured at one university hospital in Seoul. We investigated 4 equations: LDL-C by Friedewald's original equation (LDL-CF) and its 3 modifications. Pearson correlation analysis was performed to compare these estimates to the direct measurement.
  • Results
    Pearson correlation analysis revealed a good correlation among all 4 estimated LDL-C values and the directly measured LDL-C value. The Pearson coefficients were 0.951 for LDL-CF, 0.917 for LDL-C by Hatta equation (LDL-CH), 0.968 for LDL-C by Puavilai equation (LDL-CP), and 0.983 for LDL-C by Martin equation (LDL-CM). Martin equation (LDL-CM) resulted in the best approximation (mean difference from the direct measurement, 5.5 mg/dL; mean percentage difference from the direct measurement, 5.1%) and the best agreement with the direct measurement (86.1%). LDL-CP resulted in the second-best approximation (mean difference, 7.0 mg/dL; mean percentage difference, 6.2%; concordance, 82.5%). LDL-CM was found to be less influenced by TG and HDL-C levels than by LDL-CF.
  • Conclusion
    Estimates by Martin equation had the best agreement with direct LDL-C concentrations and both Martin and Puavilai equations were superior to Friedewald equation for estimating LDL-C concentrations in Korean adults.
Based on many studies showing that high serum low-density lipoprotein cholesterol (LDL-C) concentration is the strongest marker of atherosclerosis and an important risk factor for cardiovascular disease (CVD), the US National Cholesterol Education Program Adult Treatment Panel III (NCEP-ATP III) has recommended that serum LDL-C level should be the primary target in dyslipidemia treatment. In addition, dyslipidemia patients should be classified into risk categories according to their LDL-C levels, because a strong positive association between LDL-C and CVD has been well-established.1234)
The gold standard for LDL-C measurement is β-quantification using ultracentrifugation, but it is a time-consuming process, relatively expensive, and requires large serum sample volume.5) Thus, instead of measuring LDL-C levels directly, LDL-C concentration is usually estimated with Friedewald equation, using total cholesterol, triglyceride (TG), and high-density lipoprotein cholesterol (HDL-C) concentrations, in primary practice. This equation is known to be valid only in patients whose serum TG concentrations are less than 400 mg/dL.67)
Friedewald equation uses the assumptions that very low-density lipoprotein cholesterol (VLDL-C) greatly influences TG levels and that the ratio between TG and VLDL-C is 5; however, the actual ratio varies. Thus, many studies have stated that Friedewald equation tends to either overestimate or underestimate LDL-C in individuals, especially in those with conditions such as diabetes mellitus, alcoholic liver disease, and chronic renal failure who are on dialysis.891011)
According to a recent study in Korean populations, Friedewald equation accurately estimated directly measured serum LDL-C concentrations in Korean adults only when the TG concentration was within the range of 36–298 mg/dL.12) It tended to overestimate LDL-C when TG was less than 150 mg/dL and underestimate it when TG was over 150 mg/dL. The use of Friedewald equation led to a 9.1% misclassification rate in those with higher TG levels versus an 8.3% misclassification rate in those with lower TG levels.13) Both overestimation and underestimation can be problematic; overestimating LDL-C leads to prescribing unnecessary medication and underestimating it can delay proper treatment. For this reason, many studies have attempted to modify the equation by changing the TG:VLDL-C ratio. A study conducted by DeLong et al.14) suggested an optimal TG:VLDL-C ratio of 6 instead of 5, using a large sample size of 10,483 individuals, and Puavilai et al.15) confirmed that this equation is more accurate than Friedewald's original equation, with an odds ratio of 2.63. Recently, Martin et al.16) suggested an adjustable novel factor instead of a fixed ratio, using the N-strata-specific median TG:VLDL-C ratio classified by TG and non-cholesterol level, which provided more accurate risk classification without additional costs as compared with Friedewald's original equation. Additionally, Lee et al.17) found that Martin's novel method significantly improved the LDL-C estimation when compared with Friedewald equation in the Korean population.
Thus, we aimed to compare each estimate made using these 4 equations with directly measured LDL-C concentrations in order to propose the most appropriate method for LDL-C estimation without significant error in the Korean population.
1. Study Subjects
Data were collected retrospectively from 4,350 subjects who had their total cholesterol, HDL-C, TG, and LDL-C levels tested between January 2015 and September 2015 at the Health Promotion Center of Inje University Sanggye Paik Hospital in Seoul, South Korea. We included all patients who were tested during that period, with the exception of 80 subjects who were excluded due to having TG levels over 400 mg/dL. Data of the remaining 4,270 patients (2,801 men and 1,469 women) were analyzed in the current study. This study was approved by the Institutional Review Board of Inje University Sanggye Paik Hospital in Seoul, South Korea (IRB approval No. SGPAIK 2016-05-024).
2. Study Procedure
Body mass index was calculated as weight/height2 (kg/m2). Systolic and diastolic blood pressure (mm Hg) was measured by an automated oscillometric blood pressure recorder (Dinamap ProCare 100; GE Healthcare, Milwaukee, WI, USA), with the patients in a seated position after having them relax for five minutes.
Blood samples were obtained from each subject after more than eight hours of fasting. Fasting blood sugar (FBS) level was measured using an enzymatic assay and an automated analyzer (Hitachi Automated Analyzer 7600; Hitachi, Tokyo, Japan). Hemoglobin A1c was measured by high-performance liquid chromatography with the BIO-RAD VARIAN II (BIO-RAD, Hercules, CA, USA). Total cholesterol (Pureauti S CHO-N; Daiichi, Tokyo, Japan), HDL-C (Cholestest N HDL, Daiichi), TG (Pureauto S TG-N, Daiichi), and LDL-C (Cholestest-LDL; Sekisui Medical, Tokyo, Japan) were measured by enzymatic method using the Hitachi Automatic Analyzer 7600 (Hitachi).
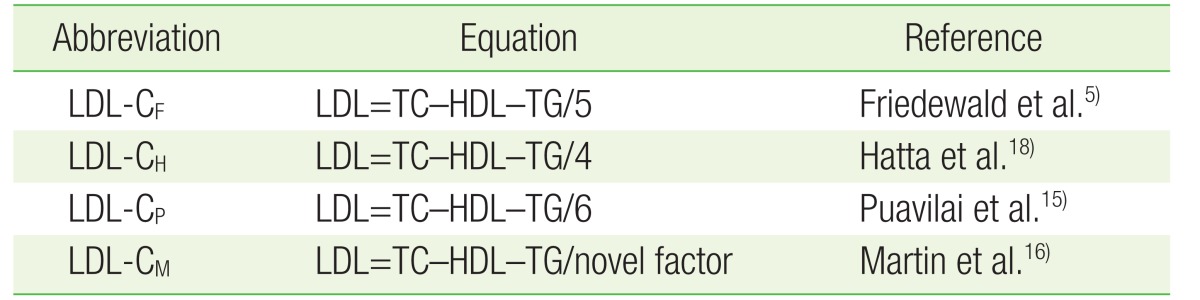
To identify the proper TG:VLDL-C ratio, we estimated LDL-C levels by 4 equations shown in Table 1, from the many equations that have been suggested so far.181920212223242526) Two of the equations used a different assumption of a TG:VLDL-C ratio, 4 and 6 instead of 5, and the Martin equation used a novel factor as described above. The Martin LDL-C (Martin equation, LDL-CM) estimate was calculated using an LDL-C calculator instead of the N-strata-specific median TG:VLDL-C ratio classified by TG and non-cholesterol level (http://www.ldlcalculator.com).
The terms used are as follows: “Diff” is defined as the absolute value of the difference between the direct measurement and estimation, and “Delta%” is defined as the percentage difference between directly measured and estimated LDL-C.
To analyze the correlation between directly measured LDL-C and estimated LDL-C, cross-tabulation by Pearson's chi-square was done and directly measured and estimated LDL-C were categorized by the standards of the Korean National Health Insurance Service based on NCEP-ATP III guideline cutoffs of 100, 130, and 160 mg/dL. HDL-C and TG values were categorized by the NCEP-ATP III guideline cutoffs; HDL-C cutoffs were 40, 50, and 60 mg/dL, and TG cutoffs were 100, 150, 200, and 400 mg/dL.
3. Statistical Analysis
Statistical analysis was conducted with SAS ver. 8.11 (SAS Institute Inc., Cary, NC, USA); all data are presented as mean±standard deviation (SD) or proportions. The Student t-test and the chi-square test were used to compare the differences between two groups and Pearson correlation analysis was used to compare correlations between directly measured LDL-C and estimated LDL-C concentrations. A P-value less than 0.05 was considered to be statistically significant. After LDL-C, HDL-C, and TG values were categorized by the NCEP-ATP III guidelines, cross-tabulation by the Pearson chi-square test was used for analysis of the concordance between directly measured and estimated LDL-C. One-way analysis of variance (ANOVA) was performed for multiple comparisons of Diff and Delta% amongst the TG and HDL-C strata.
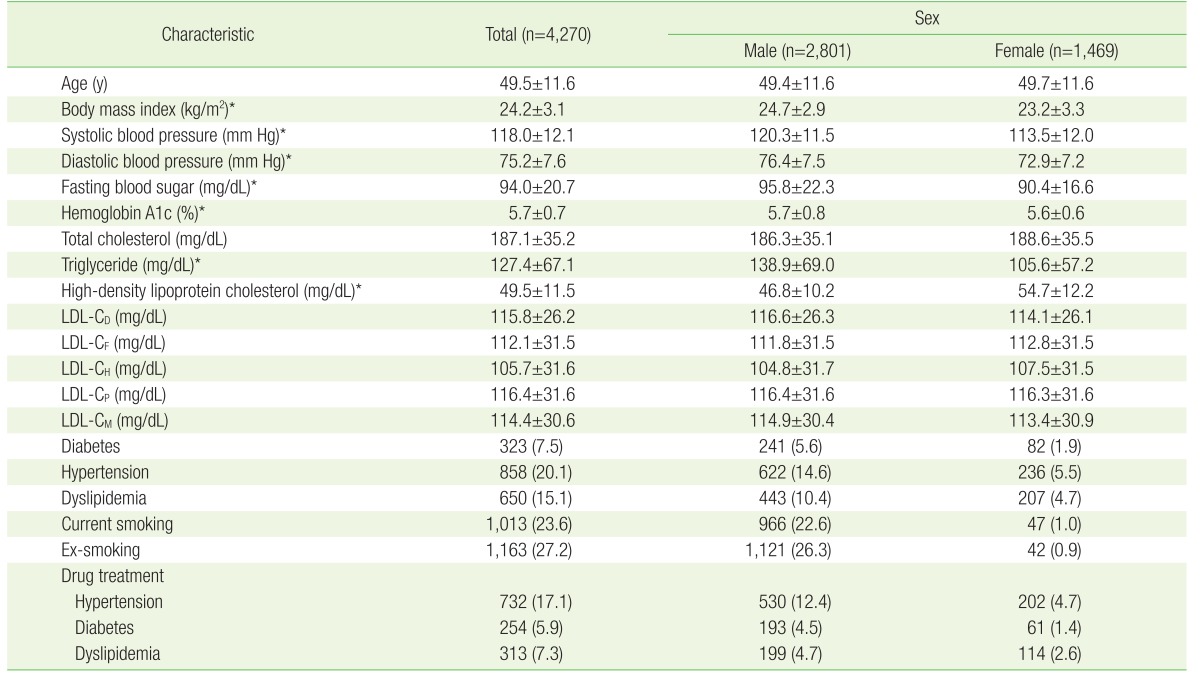
Table 2 shows the baseline characteristics of the study population overall and by sex. The study group consisted of a total of 4,350 subjects (2,801 men and 1,469 women). The overall age of the study subjects was 49.5±11.6 years and there was no significant difference in age by gender. Men had significantly higher systolic and diastolic blood pressure, FBS, and TG concentration and lower HDL-C concentration than women. Men also had a higher incidence of hypertension, diabetes, dyslipidemia, and current or past smoking history than women.
Pearson correlation analysis found a good correlation between the 4 estimates of LDL-C and directly measured LDL-C. The Pearson coefficients were LDL-CF (Friedewald equation, 0.951), LDL-CH (Hatta equation, 0.917), LDL-CP (Puavilai equation, 0.968), and LDL-CM (0.983).
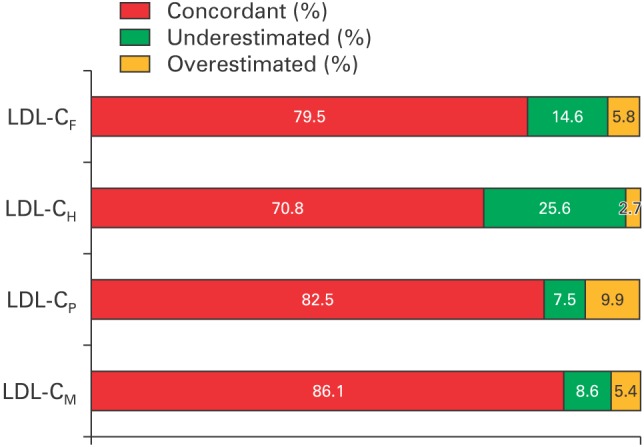
We compared the concordance of the directly measured LDL-C with the estimated LDL-C when classifying LDL-C values by NCEP-ATP III guideline cutoffs of 100, 130, and 160 mg/dL. We labeled the result as being “concordant” if the two values were in the same classification, as an “overestimation” if the estimated value was greater than the direct measurement, or as an “underestimation” if the estimated value was less than the direct measurement. As a result, LDL-CM resulted in the best concordance with the direct measurement (86.1%) and LDL-CP resulted in the second-best concordance (82.5%) (Figure 1). LDL-CF resulted in a concordance of 79.5%, lower than that of LDL-CM and LDL-CP. LDL-CP had the highest rate of overestimation (9.9%); the overestimation using LDL-CM (5.4%) was similar to that using LDL-CF (5.8%). Conversely, LDL-CP had the lowest underestimation rate (7.5%), followed by LDL-CM (8.6%).
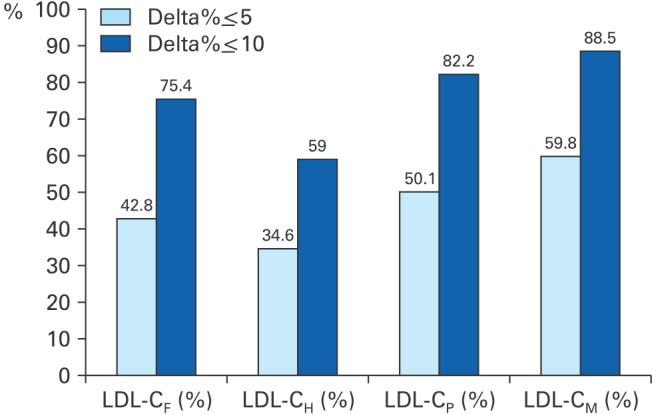
We also compared the proportion of the “Delta%”, the percentage difference between directly measured and estimated LDL-C, which was below 5% and below 10% (Figure 2). According to this result, LDL-CM is appropriate for the majority of cases, 17% more using Delta% ≤5 and 13.1% more using Delta% ≤10, as compared with LDL-CF. LDL-CP was also superior to LDL-CF (7.3% and 6.8% more, respectively).
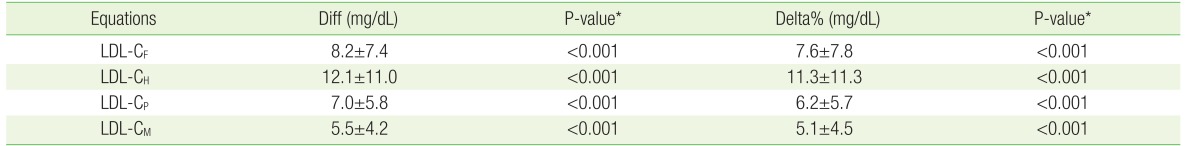
“Diff”, the absolute value of the difference between direct measurement and estimation in terms of mean and SD, is given in Table 3. LDL-CM was found to produce the best approximate value of the 4 estimations, having a 5.5 mg/dL mean Diff and 5.1% mean Delta%. Meanwhile, LDL-CF resulted in a mean Diff of 8.2 mg/dL and a mean Delta% of 7.6%. LDL-CP also produced better results than LDL-CF, with a mean Diff of 7.0 mg/dL and a mean Delta% of 6.2%.
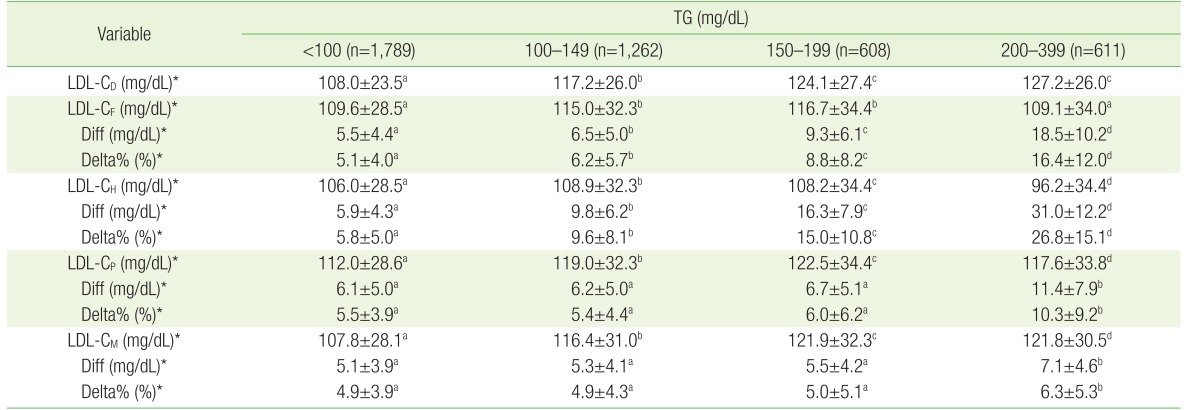
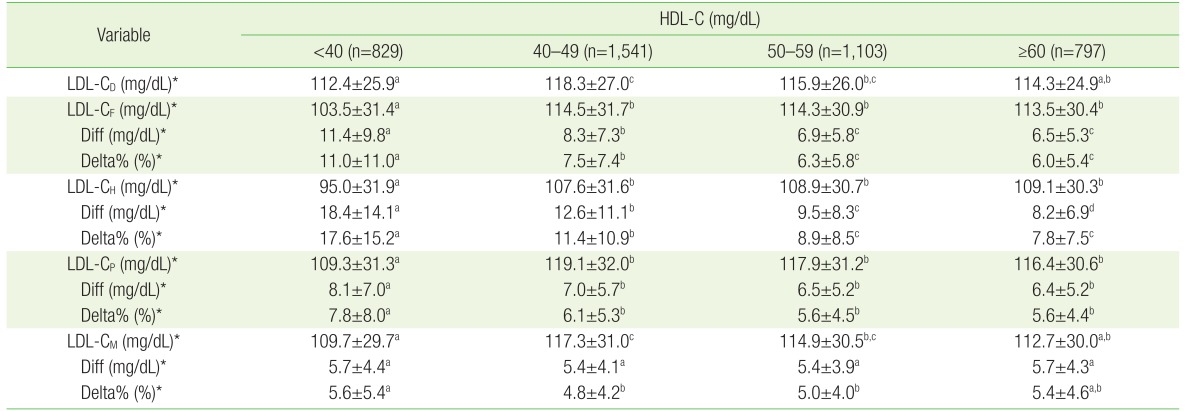
Because all 4 equations use TG and HDL-C levels as variables, TG and HDL-C are both considered to be the most important independent variables. We compared the means and SDs of LDL estimations by TG and HDL-C strata, using one-way ANOVA (Tables 4, 5). As TG increased, the Diff and Delta% of all 4 equations tended to increase, but LDL-CM was shown to be less influenced by TG. The Diff and Delta% of LDL-CF were 5.5 mg/dL and 5.1%, respectively, when the mean TG level was below 100 mg/dL, but they increased drastically as TG increased and reached 18.5 mg/dL and 16.4% when TG was in the range of 200 to 399 mg/dL. The Diff and Delta% of LDL-CM increased gradually; they were 5.1 mg/dL and 4.9%, respectively, when TG was below 100 mg/dL and 7.1 mg/dL and 6.3% when the TG level was between 200 and 399 mg/dL.
Conversely, the Diff and Delta% of all 4 equations tended to decrease as HDL-C increased. The Diff and Delta% of LDL-CF and LDL-CM were not significantly different when HDL-C was high, but were significantly different when HDL was below 40 mg/dL.
Accurate measurement of LDL-C concentration is very important because it is currently the standard target for dyslipidemia treatment. The gold standard for measuring LDL-C level is β-quantification; however, β-quantitation is not suitable for routine use as it is expensive and time-consuming and requires a large serum sample volume, ultracentrifugation, and expensive instruments.
For these reasons, LDL-C concentration is estimated rather than directly measured in many countries, including Korea, especially in nationwide screening examinations. Many attempts have been made to devise more precise equations by modifying Friedewald's method, but the original Friedewald equation is still the most widely employed method for estimating LDL-C concentration in clinical practice, despite limitations.1415161819202122232425) Recently, a new method using the N-strata-specific median TG:VLDL-C ratio was developed which uses TG and non-cholesterol level as the adjustable novel factors instead of a fixed ratio of 5.16) This method is reported to significantly improve LDL-C estimation when compared to Friedewald's equation in the Korean population.17)
We focused on the TG:VLDL-C ratio in Friedewald equation and found that there have been several attempts to modify the equation by varying the ratio. The modified equations were suggested for overcoming several limitations of Friedewald's method.26)
We designed this study to compare equations with TG:VLDL-C ratios of 4, 5, and 6 or with a novel factor from the Martin equation. The aim of this study was to compare the accuracy and consistency of these estimated values with directly measured LDL-C and to identify an optimal equation by calculating cutoff values of TG and HDL-C, which are considered the most important variables in all of the equations.
Our results confirmed those of Martin et al.16) and Lee et al.,17) who stated that the Martin equation offers a significant improvement in LDL-C estimation when compared with Friedewald equation. Our results show that the Martin equation is superior to Friedewald equation in that it produces the least difference and best concordance with directly measured LDL-C of the equations studied. Moreover, both the overestimation and underestimation rates are less than those produced by Friedewald equation; the difference is particularly pronounced in the underestimation rate. This is of particular importance because underestimation is generally considered riskier than overestimation, especially when screening the general population, as underestimation can cause delays in initial treatment. We found that the Martin equation is much less influenced by TG or by HDL-C than Friedewald equation.
It is also important that Puavilai equation using a TG:VLDL-C ratio of 6 seems to be superior to Friedewald's equation. It shows less difference and more concordance and produces a lower underestimation rate than Friedewald equation. Therefore, we suggest that this equation needs to be reevaluated in future studies.
This present study has a few limitations. First, the results may not be generalizable to the overall population, as there may be differences in baseline characteristics between our subjects and the general population. Secondly, instead of calculating a novel factor for the Martin equation, we used the calculator that was suggested by the authors, but there is a possibility that the novel factor for the Korean population is different from what Martin reported. Third, because we limited our study subjects to individuals with a TG concentration less than 400 mg/dL, we cannot say that the Martin equation is applicable to individuals with a TG concentration greater than 400 mg/dL. Furthermore, we did not have access to information regarding patients' use of medications that affect lipid profiles, such as oral hypoglycemic agents, lipid lowering agents, and antihypertensive agents.
However, despite these limitations, this study is meaningful because it addresses the use of the Martin equation in a Korean population and compares the results not only to directly measured LDL-C and Friedewald equation but also to various modifications of Friedewald equation. There have been very few studies to date on the use of the Martin equation in Korean populations.
In conclusion, this study showed that the Martin equation is superior to Friedewald equation in Korean adults. It is also notable that the Puavilai equation, which assumes a TG:VLDL-C ratio of 6, produced better results than Friedewald equation in Korean adults.

CONFLICT OF INTEREST: No potential conflict of interest relevant to this article was reported.

  • 1. National Cholesterol Education Program (NCEP) Expert Panel on Detection, Evaluation, and Treatment of High Blood Cholesterol in Adults (Adult Treatment Panel III). Third report of the National Cholesterol Education Program (NCEP) Expert Panel on Detection, Evaluation, and Treatment of High Blood Cholesterol in Adults (Adult Treatment Panel III) final report. Circulation 2002;106:3143-3421. PMID: 12485966.
  • 2. Scandinavian Simvastatin Survival Study Group. Randomised trial of cholesterol lowering in 4444 patients with coronary heart disease: the Scandinavian Simvastatin Survival Study (4S). Lancet 1994;344:1383-1389. PMID: 7968073.
  • 3. Long-Term Intervention with Pravastatin in Ischaemic Disease (LIPID) Study Group. Prevention of cardiovascular events and death with pravastatin in patients with coronary heart disease and a broad range of initial cholesterol levels. N Engl J Med 1998;339:1349-1357. PMID: 9841303.
  • 4. Ridker PM, Stampfer MJ, Rifai N. Novel risk factors for systemic atherosclerosis: a comparison of C-reactive protein, fibrinogen, homocysteine, lipoprotein(a), and standard cholesterol screening as predictors of peripheral arterial disease. JAMA 2001;285:2481-2485. PMID: 11368701.
  • 5. Friedewald WT, Levy RI, Fredrickson DS. Estimation of the concentration of low-density lipoprotein cholesterol in plasma, without use of the preparative ultracentrifuge. Clin Chem 1972;18:499-502. PMID: 4337382.
  • 6. Lindsey CC, Graham MR, Johnston TP, Kiroff CG, Freshley A. A clinical comparison of calculated versus direct measurement of low-density lipoprotein cholesterol level. Pharmacotherapy 2004;24:167-172. PMID: 14998216.
  • 7. Tighe DA, Ockene IS, Reed G, Nicolosi R. Calculated low density lipoprotein cholesterol levels frequently underestimate directly measured low density lipoprotein cholesterol determinations in patients with serum triglyceride levels < or =4.52 mmol/l: an analysis comparing the LipiDirect magnetic LDL assay with the Friedewald calculation. Clin Chim Acta 2006;365:236-242. PMID: 16259972.
  • 8. Rubies-Prat J, Reverter JL, Senti M, Pedro-Botet J, Salinas I, Lucas A, et al. Calculated low-density lipoprotein cholesterol should not be used for management of lipoprotein abnormalities in patients with diabetes mellitus. Diabetes Care 1993;16:1081-1086. PMID: 8375237.
  • 9. Hirany S, Li D, Jialal I. A more valid measurement of low-density lipoprotein cholesterol in diabetic patients. Am J Med 1997;102:48-53.
  • 10. Johnson R, McNutt P, MacMahon S, Robson R. Use of the Friedewald formula to estimate LDL-cholesterol in patients with chronic renal failure on dialysis. Clin Chem 1997;43:2183-2184. PMID: 9365406.
  • 11. Matas C, Cabre M, La Ville A, Prats E, Joven J, Turner PR, et al. Limitations of the Friedewald formula for estimating low-density lipoprotein cholesterol in alcoholics with liver disease. Clin Chem 1994;40:404-406. PMID: 8131276.
  • 12. Hwang YC, Ahn HY, Jeong IK, Ahn KJ, Chung HY. Optimal range of triglyceride values to estimate serum low density lipoprotein cholesterol concentration in Korean adults: the Korea National Health and Nutrition Examination Survey, 2009. J Korean Med Sci 2012;27:1530-1535. PMID: 23255853.
  • 13. Jang S, Lee J. Friedewald-estimated versus directly measured LDL-cholesterol: KNHANES 2009–2010. J Korea Acad Ind Coop Soc 2015;16:5492-5500.
  • 14. DeLong DM, DeLong ER, Wood PD, Lippel K, Rifkind BM. A comparison of methods for the estimation of plasma low- and very low-density lipoprotein cholesterol: the Lipid Research Clinics Prevalence Study. JAMA 1986;256:2372-2377. PMID: 3464768.
  • 15. Puavilai W, Laorugpongse D, Deerochanawong C, Muthapongthavorn N, Srilert P. The accuracy in using modified Friedewald equation to calculate LDL from non-fast triglyceride: a pilot study. J Med Assoc Thai 2009;92:182-187. PMID: 19253792.
  • 16. Martin SS, Blaha MJ, Elshazly MB, Toth PP, Kwiterovich PO, Blumenthal RS, et al. Comparison of a novel method vs the Friedewald equation for estimating low-density lipoprotein cholesterol levels from the standard lipid profile. JAMA 2013;310:2061-2068. PMID: 24240933.
  • 17. Lee J, Jang S, Son H. Validation of the Martin method for estimating low-density lipoprotein cholesterol levels in Korean adults: findings from the Korea National Health and Nutrition Examination Survey, 2009–2011. PLoS One 2016;11:e0148147. PMID: 26824910.
  • 18. Hatta Y, Nakajima K. Application of Friedewald’s LDL-cholesterol estimation formula to serum lipids in the Japanese population. Jpn Circ J 1986;50:1191-1200. PMID: 3469420.
  • 19. Planella T, Cortes M, Martinez-Bru C, Gonzalez-Sastre F, Ordonez-Llanos J. Calculation of LDL-cholesterol by using apolipoprotein B for classification of nonchylomicronemic dyslipemia. Clin Chem 1997;43:808-815. PMID: 9166235.
  • 20. Hattori Y, Suzuki M, Tsushima M, Yoshida M, Tokunaga Y, Wang Y, et al. Development of approximate formula for LDL-chol, LDL-apo B and LDL-chol/LDL-apo B as indices of hyperapobetalipoproteinemia and small dense LDL. Atherosclerosis 1998;138:289-299. PMID: 9690912.
  • 21. Wagner AM, Zapico E, Bonet R, Perez A, Ordonez-Llanos J. The effect of VLDL particles on the accuracy of a direct LDL-cholesterol method in type 2 diabetic patients. Clin Biochem 2003;36:177-183. PMID: 12726925.
  • 22. Saeidullah M, Rahman M, Khan MH. A simple modification of Friedewald';s equation to calculate low-density lipoprotein cholesterol up to serum triglycerides concentration of 1000 mg/dl. Bangladesh J Med Biochem 2009;2:62-65.
  • 23. Chen Y, Zhang X, Pan B, Jin X, Yao H, Chen B, et al. A modified formula for calculating low-density lipoprotein cholesterol values. Lipids Health Dis 2010;9:52PMID: 20487572.
  • 24. Vujovic A, Kotur-Stevuljevic J, Spasic S, Bujisic N, Martinovic J, Vujovic M, et al. Evaluation of different formulas for LDL-C calculation. Lipids Health Dis 2010;9:27PMID: 20219094.
  • 25. De Cordova CM, de Cordova MM. A new accurate, simple formula for LDL-cholesterol estimation based on directly measured blood lipids from a large cohort. Ann Clin Biochem 2013;50(Pt 1):13-19. PMID: 23108766.
  • 26. Nigam PK. Calculated low density lipoprotein-cholesterol: Friedewald's equation versus other modified formulas: calculated LDL-cholesterol. Int J Life Sci Med Res 2014;4:25-31.
Figure 1

The concordance of estimated LDL-C compared to cutoffs of NCEP-ATP III guideline. LDL-C, low-density lipoprotein cholesterol; NCEP-ATP III, National Cholesterol Education Program Adult Treatment Panel III; LDL-CF, estimated LDL-C level by Friedewald's equation; LDL-CH, estimated LDL-C level by Hatta's equation; LDL-CP, estimated LDL-C level by Puaviali's equation; LDL-CM, estimated LDL-C level by Martin's equation.

kjfm-38-263-g001.jpg
Figure 2

Proportions of percentage difference below 5% and 10% between directly measured and estimated LDL-C. All data are presented as %. LDL-C, low-density lipoprotein cholesterol; LDL-CF, estimated LDL-C level by Friedewald's equation; LDL-CH, estimated LDL-C level by Hatta's equation; LDL-CP, estimated LDL-C level by Puaviali's equation; LDL-CM, estimated LDL-C level by Martin's equation; Delta%, percentage difference between directly measured and estimated LDL-C.

kjfm-38-263-g002.jpg
Table 1

Equations for LDL-C concentration estimation

LDL-C, low-density lipoprotein cholesterol; TC, total cholesterol; HDL-C, high-density lipoprotein cholesterol; TG, triglyceride; LDL-CF, LDL-C level estimated by Friedewald equation; LDL-CH, LDL-C level estimated by Hatta equation; LDL-CM, LDL-C level estimated by Martin equation; LDL-CP, LDL-C level estimated by the Puavilai equation.

kjfm-38-263-i001.jpg
Table 2

Baseline characteristics of the subjects

Values are presented as mean±standard deviation or number (%).

LDL-C, low-density lipoprotein cholesterol; LDL-CD, directly measured LDL-C; LDL-CF, LDL-C level estimated by Friedewald equation; LDL-CH, LDL-C level estimated by the Hatta equation; LDL-CM, LDL-C level estimated by the Martin equation; LDL-CP, LDL-C level estimated by the Puavilai equation.

*P-value <0.05 by the Student t-test.

kjfm-38-263-i002.jpg
Table 3

Differences between LDL-C estimates by each equations and directly-measured LDL-C

Values are presented as mean±standard deviation.

LDL-C, low-density lipoprotein cholesterol; Diff, absolute value of the difference between a direct measurement and an estimation, |(directly measured LDL-C)-(estimated LDL-C)|; Delta%, percentage difference between directly measured and estimated LDL-C, |(directly measured LDL-C)-(estimated LDL-C)|×100/(directly measured LDL-C); LDL-CF, LDL-C estimated level by Friedewald equation; LDL-CH, LDL-C level estimated by the Hatta equation; LDL-CM, LDL-C level estimated by the Martin equation; LDL-CP, LDL-C level estimated by the Puavilai equation.

*By repeated-measures analysis of variance.

kjfm-38-263-i003.jpg
Table 4

Comparison of estimated LDL-C and directly-measured LDL-C by TG levels

Values are presented as mean±standard deviation. The same letters (a ,b, c, d) indicate non-significant differences between groups based on the Scheffe multiple comparison test.

LDL-C, low-density lipoprotein cholesterol; TG, triglyceride; LDL-CD, directly measured LDL-C; LDL-CF, LDL-C level estimated by Friedewald equation; Diff, absolute value of the difference between a direct measurement and an estimation, |(LDL-CD)-(estimated LDL-C)|; Delta%, percentage difference between directly measured and estimated LDL-C, |(LDL-CD)-(estimated LDL-C)|×100/(LDL-CD); LDL-CH, LDL-C level estimated by the Hatta equation; LDL-CM, LDL-C level estimated by the Martin equation; LDL-CP, LDL-C level estimated by the Puavilai equation.

*P-value <0.05 by one-way analysis of variance.

kjfm-38-263-i004.jpg
Table 5

Comparison of estimated and directly-measured LDL-C by HDL-C levels

Values are presented as mean±standard deviation. The same letters (a, b, c, d) indicate non-significant differences between groups based on the Scheffe multiple comparison test.

LDL-C, low-density lipoprotein cholesterol; HDL-C, high-density lipoprotein cholesterol; LDL-CD, directly measured LDL-C; Diff, absolute value of the difference between a direct measurement and an estimation, |(LDL-CD)-(estimated LDL-C)|; Delta%, percentage difference between directly measured and estimated LDL-C, |(LDL-CD)-(estimated LDL-C)|×100/(LDL-CD); LDL-CF, LDL-C level estimated by Friedewald equation; LDL-CH, LDL-C level estimated by the Hatta equation; LDL-CM, LDL-C level estimated by the Martin equation; LDL-CP, LDL-C level estimated by the Puavilai equation.

*P-value <0.05 by one-way analysis of variance.

kjfm-38-263-i005.jpg

Figure & Data

References

    Citations

    Citations to this article as recorded by  
    • Evaluation of current indirect methods for measuring LDL-cholesterol
      Sophia Drobnik, Hubert Scharnagl, Nilesh J. Samani, Peter S. Braund, Christopher P. Nelson, Tim Hollstein, Ursula Kassner, Alexander Dressel, Wolfgang Drobnik, Winfried März
      Clinical Chemistry and Laboratory Medicine (CCLM).2025; 63(6): 1099.     CrossRef
    • Atingimento das Metas de Colesterol LDL em Pacientes com Histórico de Infarto Agudo do Miocárdio: Estudo Transversal do Mundo Real
      Daniel A. Gomes, Mariana Sousa Paiva, Pedro Freitas, Francisco Albuquerque, Maria Rita Lima, Rita Reis Santos, João Presume, Marisa Trabulo, Carlos Aguiar, Jorge Ferreira, António M. Ferreira, Miguel Mendes
      Arquivos Brasileiros de Cardiologia.2024;[Epub]     CrossRef
    • Martin’s formula is best to calculate low-density lipoprotein cholesterol
      Fatima Farheen, Sudha Ambiger, Kamarudin Jaalam, Shivalingappa Javali
      Journal of Laboratory Physicians.2024; 16: 291.     CrossRef
    • Evaluation of 13 Formulae for Calculated LDL-C Using Direct Homogenous Assay in a South Indian Population
      Janani Ramesh, Sathya Selvarajan, Sowmya Krishnamurthy, Sridharan Kopula Sathyamoorthy, Dhivya Senthil Kumar
      The Journal of Applied Laboratory Medicine.2024; 9(5): 963.     CrossRef
    • Comparison of Friedewald, Martin/Hopkins, and Sampson formulae with direct LDL measurement in hyperlipidaemic and normolipidaemic adults in a Turkish population
      Medine Alpdemir, Mehmet Alpdemir, Mehmet Şeneş
      Journal of Medical Biochemistry.2024; 43(5): 671.     CrossRef
    • Comparison of Multiple Equations for Low-Density Lipoprotein Cholesterol Calculation Against the Direct Homogeneous Method
      Rawaa E.K. Alsadig, Adel N. Morsi
      Journal of Lipid and Atherosclerosis.2024; 13(3): 348.     CrossRef
    • Comparison of low-density lipoprotein cholesterol equations in patients with dyslipidaemia receiving cholesterol ester transfer protein inhibition
      Seth S Martin, Marc Ditmarsch, Mark Simmons, Nicholas Alp, Traci Turner, Michael H Davidson, John J P Kastelein
      European Heart Journal - Cardiovascular Pharmacotherapy.2023; 9(2): 148.     CrossRef
    • Evaluation of low-density lipoprotein cholesterol equations by cross-platform assessment of accuracy-based EQA data against SI-traceable reference value
      Hwee Tong Tan, Sharon Yong, Hong Liu, Qinde Liu, Tang Lin Teo, Sunil Kumar Sethi
      Clinical Chemistry and Laboratory Medicine (CCLM).2023; 61(10): 1808.     CrossRef
    • Comparison of Newly Proposed LDL-Cholesterol Estimation Equations
      Yong Whi Jeong, Jun Hyuk Koo, Ji Hye Huh, Young-Jin Kim, Hoyeon Jeong, Eun Young Kim, Dae Ryong Kang
      Journal of Korean Medical Science.2023;[Epub]     CrossRef
    • Assessment of estimated low-density lipoprotein-cholesterol (LDL-c) equations: a systematic review and meta-analysis
      Richard K. D. Ephraim, Emmanuel Ativi, Samuel A. Ashie, Albert Abaka-Yawson, Kwame Osei Darkwah
      Bulletin of the National Research Centre.2023;[Epub]     CrossRef
    • Accuracy of 23 Equations for Estimating LDL Cholesterol in a Clinical Laboratory Database of 5,051,467 Patients
      Christeen Samuel, Jihwan Park, Aparna Sajja, Erin D. Michos, Roger S. Blumenthal, Steven R. Jones, Seth S. Martin
      Global Heart.2023; 18(1): 36.     CrossRef
    • Martin's Formula As the Most Suitable Method for Estimation of Low-Density Lipoprotein Cholesterol in Indian Population
      Fatima Farheen, Sudha Ambiger, Kamarudin Jaalam, Shivalingappa Javali
      Journal of Laboratory Physicians.2023; 15(04): 545.     CrossRef
    • Comparison of Formula-Based Methods with Diverse TGL: VLDL-C Ratio for Calculating LDL-C in a Tertiary Care Hospital
      Maneni V. P. Chowdary
      Journal of Laboratory Physicians.2022; 14(01): 065.     CrossRef
    • A Tale of Two Approaches
      Jean Pierre E Ghayad, Vanda P Barakett-Hamadé
      American Journal of Clinical Pathology.2022; 157(3): 345.     CrossRef
    • Machine learning predictive models of LDL-C in the population of eastern India and its comparison with directly measured and calculated LDL-C
      Anudeep P P, Suchitra Kumari, Aishvarya S Rajasimman, Saurav Nayak, Pooja Priyadarsini
      Annals of Clinical Biochemistry: International Journal of Laboratory Medicine.2022; 59(1): 76.     CrossRef
    • Discordance Between Standard Equations for Determination of LDL Cholesterol in Patients With Atherosclerosis
      Aparna Sajja, Hsin-Fang Li, Kateri J. Spinelli, Roger S. Blumenthal, Salim S. Virani, Seth S. Martin, Ty J. Gluckman
      Journal of the American College of Cardiology.2022; 79(6): 530.     CrossRef
    • A machine learning-based approach for low-density lipoprotein cholesterol calculation using age, and lipid parameters
      Gaowei Fan, Shunli Zhang, Qisheng Wu, Yan Song, Anqi Jia, Di Li, Yuhong Yue, Qingtao Wang
      Clinica Chimica Acta.2022; 535: 53.     CrossRef
    • Indirect calculation of LDL using thirteen equations in Pakistani population
      Madeeha Khan, Qura Tul Ain, Amjad Nawaz, Mohammad Iqbal Khan, Fouzia Sadiq
      Clinica Chimica Acta.2022; 536: 77.     CrossRef
    • Comparison of measured LDL cholesterol with calculated LDL-cholesterol using the Friedewald and Martin-Hopkins formulae in diabetic adults at Charlotte Maxeke Johannesburg Academic Hospital/NHLS Laboratory
      Mogomotsi Dintshi, Ngalulawa Kone, Siyabonga Khoza, Shukri AlSaif
      PLOS ONE.2022; 17(12): e0277981.     CrossRef
    • Remnant cholesterol predicts cardiovascular disease beyond LDL and ApoB: a primary prevention study
      Renato Quispe, Seth Shay Martin, Erin Donelly Michos, Isha Lamba, Roger Scott Blumenthal, Anum Saeed, Joao Lima, Rishi Puri, Sarah Nomura, Michael Tsai, John Wilkins, Christie Mitchell Ballantyne, Stephen Nicholls, Steven Richard Jones, Mohamed Badreldin
      European Heart Journal.2021; 42(42): 4324.     CrossRef
    • Aplicabilidade da fórmula Martin‐Hopkins e comparação com a fórmula Friedewald na estimativa do colesterol LDL na população do estudo e_COR
      Cátia Ferrinho, Ana Catarina Alves, Mafalda Bourbon, Sequeira Duarte
      Revista Portuguesa de Cardiologia.2021; 40(10): 715.     CrossRef
    • Applicability of Martin-Hopkins formula and comparison with Friedewald formula for estimated low-density lipoprotein cholesterol in e_COR study population
      Cátia Ferrinho, Ana Catarina Alves, Mafalda Bourbon, Sequeira Duarte
      Revista Portuguesa de Cardiologia (English Edition).2021; 40(10): 715.     CrossRef
    • Validation of multiple equations for estimating low-density lipoprotein cholesterol levels in Korean adults
      Rihwa Choi, Mi-Jung Park, Youngju Oh, Sung Ho Kim, Sang Gon Lee, Eun Hee Lee
      Lipids in Health and Disease.2021;[Epub]     CrossRef
    • Comparison of Methods to Estimate Low-Density Lipoprotein Cholesterol in Patients With High Triglyceride Levels
      Aparna Sajja, Jihwan Park, Vasanth Sathiyakumar, Bibin Varghese, Vincent A. Pallazola, Francoise A. Marvel, Krishnaji Kulkarni, Alagarraju Muthukumar, Parag H. Joshi, Eugenia Gianos, Benjamin Hirsh, Guy Mintz, Anne Goldberg, Pamela B. Morris, Garima Sharm
      JAMA Network Open.2021; 4(10): e2128817.     CrossRef
    • More accurate LDL-C calculation: Externally validated, guideline endorsed
      Adam J. Brownstein, Seth S. Martin
      Clinica Chimica Acta.2020; 506: 149.     CrossRef
    • Evaluation of Martin's equation for LDL-C estimation in type 2 diabetes mellitus Egyptian patients
      Marwa M. Esawy, Marwa A. Shabana, Mahmoud M. Magdy
      Clinica Chimica Acta.2019; 495: 487.     CrossRef
    • Impact of glucose and lipid markers on the correlation of calculated and enzymatic measured low‐density lipoprotein cholesterol in diabetic patients with coronary artery disease
      Qiu‐Ting Dong, Ying Gao, Na‐Qiong Wu, Yuan‐Lin Guo, Cheng‐Gang Zhu, Sha Li, Hui‐Hui Liu, Ye‐Xuan Cao, Hui‐Wen Zhang, Xi Zhao, Geng Liu, Qian Dong, Jian‐Jun Li
      Journal of Clinical Laboratory Analysis.2018;[Epub]     CrossRef
    • Novel method versus the Friedewald method for estimating low-density lipoprotein cholesterol in determination of the eligibility for statin treatment for primary prevention in the United States
      Doosup Shin, Chandrashekar Bohra, Kullatham Kongpakpaisarn
      Medicine.2018; 97(17): e0612.     CrossRef
    • Comparison of Low-Density Lipoprotein Cholesterol Assessment by Martin/Hopkins Estimation, Friedewald Estimation, and Preparative Ultracentrifugation
      Seth S. Martin, Robert P. Giugliano, Sabina A. Murphy, Scott M. Wasserman, Evan A. Stein, Richard Ceška, José López-Miranda, Borislav Georgiev, Alberto J. Lorenzatti, Matti J. Tikkanen, Peter S. Sever, Anthony C. Keech, Terje R. Pedersen, Marc S. Sabatine
      JAMA Cardiology.2018; 3(8): 749.     CrossRef
    • Calculating LDL cholesterol in familial combined hyperlipidemia: Out with the old, in with the new?
      Seth S. Martin
      Atherosclerosis.2018; 277: 172.     CrossRef
    • Time to Make a Change: Assessing LDL-C Accurately in the Era of Modern Pharmacotherapeutics and Precision Medicine
      Vincent A. Pallazola, Renato Quispe, Mohamed B. Elshazly, Rachit Vakil, Vasanth Sathiyakumar, Steven R. Jones, Seth S. Martin
      Current Cardiovascular Risk Reports.2018;[Epub]     CrossRef

    Download Citation

    Download a citation file in RIS format that can be imported by all major citation management software, including EndNote, ProCite, RefWorks, and Reference Manager.

    Format:

    Include:

    Martin's Equation as the Most Suitable Method for Estimation of Low-Density Lipoprotein Cholesterol Levels in Korean Adults
    Korean J Fam Med. 2017;38(5):263-269.   Published online September 22, 2017
    Download Citation
    Download a citation file in RIS format that can be imported by all major citation management software, including EndNote, ProCite, RefWorks, and Reference Manager.

    Format:
    • RIS — For EndNote, ProCite, RefWorks, and most other reference management software
    • BibTeX — For JabRef, BibDesk, and other BibTeX-specific software
    Include:
    • Citation for the content below
    Martin's Equation as the Most Suitable Method for Estimation of Low-Density Lipoprotein Cholesterol Levels in Korean Adults
    Korean J Fam Med. 2017;38(5):263-269.   Published online September 22, 2017
    Close

    Figure

    • 0
    • 1
    Martin's Equation as the Most Suitable Method for Estimation of Low-Density Lipoprotein Cholesterol Levels in Korean Adults
    Image Image
    Figure 1 The concordance of estimated LDL-C compared to cutoffs of NCEP-ATP III guideline. LDL-C, low-density lipoprotein cholesterol; NCEP-ATP III, National Cholesterol Education Program Adult Treatment Panel III; LDL-CF, estimated LDL-C level by Friedewald's equation; LDL-CH, estimated LDL-C level by Hatta's equation; LDL-CP, estimated LDL-C level by Puaviali's equation; LDL-CM, estimated LDL-C level by Martin's equation.
    Figure 2 Proportions of percentage difference below 5% and 10% between directly measured and estimated LDL-C. All data are presented as %. LDL-C, low-density lipoprotein cholesterol; LDL-CF, estimated LDL-C level by Friedewald's equation; LDL-CH, estimated LDL-C level by Hatta's equation; LDL-CP, estimated LDL-C level by Puaviali's equation; LDL-CM, estimated LDL-C level by Martin's equation; Delta%, percentage difference between directly measured and estimated LDL-C.
    Martin's Equation as the Most Suitable Method for Estimation of Low-Density Lipoprotein Cholesterol Levels in Korean Adults

    Equations for LDL-C concentration estimation

    LDL-C, low-density lipoprotein cholesterol; TC, total cholesterol; HDL-C, high-density lipoprotein cholesterol; TG, triglyceride; LDL-CF, LDL-C level estimated by Friedewald equation; LDL-CH, LDL-C level estimated by Hatta equation; LDL-CM, LDL-C level estimated by Martin equation; LDL-CP, LDL-C level estimated by the Puavilai equation.

    Baseline characteristics of the subjects

    Values are presented as mean±standard deviation or number (%).

    LDL-C, low-density lipoprotein cholesterol; LDL-CD, directly measured LDL-C; LDL-CF, LDL-C level estimated by Friedewald equation; LDL-CH, LDL-C level estimated by the Hatta equation; LDL-CM, LDL-C level estimated by the Martin equation; LDL-CP, LDL-C level estimated by the Puavilai equation.

    *P-value <0.05 by the Student t-test.

    Differences between LDL-C estimates by each equations and directly-measured LDL-C

    Values are presented as mean±standard deviation.

    LDL-C, low-density lipoprotein cholesterol; Diff, absolute value of the difference between a direct measurement and an estimation, |(directly measured LDL-C)-(estimated LDL-C)|; Delta%, percentage difference between directly measured and estimated LDL-C, |(directly measured LDL-C)-(estimated LDL-C)|×100/(directly measured LDL-C); LDL-CF, LDL-C estimated level by Friedewald equation; LDL-CH, LDL-C level estimated by the Hatta equation; LDL-CM, LDL-C level estimated by the Martin equation; LDL-CP, LDL-C level estimated by the Puavilai equation.

    *By repeated-measures analysis of variance.

    Comparison of estimated LDL-C and directly-measured LDL-C by TG levels

    Values are presented as mean±standard deviation. The same letters (a ,b, c, d) indicate non-significant differences between groups based on the Scheffe multiple comparison test.

    LDL-C, low-density lipoprotein cholesterol; TG, triglyceride; LDL-CD, directly measured LDL-C; LDL-CF, LDL-C level estimated by Friedewald equation; Diff, absolute value of the difference between a direct measurement and an estimation, |(LDL-CD)-(estimated LDL-C)|; Delta%, percentage difference between directly measured and estimated LDL-C, |(LDL-CD)-(estimated LDL-C)|×100/(LDL-CD); LDL-CH, LDL-C level estimated by the Hatta equation; LDL-CM, LDL-C level estimated by the Martin equation; LDL-CP, LDL-C level estimated by the Puavilai equation.

    *P-value <0.05 by one-way analysis of variance.

    Comparison of estimated and directly-measured LDL-C by HDL-C levels

    Values are presented as mean±standard deviation. The same letters (a, b, c, d) indicate non-significant differences between groups based on the Scheffe multiple comparison test.

    LDL-C, low-density lipoprotein cholesterol; HDL-C, high-density lipoprotein cholesterol; LDL-CD, directly measured LDL-C; Diff, absolute value of the difference between a direct measurement and an estimation, |(LDL-CD)-(estimated LDL-C)|; Delta%, percentage difference between directly measured and estimated LDL-C, |(LDL-CD)-(estimated LDL-C)|×100/(LDL-CD); LDL-CF, LDL-C level estimated by Friedewald equation; LDL-CH, LDL-C level estimated by the Hatta equation; LDL-CM, LDL-C level estimated by the Martin equation; LDL-CP, LDL-C level estimated by the Puavilai equation.

    *P-value <0.05 by one-way analysis of variance.

    Table 1 Equations for LDL-C concentration estimation

    LDL-C, low-density lipoprotein cholesterol; TC, total cholesterol; HDL-C, high-density lipoprotein cholesterol; TG, triglyceride; LDL-CF, LDL-C level estimated by Friedewald equation; LDL-CH, LDL-C level estimated by Hatta equation; LDL-CM, LDL-C level estimated by Martin equation; LDL-CP, LDL-C level estimated by the Puavilai equation.

    Table 2 Baseline characteristics of the subjects

    Values are presented as mean±standard deviation or number (%).

    LDL-C, low-density lipoprotein cholesterol; LDL-CD, directly measured LDL-C; LDL-CF, LDL-C level estimated by Friedewald equation; LDL-CH, LDL-C level estimated by the Hatta equation; LDL-CM, LDL-C level estimated by the Martin equation; LDL-CP, LDL-C level estimated by the Puavilai equation.

    *P-value <0.05 by the Student t-test.

    Table 3 Differences between LDL-C estimates by each equations and directly-measured LDL-C

    Values are presented as mean±standard deviation.

    LDL-C, low-density lipoprotein cholesterol; Diff, absolute value of the difference between a direct measurement and an estimation, |(directly measured LDL-C)-(estimated LDL-C)|; Delta%, percentage difference between directly measured and estimated LDL-C, |(directly measured LDL-C)-(estimated LDL-C)|×100/(directly measured LDL-C); LDL-CF, LDL-C estimated level by Friedewald equation; LDL-CH, LDL-C level estimated by the Hatta equation; LDL-CM, LDL-C level estimated by the Martin equation; LDL-CP, LDL-C level estimated by the Puavilai equation.

    *By repeated-measures analysis of variance.

    Table 4 Comparison of estimated LDL-C and directly-measured LDL-C by TG levels

    Values are presented as mean±standard deviation. The same letters (a ,b, c, d) indicate non-significant differences between groups based on the Scheffe multiple comparison test.

    LDL-C, low-density lipoprotein cholesterol; TG, triglyceride; LDL-CD, directly measured LDL-C; LDL-CF, LDL-C level estimated by Friedewald equation; Diff, absolute value of the difference between a direct measurement and an estimation, |(LDL-CD)-(estimated LDL-C)|; Delta%, percentage difference between directly measured and estimated LDL-C, |(LDL-CD)-(estimated LDL-C)|×100/(LDL-CD); LDL-CH, LDL-C level estimated by the Hatta equation; LDL-CM, LDL-C level estimated by the Martin equation; LDL-CP, LDL-C level estimated by the Puavilai equation.

    *P-value <0.05 by one-way analysis of variance.

    Table 5 Comparison of estimated and directly-measured LDL-C by HDL-C levels

    Values are presented as mean±standard deviation. The same letters (a, b, c, d) indicate non-significant differences between groups based on the Scheffe multiple comparison test.

    LDL-C, low-density lipoprotein cholesterol; HDL-C, high-density lipoprotein cholesterol; LDL-CD, directly measured LDL-C; Diff, absolute value of the difference between a direct measurement and an estimation, |(LDL-CD)-(estimated LDL-C)|; Delta%, percentage difference between directly measured and estimated LDL-C, |(LDL-CD)-(estimated LDL-C)|×100/(LDL-CD); LDL-CF, LDL-C level estimated by Friedewald equation; LDL-CH, LDL-C level estimated by the Hatta equation; LDL-CM, LDL-C level estimated by the Martin equation; LDL-CP, LDL-C level estimated by the Puavilai equation.

    *P-value <0.05 by one-way analysis of variance.

    TOP