Diabetes Care of Non-obese Korean Americans: Considerable Room for Improvement
Article information

Abstract
Background
Family doctors are increasingly managing the diabetes care of Korean-Americans. Little is known about the prevalence of diabetes among non-obese Korean-Americans, or the extent to which they receive timely and appropriate diabetes care. The purpose of this investigation is to: (1) identify the prevalence of diabetes and to determine the adjusted odds of diabetes among non-obese Korean-Americans compared to non-Hispanic White (NHW) Americans, (2) examine the factors associated with having diabetes in a large sample of non-obese Korean-Americans, and (3) determine the prevalence and adjusted odds of optimal frequency of eye care, foot care and A1C blood glucose level monitoring among non-obese Korean-Americans with diabetes in comparison to NHWs with diabetes.
Methods
Secondary analysis of population-based data from the combined 2007, 2009, and 2011 adult California Health Interview Survey. The sample included 74,361 respondents with body mass index (BMI) <30 kg/m2 (referred to as ‘non-obese BMI’), of whom 2,289 were Korean-Americans and 72,072 were NHWs, and 4,576 had diabetes.
Results
The prevalence and adjusted odds of diabetes among non-obese Korean-Americans are significantly higher than among their NHW peers. More than 90% of Korean-Americans with diabetes were non-obese. NHWs had substantially higher odds of having optimal frequency of eye care, foot care and A1C glucose level monitoring, even after adjusting for insulin dependence, sex, age, education, income, and BMI.
Conclusion
Non-obese Korean-Americans are at higher risk for diabetes and are much less likely to receive optimal diabetes care in comparison to NHWs. Targeted outreach is necessary.
INTRODUCTION
Family doctors are key providers of health care to diabetes patients in the United States. Asian-Americans are the fastest growing racial group, comprising approximately 5.4% of the total US population in 2014 [1,2], and, thus, family doctors increasingly provide care for Asian-American patients. However, little is known about the health of specific Asian-American ethnicities compared to other ethnic American populations, due to their underrepresentation in most epidemiological studies [3]. Studies including Korean-Americans typically combine them with other Asian-American groups and Pacific Islanders, despite substantial diversity across these ethnicities [4]. This leads to an assumption of homogeneity, thus ignoring the health care needs of the specific ethnic subgroups. Hence, it is necessary to disaggregate such diverse groups in population-based studies to develop and improve upon prevention and intervention approaches, in order to address the needs of specific subgroups, such as Korean-Americans.
Korean-Americans comprise the fourth largest Asian subgroup, with about 1.1 million individuals residing in the United States as of 2013 [5,6]. Recent research suggests that there are considerable differences in disease prevalence and risk factors among Korean-Americans compared to non-Hispanic Whites and other Asian subgroups. For example, Koreans have been shown to have a higher incidence of stomach cancer than all other Asian-Americans [7]. Compared to older adults from other ethnic groups, older Korean-Americans have a higher prevalence of depression, anxiety, and cardiovascular disease risk factors, including high blood pressure, high blood cholesterol, diabetes, being overweight, and smoking [8]. Moreover, the prevalence of certain chronic illnesses, including digestive disease, respiratory disease and thyroid disease, have been shown to vary within the Korean population, depending on gender and the length of residence in the United States [9].
Diabetes is the fourth leading cause of death in Korea, and has been shown to be more prevalent among Korean-Americans (16.8% in men, 12.6% in women) compared to non-Hispanic Whites (8.6% in men, 5.9% in women) after adjusting for age and body mass index (BMI) [10]. Among the elderly population, the prevalence of diabetes in Korean-Americans (18.1%) is higher than non-Hispanic Whites (12.4%), but lower than that of blacks (19.5%) and Hispanics (21.8%) [8].
The high rates of diabetes among Korean-Americans can be explained by several physiological, social, and psychological factors. One of the main issues is that Korean-Americans have a higher rate of overweight and obesity than other Asian ethnic groups [11]. One study showed that over one-third of Korean-Americans had a BMI ≥23.0 kg/m2 [11]. However, even non-obese Korean-Americans appear to be quite vulnerable to diabetes. Secondly, the prevalence of smoking in Korean men is higher than in other Asian-American subgroups [12]. Smoking can lead to high insulin resistance and low insulin secretion, and subsequently, diabetes [12]. Another factor placing Korean-Americans at risk might be lack of exercise and low rates of routine physical examination [13].
The objectives of this study are to (1) identify the prevalence of diabetes among non-obese Korean-Americans and to determine the odds of diabetes among non-obese Korean-Americans compared to their non-Hispanic White peers when major risk factors are taken into account, (2) examine the risk factors associated with having diabetes in a large sample of non-obese Korean-Americans, and (3) determine the prevalence and adjusted odds of optimal frequency of eye care, foot care, A1C blood glucose level monitoring and confidence in managing diabetes among non-obese Korean-Americans with diabetes in comparison to non-Hispanic Whites with diabetes. The findings of this study will provide new insight into the prevention, screening and management of diabetes in Korean-Americans, so that public health promotions can be effectively targeted to this population.
METHODS
1. Data Source
Data were obtained from the combined 2007, 2009, and 2011 waves of the adult California Health Interview Survey (CHIS). The data is publicly available, and did not require IRB approval because there was no interaction of researcher in this study with subjects. Using a multistage sampling design, the CHIS collected survey data from respondents using random-digit-dialing with landline and cellular phone samples for a representative sample of Californian adults. Interviews were conducted in five languages: English, Spanish, Chinese (Mandarin and Cantonese dialects), Vietnamese, and Korean.
2. Sample
The total combined sample of adult respondents over 18 years of age from the 2007, 2009, and 2011 waves of CHIS data included 2,380 Korean-Americans and 92,703 non-Hispanic Whites. Approximately 7.2% of Korean-Americans and 6.7% of non-Hispanic Whites from the full sample had diabetes. More than nine in 10 of Korean-Americans (91.9%) with diabetes were in the non-obese BMI range (i.e., BMI <30 kg/m2). This contrasted with 51.3% of non-Hispanic Whites with diabetes falling within that same BMI range.
For this manuscript, the final study sample included 74,361 respondents with BMI ≤29.99 (hereafter referred to as ‘non-obese BMI’), of whom 2,289 were Korean-Americans and 72,072 were non-Hispanic Whites.
3. Measures
1) Identification of individuals with BMI <30 kg/m2
Individuals were asked during data collection in the CHIS survey, “How tall are you without shoes?” to determine height, and “How much do you weigh without shoes?” to determine weight. The BMI was then calculated by dividing weight in kilograms by the square of height in meters.
2) Identification of individuals with diabetes
A question regarding diabetes was found in the CHIS survey: “Other than during pregnancy, has a doctor ever told you that you have diabetes or sugar diabetes?”
3) Demographic characteristics
The following demographic variables were examined: (1) Korean vs. non-Hispanic White ethnicity; (2) sex; (3) age (18 years and over); (4) attainment of post-secondary degree; (5) poverty (0 to 99% of federal poverty level versus 100% or more)—this variable takes into account household income in the context of household composition; and (6) immigrant status (foreign-born or not).
4) Identification of health-related variables
With respect to fruit and vegetable intake, respondents were asked, “During the past month, how many times did you eat fruit? Do not count juices,” and “During the past month, how many times did you eat vegetables like green salad, green beans, or potatoes? Do not include fried potatoes.” Responses to these two questions were used to calculate daily fruit and vegetable intake. Three categories were created with ‘0 to 1,’ ‘more than 1, less than 5,’ and ‘5 or more’ servings of fruits or vegetables per day. With respect to cigarette smoking, respondents were asked “Altogether, have you smoked at least 100 or more cigarettes in your entire lifetime?” (coded ‘never’ versus ‘ever’).
Due to changes to questions between the waves, we created a new variable of ‘moderate physical activity’ which was defined as follows: from the 2007 dataset, the variable was constructed from the question “During the last 7 days, did you do any moderate physical activities in your free time for at least 10 minutes?” From the 2009 and 2011 datasets, we used the question “Sometimes you may walk for fun, relaxation, exercise, or to walk the dog. During the past 7 days, did you walk for at least 10 minutes for any of these reasons?” (coded yes versus no). BMI was coded into two categories to control for differences in body weight profiles: BMI < 25 kg/m2, and BMI 25 to 29.99 kg/m2.
5) Diabetes health management variables
The following diabetes health management variables were examined: (1) regular eye examinations; (2) regular foot examinations; (3) regular hemoglobin A1C blood glucose level checks; and (4) confidence in managing diabetes. With respect to eye examinations, respondents were asked, “When was the last time you had an eye exam in which the pupils were dilated?” Responses of “within the past month,” “1 to 12 months ago,” and “1 to 2 years ago” were coded as ‘optimal eye care,’ and “more than 2 years” coded as ‘sub-optimal eye care.’ With respect to foot examinations, respondents were asked, “About how many times in the last 12 months has a doctor checked your feet for any sores or irritations?” Responses between 1 and 52 were coded as ‘optimal foot examination,’ and 0 coded as ‘sub-optimal.’ With respect to hemoglobin A1C blood glucose checks, respondents were asked, “About how many times in the last 12 months has a doctor or other health professional checked you for hemoglobin “A one C?” Responses of 2 or more times a year were coded as ‘optimal,’ and fewer than 2 times as ‘sub-optimal.’ With respect to confidence in managing diabetes, respondents were asked, “How confident are you that you can control and manage your diabetes?” Responses of “very confident” and “somewhat confident” were coded as ‘confident,’ and “not too confident” and “not at all confident” were coded as ‘not confident.’ With respect to insulin dependence, respondents were asked, “Are you now taking insulin?” Responses of “yes” were coded as ‘insulin-dependent,’ and “no” coded as ‘not insulin-dependent.’
4. Data Analyses
Chi-square tests were used to compare non-obese Korean-Americans and non-Hispanic Whites with respect to the prevalence of diabetes (objective 1a) and a range of sociodemographic characteristics and health behaviors. A multivariate logistic regression analysis of diabetes status was conducted to determine the odds of diabetes for non-obese Korean-Americans in comparison to non-Hispanic Whites from California (objective 1b).
In the Korean subsample, chi-square tests were conducted on those with and without diabetes (objective 2a). Logistic regression analyses of diabetes status were conducted among non-obese Korean-Americans, which controlled for socio-demographic characteristics and health behaviors (objective 2b).
Further chi-square tests and logistic regression analyses were conducted for non-obese Korean-Americans and non-Hispanic Whites who have diabetes, with respect to health management behaviors, such as regular eye examinations, foot examinations, A1C glucose levels, and confidence in managing diabetes (objective 3). This set of analyses controlled for insulin use, socio-demographic characteristics, and overweight status.
Survey design weights using jackknife replication techniques were employed in the calculation of percentages, standard errors, and odds ratios (ORs) to adjust for the probability of selection. A final household weight and 240 replicate weights were created from the 2007, 2009, and 2011 data, using procedures outlined on the CHIS website [6]. All analyses within this article were performed using Stata ver. 13.0 (Stata-Corp., College Station, TX, USA). All sample sizes are provided in their unweighted form.
RESULTS
1. Prevalence and Adjusted Odds of Diabetes in the Study Population
As shown in Table 1, among Californians aged 50 and over with non-obese BMI, the prevalence of diabetes was higher for Korean-Americans compared to non-Hispanic Whites (6.8% versus 4.3%). The demographic profiles of Korean-Americans and non-Hispanic Whites were fairly similar in this sample, except that Korean-Americans, on average, were younger, with a higher proportion of females, more than twice as likely to live in poverty, ate fewer fruits and vegetables, smoked less, exercised less, and had lower BMIs compared to their non-Hispanic White counterparts.
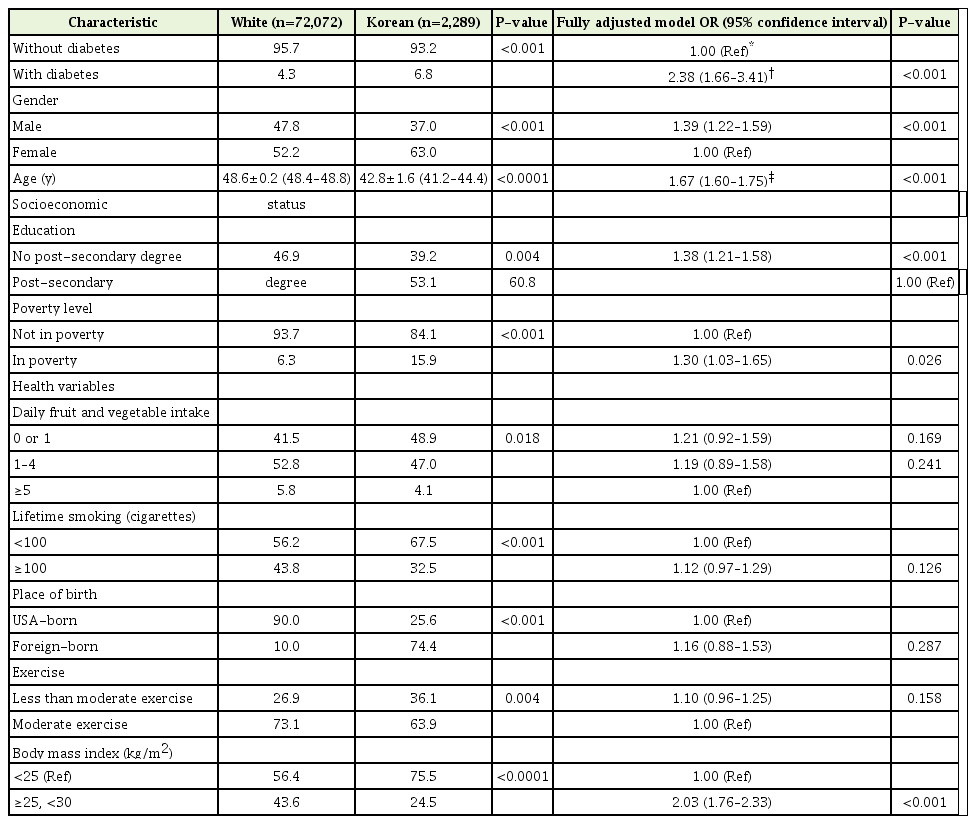
Descriptive variables characteristic and ORs of having diabetes in non-obese Korean and White cohorts from the 2007, 2009, and 2011 California Health Interview Survey (n=74,361)
The adjusted OR of diabetes for Korean-Americans, compared to non-Hispanic Whites was 2.38, when controlling for demographics (OR, 2.38; 95% confidence interval [CI], 1.66–3.41) (Table 1). Males had 39% higher OR of diabetes in this non-obese BMI group (OR, 1.39; 95% CI, 1.22–1.59). Each increase of a decade in age was associated with a 67% increase in the OR of diabetes (OR, 1.67; 95% CI, 1.60–1.75). Those without a college degree had 38% higher OR of diabetes (OR, 1.38; 95% CI, 1.21–1.58). Living in poverty was associated with a 30% increase in the OR of diabetes (OR, 1.30; 95% CI, 1.03–1.65). Those with a BMI from 25 to 29.99 had more than twice the OR of diabetes, compared to those with a BMI of less than of 25 (OR, 2.03; 95% CI, 1.76–2.33). Fruit and vegetable consumption, smoking history, and level of physical activity had no statistically significant effect on the OR of diabetes for those with non-obese BMI.
2. Risk Factors Associated with Having Diabetes
In the bivariate analyses restricted to only non-obese Korean-Americans (Table 2), there was a higher prevalence of diabetes among older respondents, those without a post-secondary degree, those who were foreign-born, and those who had ever smoked. We found the following factors to be associated with a higher prevalence of diabetes among non-obese Korean-Americans: older age (OR, 1.99; 95% CI, 1.65–2.40) and foreign-born status (OR, 13.06; 95% CI, 1.88–90.66) (Table 2). No other variables in the analysis were significantly associated with higher OR of diabetes.

Descriptive characteristics and ORs of having diabetes of non-obese Korean-American Adults with and without diabetes (n=2,289)
3. Prevalence and Adjusted Odds of Diabetes Management Behaviors
Non-obese non-Hispanic White patients with diabetes were much more likely to display optimal frequency of diabetes health management behaviors than Korean-American diabetic patients. The ethnic differences were particularly pronounced in diabetic patients who were not insulin-dependent (Tables 3, 4). Korean-Americans were at a marked disadvantage even after controlling for insulin dependence, demographic variables, and overweight status (Table 2). Non-Hispanic Whites had three times the OR of having optimal eye examinations (OR, 3.50; 95% CI, 2.06–5.94) (Table 2), 6 times the OR of having optimal foot examinations (OR, 6.64; 95% CI, 3.89–11.32) (Table 2), twice the OR of having optimal hemoglobin A1C glucose checks (OR, 2.04; 95% CI, 1.18–3.55) (Table 2), and 3 and a half times the OR of being confident in controlling and managing their diabetes (OR, 3.66; 95% CI, 1.59–8.40) (Table 2).
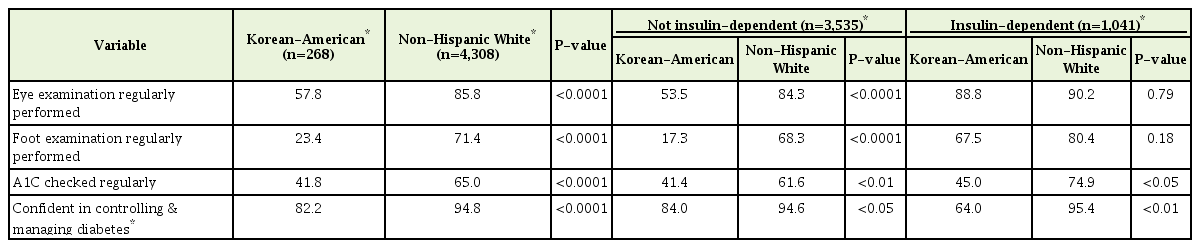
Descriptive variables characteristic of non-obese Korean American and non-Hispanic cohorts, insulin-dependent and non-dependent
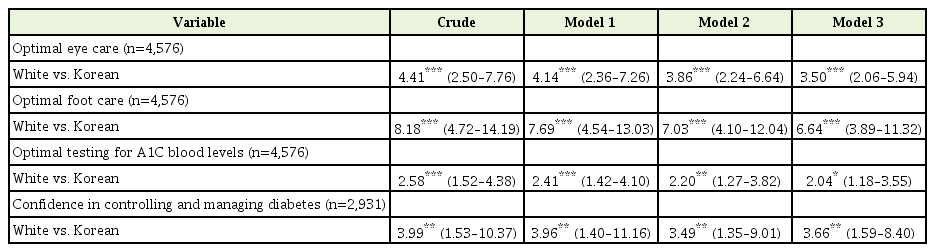
Logistic regression of diabetes management variables for non-Hispanic White vs. Korean-American adults with BMI <30 kg/m2
Those who were dependent on insulin had 254% greater OR to have optimal eye examinations (OR, 2.54; 95% CI, 1.48–4.36), 234% greater OR to have optimal foot examinations (OR, 2.34; 95% CI, 1.70–3.23), and almost twice the OR to have optimal hemoglobin A1C checks (OR, 1.95; 95% CI, 1.41–2.70).
Age by decade was associated with increased OR of having optimal eye examinations (OR, 1.38; 95% CI, 1.21–1.57) and optimal foot examinations (OR, 1.13; 95% CI, 1.02–1.25), but not hemoglobin A1C checks or confidence in managing diabetes. Men had 29% greater OR to of having optimal foot examinations (OR, 1.29; 95% CI, 1.01–1.66); however, gender had no effect on eye examinations and A1C checks. College graduates had greater OR of having optimal eye examinations (OR, 1.78; 95% CI, 1.24–2.57) and A1C checks (OR, 1.58; 95% CI, 1.23–2.02), but no association was found for optimal foot examinations. Those above the poverty line had higher OR of having optimal foot examinations (OR, 1.70; 95% CI, 1.12–2.56) and A1C checks (OR, 1.81; 95% CI, 1.21–2.70), but no association was found for eye examinations. BMI of 25–29.99 kg/m2 was not associated with optimal eye examinations, foot examinations, and A1C checks.
Only one in five Korean-Americans (21%) had a diabetes care plan developed by their medical providers in comparison to 86% of non-Hispanic Whites. Only 82% of Korean-Americans were confident in managing diabetes as compared to 95% of non-Hispanic Whites.
DISCUSSION
In the Korean-American community, the vast majority (92%) of those with diabetes are not obese, which underlines how essential it is for family doctors to be screening their non-obese Korean-American patients for diabetes. The findings of this representative community study indicate that the prevalence and adjusted odds of diabetes among non-obese Korean-Americans are significantly higher than among their non-Hispanic White peers, even when major risk factors are taken into account. Among non-obese Korean-Americans, older age and having been born in Korea were associated with higher odds of diabetes. Non-obese non-Hispanic White Americans had substantially higher odds of having optimal frequency of eye care, foot care, and A1C glucose level monitoring than Korean-Americans, even after adjusting for insulin dependence, sex, age, education, income, and BMI.
1. Prevalence of Diabetes Among Non-obese Korean-Americans
Our results suggest that the prevalence of diabetes among non-obese Korean-Americans is significantly higher than that of non-Hispanic Whites. This is consistent with findings from other epidemiological studies exploring ethnic differences in diabetes prevalence among Asian-American subgroups and Caucasians [8,14]. However, the prevalence of diabetes among our community sample of non-obese Koreans and non-Hispanic Whites (6.8% and 4.3%, respectively), were lower than that found in another prospective cohort study including participants across the whole BMI spectrum (9.9% and 7.3%, respectively) [14]. We attribute the relatively low prevalence in our current analysis to the exclusion of obese participants from the study sample, and the strong association between obesity and the development of diabetes.
Logistic regression analyses confirmed that non-obese Korean-Americans had higher odds of diabetes compared to non-obese non-Hispanic Whites when many of the known risk factors for diabetes were taken into account (i.e., age, poverty status, gender, education, and overweight status). Hence, it appears that there might be other factors specific to the Korean-American population that might be influencing the relatively high prevalence of diabetes, such as higher rice consumption and/or central adiposity.
2. Factors Associated with Higher Prevalence of Diabetes
We have found the following factors to be associated with a higher prevalence of diabetes among non-obese Korean-Americans: older age, low educational status (having no post-secondary degree), poverty, and cigarette smoking. Older age has been found to be a risk factor of diabetes in the general population [15]. Low socioeconomic status has been found to be associated with high incidence of diabetes even in the presence of universal health coverage [16]. Hazardous home environments along with stress and unhealthy behaviors might be predisposing factors contributing to the higher incidence of diabetes among those living in poverty [16]. Consistent with our results, a recent study found that women and men living in households where the highest educational attainments were lower than secondary school were at higher risk of developing diabetes [17]. Cigarette smoking has been shown to be a modifiable risk factor contributing to the development of diabetes by having a direct toxic effect on pancreatic tissue, and by altering fat distribution associated with insulin resistance [18].
3. Diabetes Care Management Among Korean-Americans
Family doctors can play an important role in improving the management of diabetes among their Korean-American patients. The level of adherence to optimal screening is particularly poor among Korean-Americans with diabetes who are not insulin-dependent; of this group, 83% had never checked their feet for sores or irritation as compared to 32% of non-Hispanic Whites. This is consistent with a recent study which reports Korean-Americans as having fewer self-administered feet checks and glucose checks compared to Hispanics and blacks [19]. Additionally, this study also reports Korean-Americans as being significantly less likely to participate in any diabetes management behaviors and practices [19].
Only one in five Korean-Americans with diabetes had a diabetes care plan developed by their medical providers (22%), so it is not surprising that only a similar low percentage (23%) felt confident in managing their diabetes. We can only hypothesize why there is such inadequate adherence to medical guidelines for optimal diabetes care. Traditional diabetes management strategies in America are often perceived to be culturally insensitive by ethnic minorities, and thus can be perceived to be largely ineffective [20]. Access to diabetes management programs remains difficult for ethnic minorities, due to financial constraints and possible language barriers [20]. This is highly relevant for Korean-Americans, as about two-thirds of Korean immigrants are first generation, among whom about 90% are reported to experience language barriers [20]. Furthermore, Korean-Americans are most likely to be medically uninsured among other Asian subgroups, further limiting their ability to access the healthcare system and have a diabetes care plan developed with a medical professional [20].
The findings of this study indicate that more outreach is needed for diabetes prevention and management in non-obese Korean-Americans, who are an underserved population. Health care policies can address this issue by allocating resources for culturally sensitive and linguistically appropriate outreach efforts, to increase insurance enrollment and regular check-ups. Health practitioners who work with Korean-Americans can conduct more frequent screening for diabetes, with particular attention to those who are non-obese. Evidence-based diabetes management programs should be culturally-adapted for Korean-Americans, in order to increase enrollment, retention, and successful completion.
Notes
No potential conflict of interest relevant to this article was reported.