Home Blood Pressure Monitoring Has Similar Effects on Office Blood Pressure and Medication Compliance as Usual Care
Article information

Abstract
Background
Home blood pressure monitoring is recommended to achieve controlled blood pressure. This study evaluated home blood pressure monitoring-improvement of office blood pressure control and treatment compliance among hypertensive patients.
Methods
A randomized controlled trial was conducted from December 2014 to April 2015. The home blood pressure monitoring group used an automatic blood pressure device along with standard hypertension outpatient care. Patients were seen at baseline and after 2 months. Medication adherence was measured using a novel validated Medication Adherence Scale (MAS) questionnaire. Office blood pressure and MAS were recorded at both visits. The primary outcomes included evaluation of mean office blood pressure and MAS within groups and between groups at baseline and after 2 months.
Results
Mean changes in systolic blood pressure (SBP) and diastolic blood pressure (DBP) and MAS differed significantly within groups. The home blood pressure monitoring group showed greater mean changes (SBP 17.6 mm Hg, DBP 9.5 mm Hg, MAS 1.5 vs. SBP 14.3 mm Hg, DBP 6.4 mm Hg, MAS 1.3), while between group comparisons showed no significant differences across all variables. The adjusted mean difference for mean SBP was 4.74 (95% confidence interval [CI], -0.65 to 10.13 mm Hg; P=0.084), mean DBP was 1.41 (95% CI, -2.01 to 4.82 mm Hg; P=0.415), and mean MAS was 0.05 (95% CI, -0.29 to 0.40 mm Hg; P=0.768).
Conclusion
Short-term home blood pressure monitoring significantly reduced office blood pressure and improved medication adherence, albeit similarly to standard care.
INTRODUCTION
The prevalence of hypertension around the world has doubled from 600 million in 1980 to 1 billion in 2008 [1]. In 2008, 40% of all adults aged above 25 years exhibited hypertension [1]. In Malaysia, the prevalence of hypertension in individuals aged over 18 years was 30.3% and of these, two-thirds did not achieve blood pressure (BP) control [2]. A similar phenomenon was observed in the United Kingdom [3]. In the United States also, the condition remains poor, with approximately only 30% of patients categorized with controlled BP despite treatment [4]. In another Asian country, Japan, only 42% of patients had their office BP controlled [5]. Uncontrolled BP gives rise to hypertension-associated morbidity and mortality, which contributes to the escalating costs of health care around the globe [6].
Additional efforts should be adopted to reduce the prevalence of hypertension and to increase the number of patients with controlled BP. Apart from increasing awareness, compliance with medications, or practicing a healthy lifestyle, using a BP monitoring device outside clinic visits had been postulated as a potential option. A 24-hour ambulatory BP monitoring (ABPM) or home BP monitoring (HBPM) device can be used for this purpose [7,8]. However, the clinical use of ABPM is limited in view of its cost, inconvenience, and limited availability. Thus, HBPM can be an alternative to ABPM and may have similar prognostic value [8,9].
HBPM was introduced in the 1930s and its use now is gaining acceptance among hypertensive patients [9]. In developed countries, 70% of hypertensive patients regularly assess their BP at home [7]. In Malaysia, which is a developing nation, Beth et al. [10] in 2012 found that only 32.3% of hypertensive patients practice HBPM. HBPM has been shown in a systematic review to diagnose uncontrolled hypertension better than office BP control as it can detect masked hypertension and random BP fluctuations throughout the day [11]. HBPM can quickly assess the patient’s response to treatment until their next follow-up appointment in the clinic. HBPM may also improve office BP control by improving the patient’s compliance with treatment [11]. Patients who practice HBPM are more aware of their BP level, which may lead to increased awareness of their illness and subsequently improve their health seeking behaviors [12-14].
Previous studies have shown that patients that practice HBPM have a better office BP when returning for follow-up [12,15,16]. Cappuccio et al. [16] in 2004 demonstrated that there was an increment in the proportion of patients that achieved BP control among those using HBPM rather than standard BP monitoring. Although office systolic BP (SBP) and diastolic BP (DBP) decreased by only 2 mm Hg, this small reduction was significant and may contribute to an overall reduction in hypertensive related complications [17]. In another systematic review and meta-analysis of 37 randomized controlled trials (RCT), patients in the HBPM group showed an improvement in both SBP and DBP (2.63 mm Hg and 1.68 mm Hg, respectively) compared to the control group [18]. In another study by McManus et al. [12] in 2008, SBP decreased by 17.6 mm Hg in the intervention group and 12.2 mm Hg in the control group, with a difference in between groups of 5.4 mm Hg. However, Logan et al. [15] in 2012, found that HBPM alone did not improve office BP but needed to be combined with other measures to improve the office BP outcome. A meta-analysis by Uhlig et al. [18] in 2013 showed that HBPM improved office BP at the 6-month follow-up but not at 12 months.
Adherence to anti-hypertensive medications is crucial to achieve controlled BP but many hypertensive patients typically take only about half of their prescribed doses and many eventually stop their medications entirely [19]. Ramli et al. [20] found that 56% of the study subjects taking anti-hypertensive, anti-diabetic, or anti-asthmatic drugs were noncompliant with their medications. Another study in an outpatient clinic setting in Malaysia showed that 51.3% of patients interviewed had poor adherence to anti-hypertensive medications [21]. Considering the above, HBPM has been advocated as a worthy strategy to tackle and improve the non-adherence issue. However, evidence supporting the effectiveness of HBPM in improving medication adherence among hypertensive patients is limited [4]. A systematic review of eleven trilas showed that there was a significant improvement in medication adherence attributed to the intervention [4]. It has been postulated that patients will show better compliance with their treatment as they are actively involved in their hypertension care [22]. Similarly, Fletcher et al. [23] in 2015 showed that patients who monitor their BP at home, exhibit better BP control and higher compliance with treatment.
This study was conducted to generate local data to assess the effect of HBPM on office BP and compliance towards medications. Furthermore, few studies have investigated the independent effects of HBPM alone and medication adherence in the primary care clinic, as in our previous study [4], as previous studies have used complex interventions involving the use of HBPM in combination with other adherence-enhancing strategies such as patient counseling by nurses, pharmacists, or a telephone-linked system; patient education; and the use of timed medication reminders [4].
METHODS
1. Study Design and Participants
This was a randomized, non-blinded two-arm parallel controlled trial performed in a primary care clinic at the Universiti Sains Hospital, Malaysia from 23rd December 2014 until 17th March 2015. All stage I and stage II hypertensive patients aged above 18 years were recruited. Those with secondary hypertension, resistant hypertension, unstable cerebrovascular/cardiovascular disease, chronic kidney disease (stage IV and V), or end-stage renal disease, pregnancy and those with previous usage of HBPM were excluded from the study.
Sample size calculations were performed using IBM SPSS ver. 20.0 (IBM Corp., Amonk, NY, USA) for comparing two means. The sample size was calculated based on a study conducted by Marquez-Contreras et al. [24] The calculated minimum sample size of the study was 74, but was then increased to 88, to allow an additional 20% enrollment to account for non-responders (44 patients per group).
Overall, 420 patients with hypertension were screened inside the consultation room. Those who were eligible were subsequently referred to the researcher for further explanation. Patients were informed of the study protocol by the researcher and they were given time to consider participation in the study. For those interested, a written informed consent was obtained. Of the 420 patients screened, 140 patients fulfilled the inclusion criteria and 52 refused participation in the study. Ultimately, 88 patients provided consent and were enrolled in the study.
The decision to recruit the patients into either the HBPM group (intervention) or the control group was based on previously prepared randomization tables. The randomization tables, which used randomization blocks of four, were obtained by a computer-generated randomization. Patients were identified only according to their entry number and were allocated to either group as they were recruited.
This study was approved and accepted by the Human Research Ethics Committee of the School of Medical Sciences, Universiti Sains Malaysia, Kubang Kerian, Kelantan, Malaysia on November 13, 2014 (IRB approval no., /JEPeM/1404156).
2. Research Tools
The questionnaires for the respondents consisted of four sections. The first section was collected socio-demographic data including age, sex, race, marital status, background educational level, occupation, and smoking status. The second section involved the patient’s medical history (obtained from the patient’s medical record) including duration of hypertension, number of anti-hypertensive agents taken, of presence of diabetes mellitus and dyslipidemia comorbidities. The third section involved anthropometric measurements including measurements of height, weight, waist circumference (WC), and office BP reading. The last section consisted of seven questionnaires based on a novel Medication Adherence Scale. Patients were interviewed and the researcher filled-in the required information.
The automatic BP monitor Omron (model HEM-7203; Omron Healthcare Co. Ltd., Kyoto, Japan) was used to measure the office BP. The device was properly validated and regularly recalibrated. An appropriate BP arm cuff of the correct size was used during measurements. During the measurement, patients were seated in the correct position. They were asked to rest, not speak, and to relax for at least 5 minutes prior to the BP measurement. The BP device was placed at heart level during the measurement. Two BP recordings were obtained from the right arm of the patients at 5-minute intervals. The office BP reading was taken at baseline and after 2 months of intervention.
The automatic BP monitor Omron model HEM-7120 (Omron Healthcare Co. Ltd.) was used for measurement of home BP. For this purpose, the patients in the intervention group were provided with a new BP measuring device and a BP diary. This model was listed under the Malaysian Ministry of Health and was approved by British Hypertension Society for usage both at home and in the clinic [9]. The questionnaire for adherence was adapted from a study by Ramli et al. [20] in 2012 who performed a similar study on medication adherence among hypertensive patients of primary health clinics in Malaysia. The questionnaires were developed based on the Hill-Bone Adherence to Blood Pressure Therapy Scale and the 8-item Morisky Medication Adherence Scale [25,26].
The 8-item Morisky Medication Adherence Scale is one of the most frequently used self-reporting tools to measure patients’ adherence to a prescribed medicine [26]. It contains eight questions to assess the patients’ adherence towards the behavior of medication-taking in an outpatient clinic. The Hill-Bone Compliance to Blood Pressure Therapy Scale is another self-reporting tool and contains 14 questions, including eight questions that assess medication-taking behavior in hypertensive patients. High reliability and validity had been reported for these two tools of adherence measurement. The Hill-Bone Scale has previously been reported to have good internal consistency and reliability with a Cronbach’s α of 0.68 [25].
Our New Medication Adherence Scale questionnaire consisted of seven questions in total, which selected items from the above two questionnaires and were condensed to form the modified Medication Adherence Scale, relevant to the local setting [20]. Prior to its application in this study, the new questionnaire was subjected to evaluation and validation. Cronbach’s α was calculated to be 0.782, which reflected good internal consistency and reliability. Inter-rater agreement (between the two interviewers) indicated good consistency with a kappa value of 0.796 [20]. There were two versions of New Medication Adherence Scale questionnaire: the English version and the Malay version.
In the New Medication Adherence Scale questionnaire (refer to Appendix 1), patients were required to choose their responses from a set of possible answers. Each question had a four-point Likert-type response format. Each response carried the following scores: 1, all of the time; 2, most of the time; 3, some of the time; and 4, never. A total score for each patient was determined by adding the single scores from each response; total scores could range from 7 (minimum) to 28 (maximum). Lower scores reflected poorer adherence to medication therapy. A full score of 28 or a score of 27 (1 point deducted from any of the ‘unintentional adherence’ questions, which were questions 1 or 6) defined patients as adherers. A score of 27 (due to 1 point deducted from other questions) or a score of 26 and below were categorized as nonadherers.
3. Data Collection Procedure
There were two visits to the clinic throughout the study period for both groups (at baseline and 2 months after the intervention). However, for the intervention group, an interim follow-up at 1 month from the baseline date was established by phone call to remind patients to perform HBPM. At baseline, the patients from both groups were interviewed by the researcher. The questionnaires were then completed. The patients’ medical records were reviewed at that time and the associated medical profiles were recorded. The clinical measurements of patient’s height, weight, WC, and office BP were taken according to the standard protocol.
In addition, both groups were given counseling regarding lifestyle modification including advice on physical activity, exercise, and low dietary salt consumption. There was no change in the medication regime for either group throughout the study period.
Patients in the intervention group were instructed on the HBPM protocol. They were shown how to operate the automatic BP monitor device and each patient was given an appropriate BP arm cuff size. Participants were instructed to take a home BP reading daily, 7 days per week. The measurements were to be taken at about the same time twice daily, once in the morning and once in the evening. On each occasion, the patients were to take two BP measurements 1 to 2 minutes apart and the results, the results of each measurement were to be immediately recorded in the home BP diary provided to them. Both groups were seen again 2 months later for post-intervention data collection. During the visit, two readings of office BP were taken again. The study ended at this point.
4. Statistical Analysis
The IBM SPSS for Windows ver. 22.0 (IBM Corp., Armonk, NY, USA) was used for data analysis. All numerical variables were expressed as mean (standard deviation) and all categorical data were expressed as frequencies (percentage). An independent t-test was used to analyze numerical data such as age, duration of hypertension, number of antihypertensive medications, the body mass index (BMI), WC, SBP, DBP and Medication Adherence Scale. Chi-square test was used to analyze categorical data such as sex, race, marital status, education, and occupation, in addition to the comorbidities diabetes mellitus or dyslipidemia and smoking status. The level of statistical significance was set at 0.05.
The baseline data for BP and Medication Adherence Scale analysis was calculated as mean SBP, DBP, and Medication Adherence Scale. An independent t-test was used to assess the difference of mean SBP, mean DBP, and mean Medication Adherence Scale between the intervention and control group at baseline.
A paired t-test was used to analyze differences between the mean SBP, mean DBP, and mean Medication Adherence Scale within both groups at baseline ad at the 2-month follow-up. For in-between group comparison, an independent t-test was used to compare the changes in mean SBP, mean DBP, and mean Medication Adherence Scale between the intervention and control group at 2 months.
ANCOVA analysis was used to compare changes in mean SBP, DBP, and Medication Adherence Scale between the intervention group and the control group at 2 months with potential confounders added to the model. These confounders included age, duration of hypertension, number of anti-hypertensive agents taken, BMI, and WC. The adjusted means for the SBP, DBP, and Medication Adherence Scale were obtained with the final model.
RESULTS
Overall, 88 subjects participated in the study with 44 subjects in each group. The response rate for the study was 100%. Table 1 shows the results of socio-demographic data and medical profile for both the HBPM and control groups. As shown in Table 1, there were no significant differences in terms of age, sex, race, marital status, education, occupation, or smoking status between both groups.
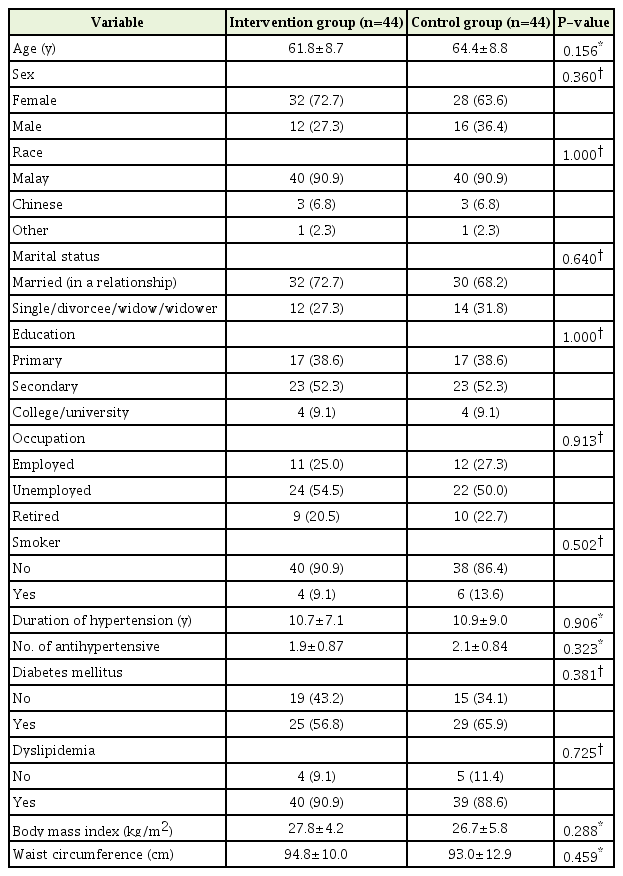
Sociodemographic data and medical profile
In terms of the patients’ medical profile, there were no significant differences amongst variables comparing the two groups. The mean duration of hypertension in the HBPM group and control group was 10.7 (7.1) and 10.9 (9.0) years, respectively, whereas the mean number of anti-hypertensive medications taken by the subjects in the HBPM group and control group was 1.9 (0.87) and 2.1 (0.84), respectively. Statistically, there were no significant differences in mean BMI and WC between the two groups.
1. Effects of Home Blood Pressure Monitoring on Office Blood Pressure
Mean SBP and DBP for both groups are shown in Table 2. Statistically there were no significant differences between groups at baseline and at 2 months. However, the intervention group had a lower BP reading after the intervention.
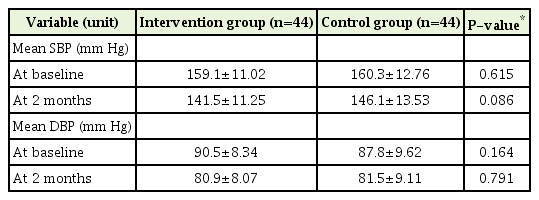
Mean SBP and DBP at baseline and at the 2-month follow-up
The changes in mean SBP and DBP within groups after the intervention are illustrated in Table 3. Both groups showed a significant mean BP reduction. The reduction in mean SBP and DBP were greater in the intervention group compared to the control group (SBP 17.6 mm Hg, DBP 9.5 mm Hg versus SBP 14.3 mm Hg, DBP 6.4 mm Hg).
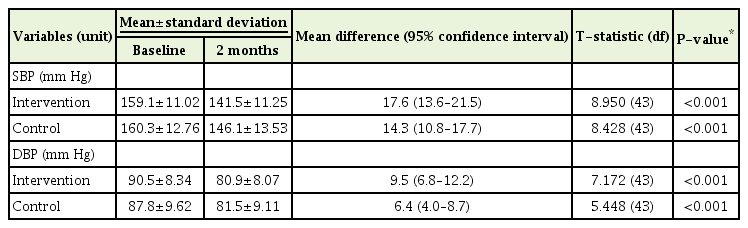
Changes in mean SBP and DBP within groups (from baseline to 2 months)
The change in mean SBP and DBP between groups after the intervention is shown in Table 4. There were no statistically significant changes in the mean SBP and DBP between groups at the 2-month follow-up.

Changes of mean SBP and DBP between groups at 2-month follow-up (after ANCOVA)
2. Effect of Home Blood Pressure Monitoring on Medication Adherence
The mean Medication Adherence Scale of groups at baseline and at 2 months are shown in Table 5. Statistically, there were no significant differences between means, P-value at baseline was 0.447 and 0.792 at two months.
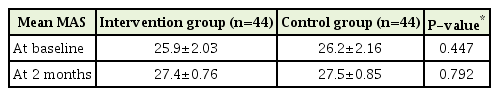
Mean MAS at baseline and at 2-month follow-up
The changes in the mean Medication Adherence Scale within the intervention and control groups from baseline to the 2-month intervention are shown in Table 6. The changes in mean Medication Adherence Scale were slightly greater, albeit significantly, in the intervention group compared to the control group (1.5 versus 1.3, P≤0.001). The changes were statistically significant for both groups.
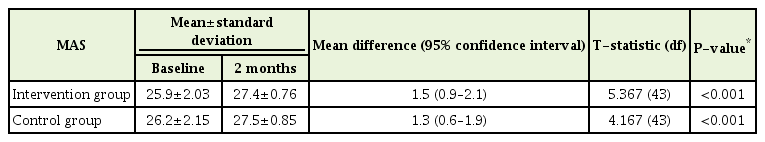
Changes in mean MAS within groups (from baseline to 2-month follow-up)
Finally, Table 7 shows the change of mean Medication Adherence Scale of the intervention group and the control group at the 2-month follow-up. At this time, the adjusted mean difference in the mean Medication Adherence Scale was 0.05 (95% confidence interval [CI], -0.29 to 0.40; P=0.768).
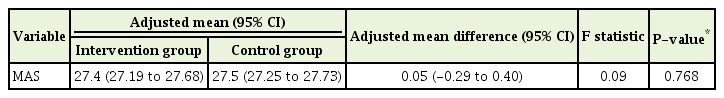
Comparison of changes of mean MAS between groups at 2-month follow-up
DISCUSSION
1. Effects of Home Blood Pressure Monitoring on Office Blood Pressure
This study showed that both the intervention and control groups had a reduction in BP after the 2-month study period (Table 2). The BP showed a greater reduction in the intervention group compared to the control group (Table 3). We also observed that that controlled BP (defined as mean SBP<140 mm Hg and mean DBP<90 mm Hg) was achieved in the intervention group with a mean SBP 141.5 mm Hg and DBP 80.9 mm Hg. The values are referring to the mean SBP and mean DBP at two months of in the intervention group. Clinically, there were more subjects with lower and controlled BP in the intervention groups compared to the usual care group, although statistically these differences were not significant. As stated earlier, even a 2-mm Hg reduction in SBP and DBP may contribute to an overall reduction in hypertension-associated complications [17].
Our study results are similar to a study by Marquez-Contreras et al. [24] in 2006 for SBP. The authors found that patients who practiced HBPM had a greater SBP reduction compared to those who did not. The patients in that study had a greater SBP reduction compared to that observed in our study; however, the SBP reduction was also not statistically significant, with the mean reduction in SBP being 23.4 mm Hg in the intervention group versus 18.9 mm Hg in the control group. However, Marquez-Contreras et al. [24] in 2006 found that HBPM significantly reduced the mean DBP among their study subjects with mean fall in DBP of 12.8 mm Hg in the intervention group versus a 9.7 mm Hg reduction in the control group. The finding on the mean fall in DBP differed from our study result likely because the patients had a higher mean DBP at baseline (92.4 mm Hg in intervention group, 91 mm Hg in control group). Furthermore, Marquez-Contreras et al. [24] in 2006 enrolled a higher number of patients (n=250) and the study had a longer follow-up of up to 12 months.
Furthermore, the study by McManus et al. [27] in 2005 demonstrated a significant difference in SBP from baseline to the 6-month follow-up between the intervention and control groups (mean difference, 4.3 mm Hg; 95% CI, 0.8–7.9 mm Hg), but not between the 6-month and 1-year follow-ups (mean difference, -1.6 mm Hg; 95% CI, -5.3 to 2.2 mm Hg) with the intervention group experiencing a greater fall in BP in the first 6 months. Although our study showed a very similar result in terms of mean difference in SBP (4.74 mm Hg; 95% CI, -0.65 to 10.13 mm Hg), our finding was not statistically significant. The sample size and duration of the McManus et al. [27] in 2005 study differed from ours as 441 participants were enrolled and the study was conducted for 12 months. Furthermore, their intervention not only involved self-BP monitoring but also self-treatment titration according to treatment titration schedules.
It has been suggested that HBPM is more effective when combined with other interventions such as counseling, patient education, and self-management with other forms of support. Bosworth et al. [28] in 2009 reported that the combination of HBPM and a tailored brief behavioral intervention resulted in a significant improvement in BP control (reduction in SBP and DBP at 24 months).
Based on our findings at the 2-month follow-up, there was no significant difference in BP control between both groups (Table 4). This is possibly related to the fact that our study was not blinded. Patients from both groups aware that they were involved in this study and this indirectly might have influenced their response to their hypertensive care. They tended to comply with their medications and possibly changed their lifestyle by controlling their diet and increasing their physical activity during the 2-month study period.
The effect of habituation might also have influenced our study results. The subjects in the intervention group were exposed to repeated BP measurement during their HBPM. Thus, they were familiar with BP measurements and especially with the use of automated sphygmomanometers and this may have led to a reduced ‘white-coat’ effect on the second visit. As a result, there was a ‘greater reduction’ in the BP reading for subjects in the intervention group. Meanwhile, subjects in the control group might have manifested the ‘white-coat’ effect on their second visit, resulting in a post-intervention BP that was higher than that of the intervention group, thus a lesser BP reduction was observed.
2. Effects of Home Blood Pressure Monitoring on Medication Adherence
The effectiveness of HBPM on improving BP control is well documented and a potential mediator towards this end is an improvement in the patient’s adherence. Although HBPM is suggested to be a useful strategy to improve medication adherence, there is limited data to support this [4].
Both groups showed a significant improvement in the mean Medication Adherence Scale (from baseline to 2 months) (Table 6) and the intervention group showed a slightly greater change compared to the control group (1.5 versus 1.3). However, there was no significant change in mean difference in mean Medication Adherence Scale (0.05; 95% CI, -0.29 to 0.40; P=0.768) between both groups at the end of the 2-month study period (Table 7). Therefore, our finding demonstrates there was no significant improvement in the patient’s medication adherence following HBPM.
The reported outcomes resulting from HBPM in medication adherence had differed among previous studies likely based on the study methods employed and the different measures of medication adherence [4,23]. The study by Marquez-Contreras et al. [24] in 2006, which compared HBPM with standard care, found that the percentage compliance was significantly greater in the intervention group than in the control group ([92%; 95% CI, 86.7 to 97.3] versus [74%; 95% CI, 63.9 to 84.1], respectively; P<0.0007). Our study differed from their study in terms of the technique used to assess medication adherence. The authors used the electronic medication events monitoring systems (MEMS) to measure therapeutic compliance in their patients, whereas we used a self-report questionnaire to measure compliance [24].
It has been reported that MEMS had a better correlation with the outcome of measured compliance compared to pill-count [24]. As a measure of drug compliance, the self-report was poorly predictive of non-compliance (with 71% sensitivity and 50% specificity) compared to the pill-count approach (97% sensitivity and 66% specificity) [29].
Our finding was very similar to the finding of Cuspidi et al. in 2004, whereby satisfactory treatment compliance was achieved among their study subjects, with 96% of patients reporting to have taken the prescribed drugs regularly. However, the authors also failed to demonstrate any difference in the patient’s compliance in both groups [30].
Similarly, our study also showed there was no significant difference in medication adherence at the end of study period. Our study subjects had a higher medication adherence rate at baseline with a statistically significant change in the adherence status when compared to both groups at the start of study. This was possibly related to the study setting, as our study was conducted in a specialized primary care clinic in a university hospital. Most of patients had been followed-up at this clinic for quite some time and were highly motivated in controlling their hypertension.
The effects of HBPM on medication adherence also showed mixed results depending on the complexity of the additional support provided. A systematic review by Ogedegbe and Schoenthaler [4] in 2006 on the effects of HBPM on medication adherence found that 54% (six RCTs) of a total of 11 RCTs reported statistically significant improvement in medication adherence attributed to the intervention (five of six were complex interventions). McKenney et al. [31] performed a fourarm study using different adherence-enhancing strategies (including HBPM) and reported that the mean compliance with the intervention group was significantly higher than that of the control group (95.1% versus 76.8%, P=0.0002) and this difference was greater as the number of compliance techniques increased.
3. Conclusion
Using HBPM alone for two months resulted in a reduction in office BP and improvement in medication adherence even though there was no statistically significant difference when compared to the usual care. A physician may or may not advise a patient to buy home BP device as part of hypertension management. However, a longer study duration is needed to better define the long-term effect of the interventions. Findings from future studies on HBPM in Malaysia are needed to properly establish a HBPM module in order to better educate patients on self-BP monitoring.
Notes
No potential conflict of interest relevant to this article was reported.
Acknowledgements
This study was funded by an educational grant from the School of Medical Sciences, Universiti Sains Malaysia, Kubang Kerian, Kelantan, Malaysia for the purchase of the BP devices. The educational grants were provided purposely for university students to perform research or complete any project that related to their studies.
References
Appendices
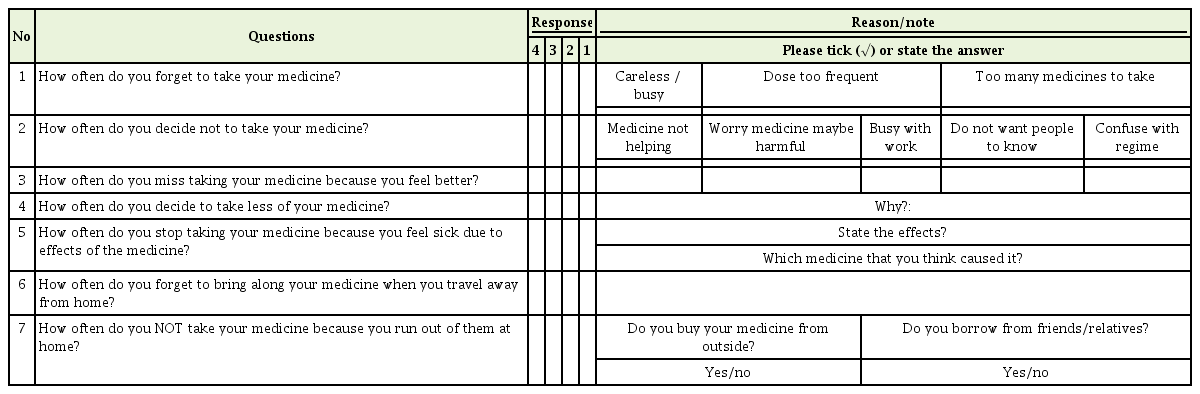
Appendix 1. New Medication Adherence Scale Questionnaire (English version)
Medication compliance assessment form (English version)
Please read each question carefully and tick (√) your response in the column that best explain how you take your medication, using the scale below:
1= all of the time (everyday)
2= most of the time (>5 times per month or >2 times per week)
3= some of the time (1 to 4 times per month)
4= none of the time