Socioeconomic Vulnerability, Mental Health, and Their Combined Effects on All-Cause Mortality in Koreans, over 45 Years: Analysis of Korean Longitudinal Study of Aging from 2006 to 2014
Article information

Abstract
Background
We evaluated the effects of socioeconomic factors and psychosocial factors, both individually and combined, on all-cause mortality risk (mortality risk).
Methods
We conducted an 8-year (2006–2014) longitudinal analysis of 10,247 individuals who took part in the Korean Longitudinal Study of Aging, a nationwide survey of people aged 45–79 years. Socioeconomic vulnerability (SEV) was assessed with factors such as education, household income, commercial health insurance, and residential area. Mental health (MH) was assessed with factors such as depression, social engagement, and life satisfaction. The covariates were age, gender, marital status, cohabiting, number of chronic diseases, and health behaviors such as regular exercise, smoking, and alcohol intake. We used a Cox proportional hazard analysis to investigate the effects of SEV and MH on mortality risk and also to analyze the superimposed effects of SEV-MH on mortality risk.
Results
After the controlling for the covariates, high SEV and negative MH were found to be strong predictors of all-cause mortality. The highest quartile of SEV (vs. lowest) had a 1.70 times greater mortality risk (hazard ratio [HR], 1.70; 95% confidence interval [CI], 1.24–2.33) and the highest quartile of MH (vs. lowest) had a 2.13 times greater mortality risk (HR, 2.13; 95% CI, 1.72–2.64). Being in the highest quartile for both SEV and MH (vs. lowest) increased mortality risk more than 3 times (HR, 3.11; 95% CI, 2.20–4.40).
Conclusion
High SEV and negative MH were independently associated with increased mortality risk, and their superimposed effects were associated with an increased risk of mortality.
INTRODUCTION
In previous studies, all-cause mortality was consistently associated with socioeconomic status (SES) and psychosocial factors [1,2]. In this study, in order to focus on the vulnerability of the structural conditions of health, we replaced SES with socioeconomic vulnerability (SEV) and replaced psychological factors with mental health (MH). The primary hypothesis of SEV was proposed by sociologists to explain the link between SES and health. According to the hypothesis, health outcomes are partly the result of the interaction between SEV and MH [3,4]. For example, when external factors, such as the economic crisis and natural disasters, get worse, the health of individuals with low SEV (i.e., high SES) can be recovered by reducing stress through positive socioeconomic resources. However, individuals with high SEV (i.e., low SES) have fewer resources to reduce stress; thus, the impact of stress persists and increases the mortality risk [5,6].
Resilience and capability are the opposite concepts of SEV, meaning the process of adapting well in front of adversity, trauma, tragedy, threat, or important sources of stress. MH is a fundamental element of the resilience, capabilities, health assets, and positive adaptations that enable people both to cope with the adversity associated with SEV and to reach their full potential [2].
In our study, SES represents a socioeconomic position that refers to status determined by economic and social factors. As mentioned above, we used SEV instead of SES to assess vulnerability [7]. On the other hand, MH refers to a ‘psychosocial well-being state’ in which psychological factors and social factors play a combined role and are distinguished from economic factors.
In this respect, we can infer that SEV influences MH in the context of social factors such as culture, law, and social systems. When the economy is growing and absolute poverty is dwindling, effects associated with social deprivation, such as isolation and lack of social networks, become more important as health predictors [7,8]. Recently, interest in SEV and MH has increased in the fields of public health and chronic disease management as the relationship between SEV, MH, and health behavior has been identified and their impact on health outcomes has been established.
We configured SEV with four variables: education, income, residential areas, and commercial health insurance (CHI). MH was categorized under three variables: depression, social engagement (SE), and life satisfaction (LS).
The purpose of this study was to investigate the effects of SEV and MH on mortality risk and assess the combined effects of SEV-MH on mortality risk by referring to the ‘risk-hazard model’.
METHODS
1. Study Population
We used data from a cohort of 10,254 people from the Korean Longitudinal Study of Aging (KLoSA), which is a nationwide stratified multistage sample of adults. Participants aged 45 to 79 years were followed over five waves covering an 8-year period. The total study population was 10,247 individuals, but seven were excluded due to missing information at baseline (2006).
All-cause mortality was included except for deaths from suicide, murder, accidents, and unknown causes. The deceased with these excluded causes were treated as censored cases (n=85, 2nd wave=13, 3rd wave=16, 4th wave=17, 5th wave=390) (Figure 1).

Flow chart of participants.
2. Hypothesis
We created a modified ‘Risk-Hazard model’ based on Turner et al. [9] in which we replaced ‘exposure’ with ‘SEV’, ‘capability’ with ‘MH’, and ‘impacts’ with ‘mortality risk’. In addition, we added a feedback effect in which MH affects SEV in the reverse direction (b’) and a path of SEV-MH coupling (d) (Figure 2).
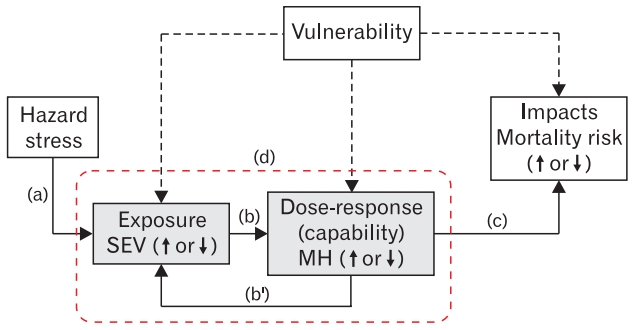
Modified ‘Risk-Hazard model [9].’ SEV, socioeconomic vulnerability; MH, mental health.
3. Independent Variables
1) Socioeconomic vulnerability
Based on previous studies [1,5], our study included four established SEV indicators: education level, annual household income, CHI (yes/no), and residential area (urban/small city/rural). The SEV index score was obtained by summing the above four items: education index score (0–1), household income index score (0–1), CHI index score (0–1), and residential area index score (0–1). The SEV index scores (0–4) were divided into four groups using quartiles: the lowest SEV quartile (SEVQ1), ≤1.42; the second SEV quartile (SEVQ2), 1.43–2.25; the third SEV quartile (SEVQ3), 2.26–4.0; and the highest SEV quartile (SEVQ4), >4.0.
(1) Education: Education is a socioeconomic element that serves as a ladder for social promotion and has an effect until adulthood. Therefore, education is perhaps the most fundamental SES component because it shapes future occupational opportunities and earning potential [10]. It also provides knowledge and life skills that allow better-educated people to more easily access information and resources to promote health. Education index scores were as follows: ≥16 years, 0; 12–15 years, 0.33; 7–11 years, 0.67; and ≤6 years, 1.
(2) Annual household income: In addition to providing means for purchasing health care, higher incomes can provide access to better nutrition, housing, schooling, and recreation. Although the association between income and health is stronger for lower incomes, but above poverty level, the effects of income decrease gradually [11]. Household income (range, 10–600,00 (10,000 won) at 2005) was classified by quintile and the index scores were as follows: >40.00, 0; 24.11–40.00, 0.25; 15.01–24.10, 0.5; 7.01–15.00, 0.75; and ≤7.00, 1.
(3) Commercial health insurance: Having CHI reflects ease of access to health services. According to the Institute of Medicine reports, people with health insurance have 10%–30% lower mortality compared to those without [12]. Health insurance of Korea is a social insurance system that is mandatory for all citizens. However, the coverage level is relatively low, accounting for about 60% (62.6% in 2016) of the total medical expenses [13]. CHI was introduced in 2006 to compensate for the low coverage rate, which had made it easier to use medical services [14]. CHI index scores were as follows: with CHI=0, without CHI=1.
(4) Residential area: Numerous studies have shown that there was a significant association between residential areas and the risk of mortality. In the United States, between 1969 and 2009, the decline in mortality in urban areas was greater than in rural areas [15]. In the United Kingdom (1965–2010), the mortality rates in areas with administrative offices were consistently lower than in those without [16]. In Sweden, life expectancy in specific residential areas had increased by 2.5 years [17]. This is partly due to a neighborhood effect, which is essentially the disparity in resources invested in the community. The residence index scores were as follows: urban=0, small city=0.5, and rural=1.
2) Mental health
Based on similar studies [18-20], the variables that constitute MH were extracted from KLoSA. MH factors consisted of depression (measured by the Center for Epidemiologic Studies Depression Scale Revised, CESD-10), SE, and LS. A MH index score was obtained by summing the above three items: CESD-10 index score (0-1), SE index score (0–1), and LS index score (0–1). The MH index scores (0–3) were then divided into four groups using quartiles: the lowest MH quartile (MHQ1), ≤1.00; the second MH quartile (MHQ2), 1.01–1.75; the third MH quartile (MHQ3), 1.76–2.25; and the highest MH quartile (MHQ4), ≥2.26.
(1) Center for Epidemiologic Studies for Depression, short form
Many studies have shown increased mortality risk during depressed emotional states [21]. The CESD-10 is a self-administered questionnaire consisting of 10 items measuring depression [22]. The score for each item ranges between 0–3 and the total score range is 0–30. We used the Korean version of the CESD [23]. A score of 10 or higher indicated a higher risk of depression. The CESD-10 index scores were 0–4 (0), 5–9 (0.33), 10–12 (0.67), and 13–30 (1).
(2) Social engagement: SE is an important factor of MH that reduces mortality [9,24]. SE scale is composed of seven items: frequency of contacts with friends; frequency of contacts within a mutual benevolence group meeting; frequency of attendance at leisure, culture, and sports activities; frequency of religious attendance; frequency of attending an alumni meeting or hometown alumni and clan gathering; frequency of participation in volunteer work; and frequency of participation in political activities. The scores for each variable were calculated as follows: every day, 5; more than once a week, 4; more than once a month, 3; more than twice a year, 2; and once a year or almost never, 1. The total score ranged from 7 to 35 and was calculated by summing the scores of the seven items. SE index scores were calculated as follows: ≥16, 0; 14–15, 0.33; 9–13, 0.67; and 7–8, 1.
(3) Life satisfaction: In other studies conducted in Korea, the higher the LS, the lower the mortality rate [25]. The question for LS was as follows: “How satisfied are you with your overall quality of life (happiness) compared to others in your age group?” The respondent’s subjective LS was assessed by choosing a value between 0 and 100. The LS index scores were as follows: >80, 0; 71–80, 0.25; 61–70, 0.5; 51–60, 0.75; and ≤50, 1.
4. Dependent Variable: All-Cause Mortality Risk
All-cause mortality risk was assessed using survival status (deceased, dropped out, or survived) and survival months (person-months) calculated using months lived from 2006 (baseline) to 2014. In the biennial survey, information about the day of death and the cause of death were obtained from family members.
5. Covariates
We included age, sex, marital status (married, single), cohabitating status (cohabitating, single), education level, household income, numbers of chronic diseases, and health behaviors as covariates. Among health behaviors, smoking (smokers included people who smoked more than 5 pack-years a lifetime) and drinking (drinkers included people who drank occasionally or frequently, regardless of the amount of alcohol) were classified as ‘current,’ ‘past,’ and ‘never.’ Regular exercise was classified as ‘yes’ and ‘no,’ based on exercise once a week for more than 30 minutes.
6. Statistical Analysis: Cox-Proportional Hazard Regression Analysis
Cox proportional hazard regressions were conducted longitudinally to investigate the causal link between SEV, MH, and the combined effects of SEV-MH on all-cause mortality risk. We used IBM SPSS ver. 20.0 (IBM Corp., Armonk, NY, USA) for statistical analysis.
RESULTS
1. Characteristics of Study Population by Survival Status
Demographic characteristics differed according to survival status. The deceased had the following characteristics compared with survivors. They were more likely to be men, single, live in rural areas, have lower education levels, lower household income, and did not have CHI. The level of MH differed according to the survival status. The deceased were more depressed, had lower LS, and lower SE. The deceased also had poorer health behaviors than survivors, with higher rates of smoking, increased alcohol intake, and less regular exercise (Table 1).

Characteristics of study population by survival status, Korean Longitudinal Study of Aging, 2006–2014
2. Hazard Ratios of All-Cause Mortality Associated with Socioeconomic Vulnerability and Mental Health
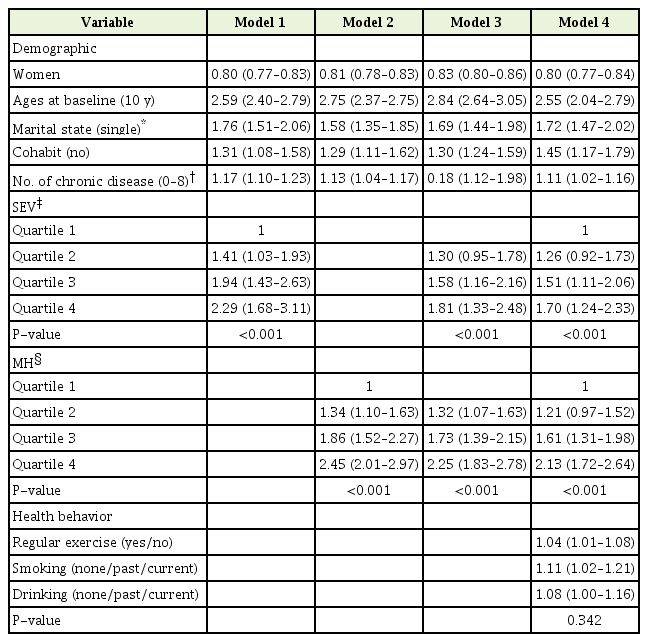
High SEV and negative MH increased mortality risk. The causal associations between SEV and mortality risk and MH and mortality risk were analyzed using Cox proportional hazard models. After adjusting for covariates, compared with the SEVQ1 (reference hazard ratio [HR], 1), the mortality risks of SEVQ2, SEVQ3, and SEVQ4 increased 1.26 times (HR, 1.26; 95% confidence interval [CI], 0.92 to 1.73), 1.51 times (HR, 1.51; 95% CI, 1.11 to 2.06), and 1.70 times (HR, 1.70; 95% CI, 1.24 to 2.33), respectively. After adjusting for covariates, compared with the MHQ1 (reference HR, 1), the mortality risks of the MHQ2, MHQ3, and MHQ4 increased 1.21 times (HR, 1.21; 95% CI, 0.97 to 1.52), 1.61 times (HR, 1.61; 95% CI, 1.31 to 1.98), and 2.13 times (HR, 2.13; 95% CI, 1.72 to 2.64), respectively (Table 2).
Hazard ratios of all-cause mortality associated with SEV and MH
3. Hazard Ratios of All-Cause Mortality Associated with the Combination of Socioeconomic Vulnerability and Mental Health
The combined effects of SEV and MH on mortality risk were analyzed. By making quartiles of SEV and MH into grids respectively, we analyzed the risk of mortality in each cell. After covariates adjusted, compared with the SEVQ1 and the MHQ1 (SEVQ1-MHQ1; reference HR, 1), the mortality risk of the SEVQ4 and the MHQ4 increased 3.11 times (SEVQ4-MHQ4; HR, 3.11; 95% CI, 2.20 to 4.40). As quartiles of SEV and MH for each grid increased, the risk of death increased proportionally. Therefore, high SEV and negative MH were correlated, but they were independent risk factors for mortality risk (correlated, r=0.34, P<0.001; no collinearity, variance inflation factor=1.13) (Table 3, Figure 3).

Hazard ratios for the joint effects of SEV and MH on all-cause mortality: Korean Longitudinal Study of Aging, 2006–2014

Hazard ratios for the combined effects of SEV-MH on all-cause mortality: Korean Longitudinal Study of Aging, 2006–2014. SEV, socioeconomic vulnerability; MH, mental health.
DISCUSSION
In this study, we focused on understanding the effects of SEV and MH on mortality risk using a modified ‘risk-hazard model (Figure 2).’ [9] According to the results, SEVs and negative MH have interactive associations, with each acting independently to increase thr mortality risk.
The flow of Figure 2 is as follows: In the face of stress (a), SEV can be in any particular condition (good or bad) and it affects MH in the positive or negative direction depending on certain conditions (b). Conversely, an independent part of the MH itself that is not affected by the SEV can have a positive or negative impact on the SEV (b’). Then, MH affects mortality risk (c) and the combined SEV-MH (d) affects the mortality risk.
Many studies have demonstrated that SEV [1,26] and MH [24,27] are powerful factors for health, but there is not enough research to analyze the combined effects of SEV and MH. Therefore, this study investigated SEV and MH as independent risk factors on mortality risk, and investigated the combined effects (SEV-MH) as an additional risk factor for mortality.
First, results of our study showed that higher SEV and negative MH had a positive dose-response causal relationship with mortality risk. After adjustment for MH, the difference in mortality risks due to SEV gaps were reduced. And SEV adjustment also reduced the mortality risks due to MH gaps. However, the impact of MH gaps on mortality were greater than that of SEV (Table 2). However, after SEV was adjusted, the decline rates of MH mortality risk were not different between high quartiles and low quartiles. Because the health effects of SEV had been affecting people from a young age, it was presumed that the impact of SEV was relatively small in adults [28]. In this study, the contribution of SEV to health risks was less than the contribution of MH. Second, the combined effects of SEV-MH further increased mortality risk compared with individual effects. Despite the correlation between SEV and MH, they also had independent effects on mortality risk.
Our findings on the relationship between SEV and MH are similar to other studies [29,30]. Our conclusions were summarized as follows. First, SEV is often prioritized over MH. In a study involving both material factor (SEV) and resilience (psychological factor, MH), poor and resilient communities have a higher mortality rate than affluent areas [30]. Second, material factors (SEV) interact with MH in society. In this regard, social factors play a pivotal role between SEV and MH [23]. As an example of the association and transition between SEV and MH, ‘unemployment’ that leads to ‘loss of income (SEV)’ is not psychosocial, whereas the ‘loss of self-esteem’ following ‘loss of social-respect’ due to unemployment is associated with negative MH. For the above reasons, it may be practical and useful to start with a ‘social factor’ approach to health problems and chronic disease management.
Limitations of our study are as follows. First, because the respondents’ perceptions were subjective, and their memories were imperfect, the data could include information bias and recall bias. In particular, deceased individuals’ data may include such biases as the data were obtained from family members rather than from official sources. Second, despite references to existing research, the measurement of SEV, MH, and combination of SEV-MH were somewhat arbitrary and not validated. Third, according to the ‘risk-hazard model,’ SEV precedes MH, but in our study, we could not identify the temporal relationship between SEV and MH because they were evaluated at the same time in 2006. Nevertheless, our research has the following strengths. First, we obtained a nationwide, longitudinal, and large sample. Therefore, the results are more generalizable to the Korean population, aged 45–79 years. Second, in addition to investigating the effects of SEV and MH on mortality risk, we also assessed the combined effects of SEV-MH on mortality risk.
Notes
No potential conflict of interest relevant to this article was reported.