Serum Low-Density Lipoprotein Cholesterol Levels and Depressive Mood in Korean Adults: A Nationwide Population-Based Study
Article information

Abstract
Background
The association between serum cholesterol levels and depression has been studied extensively; however, results are inconsistent. This study aimed to investigate the association between low-density lipoprotein cholesterol (LDL-C) levels and depressive symptoms among Korean adults.
Methods
This cross-sectional study used data obtained from the 2007–2015 Korea National Health and Nutrition Examination Survey. In total, 40,904 adults were included in the final analysis. Participants were categorized into five groups according to their LDL-C levels, using the Korean guidelines for dyslipidemia. Symptoms of depression were evaluated using a self-reported questionnaire. Weighted logistic regression was used to examine the relationship between LDL-C levels and self-reported depressive symptoms.
Results
Compared with the intermediate category, the lowest (<70 mg/dL) and highest (≥160 mg/dL) LDL-C categories were associated with depressive symptoms, after adjusting for potential confounding factors (odds ratio [OR], 1.191; 95% confidence interval [CI], 1.008–1.409; OR, 1.241; 95% CI, 1.073–1.435, respectively). The highest LDL-C category was positively associated with depressive symptoms in those who were middle-aged, female, had a low body mass index, and taking or not taking dyslipidemia medications.
Conclusion
A U-shaped association was identified between LDL-C categories and self-reported depressive symptoms. Our findings suggest that LDL-C levels that are too low or too high are associated with self-reported depressive symptoms. Further prospective studies are needed to determine the causal relationship of this association.
INTRODUCTION
Depression is an important health problem worldwide and its incidence and social burden are increasing. In South Korea, the lifetime prevalence of major depressive disorder was 5.0% in 2016 and the annual medical cost associated with depression was estimated to be approximately 1.331 billion US dollars in 2012 [1,2]. Depression is known to reduce an individual’s quality of life and cause functional impairment [3]. Furthermore, depression is associated with a higher risk of type 2 diabetes and cardiovascular diseases [4,5]. Therefore, there is increasing interest in understanding the pathophysiological mechanisms of depression and its possible predictive biomarkers. Among the commonly used biomarkers, recent studies have demonstrated that lower uric acid and higher C-reactive protein levels are independently associated with depression [6,7].
The association between serum cholesterol levels and depression has continuously been reported over the past decades, based on a possible mechanism between cholesterol and serotonin [8,9]. A recent meta-analysis, in 2016 [10], demonstrated a cross-sectional link between depression and low serum low-density lipoprotein cholesterol (LDL-C) levels, using serum LDL-C as a continuous variable. However, the opposite was found in studies modelling serum LDL-C as a categorical measure, and the researchers suggested a U-shaped association between LDL-C levels and depression through this discrepancy [10]. In 2017, Oh and Kim [11] presented the results of an analysis using a Korean nationwide survey that showed a significant association between depression and high high-density lipoprotein cholesterol (HDL-C) levels in males and high triglyceride levels in females.
These inconsistent results suggest that further evaluation of the relationship between serum cholesterol levels and depression in a larger study sample is needed. In this study, we aimed to examine the association between serum LDL-C levels, categorized according to the international guidelines for dyslipidemia, and self-reported symptoms of depression using a representative sample of Korean adults.
METHODS
1. Study Population
Data were collected from the fourth, fifth, and sixth Korea National Health and Nutrition Examination Surveys (KNHANES), which were conducted by the Korea Centers for Disease Control and Prevention (KCDCP; currently, Korea Disease Control and Prevention Agency) between 2007–2015. The KNHANES is a nationally representative survey that measures the health and nutritional status of the Korean population. The sampling design of the KNHANES was a complex, stratified, multistage, probability-cluster survey of a representative sample of the non-institutionalized civilian population of South Korea. This survey collected information on socioeconomic status, health-related behaviors, quality of life, anthropometric measures, and biochemical profiles with three component surveys: health interview, health examination, and nutrition survey. 12) Trained medical staff performed the health interview and examination at the mobile examination center, according to standardized protocols. All participants provided written informed consent before the survey. The KNHANES was approved by the institutional review board (IRB) of the KCDCP (IRB approval no., 2007-02CON-04-P, 2008-04EXP-01-C, 2009-01CON-03-2C, 2010-02CON-21-C, 2011-02CON-06-C, 2012-01EXP-01-2C, 2013-07CON-03-4C, and 2013-12EXP-03-5C). This study was approved by the IRB of Yonsei University College of Medicine (IRB approval no., 9-2021-0103).
This study included 73,353 participants from the 2007–2015 KNHANES. We excluded 17,314 participants aged <19 years. Participants with triglyceride levels >400 mg/dL (n=1,080) and those with missing data in at least one of the following components: health questionnaires, blood samples, and/or anthropometric measures (n=7,666) were also excluded. After these exclusions, 40,904 participants were included in the final analysis (Figure 1).
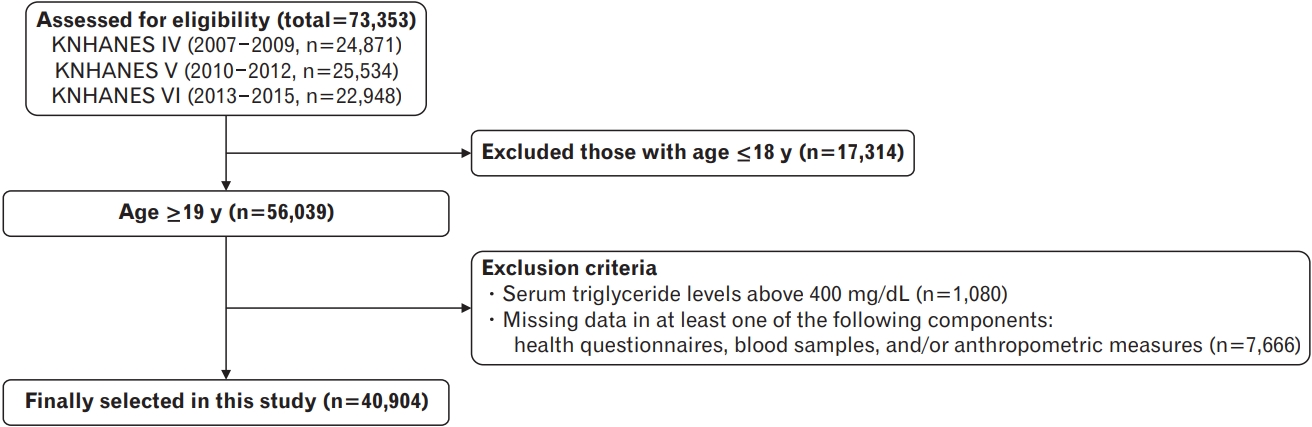
Flow chart of the study population selection. KNHANES, Korea National Health and Nutrition Examination Surveys.
2. Assessment of Symptoms of Depression
In this study, symptoms of depression were evaluated by self-report using the following question: “Have you ever felt sad or desperate enough to interfere with your daily life for more than 2 weeks in a row during the past year?” Participants were required to respond yes or no.
3. Assessment of Lipid Profiles and Definition of Low-Density Lipoprotein Cholesterol Category
For each participant, a single blood collection was performed during the medical examination, after at least 8 hours of fasting. Total cholesterol (TC), triglycerides (TG), and high-density lipoprotein cholesterol (HDL-C) were measured using an ADIVA 1650 analyzer (Siemens, Tarrytown, NY, USA) in 2007 and a Hitachi Automatic Analyzer 7600 (Hitachi, Tokyo, Japan) from 2008–2015. HDL-C level was measured according to the Lipid Standardization Program of the US Centers for Disease Control and Prevention since 2009. Using the data from the US Centers for Disease Control and Prevention, conversion formulas for HDL-C were calculated [13]. LDL-C was then calculated using the Friedewald equation, as follows: LDL-C=TC–HDL-C–TG/5 [14]. The participants were categorized into five groups according to their LDL-C levels: C1 (<70 mg/dL), C2 (70–100 mg/dL), C3 (100–130 mg/dL), C4 (130–160 mg/dL), and C5 (≥160 mg/dL), based on the LDL-C target levels from the 2018 Korean guidelines for the management of dyslipidemia [15].
4. Assessment of Confounders
Body weight and height were measured to the nearest 0.1 kg and 0.1 cm, respectively, with the participants wearing light indoor clothes, without shoes. Body mass index (BMI) was calculated by dividing weight (kg) by the square of height (m2) and was categorized as follows: normal (<23.0 kg/m2), overweight (23.0–25.0 kg/m2), and obese (≥25.0 kg/m2) [16]. Smoking status was divided into “current smoker” and “ex-/never smoker.” We defined “heavy alcohol drinking” as “7 servings or more for males and 5 servings or more for females at a time, at least twice a week.” For physical activity, “regular exercise” was defined as ≥20 minutes of vigorous-intensity physical activity for ≥3 days a week or ≥30 minutes of light- or moderate-intensity physical activity for ≥5 days a week. Household income was divided into quartiles and ranked from the lowest to the highest. Education level was classified into four categories: elementary school or lower, middle school, high school, and college or higher. Marital status was divided into “married” and “unmarried.” Employment status was categorized into two groups: employed and unemployed. Participants who previously had any of the following diseases were defined as having “chronic disease”: stroke, myocardial infarction or angina, diabetes mellitus, chronic kidney disease, any malignancy, liver cirrhosis, rheumatoid arthritis, osteoarthritis, asthma, or chronic obstructive pulmonary disease” . “Diagnosed depression” was defined as having depression diagnosed by a doctor and “dyslipidemia medications” was defined as taking medications for lowering serum cholesterol, assessed with a face-to-face interview.
5. Statistical Analysis
All statistical analyses of this survey were performed using sampling weights to represent the entire Korean population. The weights were adjusted with the values for the inverse of the response rates and the inverse of the selection probability to the sex- and age-specific values for the Korean population (post-stratification) [12]. Data are presented as mean±standard error (SE) or weighted percentage (SE). The clinical characteristics of the study population according to the LDL-C categories were compared using a weighted generalized linear regression analysis for continuous variables and weighted chi-square tests for categorical variables. After setting the intermediate category, C3, as the reference group, the odds ratios (ORs) and 95% confidence intervals (CIs) for symptoms of depression were calculated using weighted multiple logistic regression analysis, after adjusting for confounding variables. Subgroup analyses by age, sex, BMI, chronic disease, dyslipidemia medications, and depression diagnosis were conducted. IBM SPSS statistical software ver. 23.0 (IBM Corp., Armonk, NY, USA) was used for all analyses. Statistical significance was set at P<0.05.
RESULTS
1. Clinical Characteristics of the Study Population
Table 1 shows the clinical characteristics of the study population according to the LDL-C categories. All variables showed significant differences between groups, except for the diagnosis of depression. Some variables, such as current smoking, heavy alcohol drinking, total calorie intake, and marital status showed constant decreases or increases; however, others showed inconsistency.

Clinical characteristics of study population according to low-density lipoprotein cholesterol categories
2. Relationship between Low-Density Lipoprotein Cholesterol Categories and Self-Reported Symptoms of Depression
The results of the multiple logistic regression analyses between the LDL-C categories and symptoms of depression are presented in Table 2. Compared with the intermediate category (C3), the corresponding ORs for symptoms of depression in the lowest (C1) and highest (C5) categories were 1.191 (1.008–1.409) and 1.241 (1.073–1.435), respectively, after adjusting for age, sex, BMI, smoking, alcohol drinking, exercise, household income, education level, marital status, employment status, chronic disease, and total calorie intake. A U-shaped association was identified between the LDL-C categories and symptoms of depression.

Odds ratios and 95% confidence intervals for self-reported symptoms of depression according to LDL-cholesterol categories
Table 3 shows the associations between LDL-C categories and symptoms of depression in the subgroups. A U-shaped association between LDL-C categories and symptoms of depression was only observed in subgroups who were not diagnosed with depression and those without chronic disease. In subgroup analysis, when using the intermediate category (C3) as a reference, we found significantly positive associations between the highest category (C5) and symptoms of depression in participants with the following characteristics: middle-aged, female, BMI <23.0 kg/m2 , and taking or not taking dyslipidemia medications.

Odds ratios and 95% confidence intervals for self-reported symptoms of depression according to LDL-cholesterol categories from subgroup analysis
DISCUSSION
Using a nationwide survey, we found a U-shaped relationship between LDL-C levels and self-reported symptoms of depression in the Korean population, after assessing confounders. This U-shaped relationship was still present in subgroups without chronic disease and those who had not been diagnosed with depression. Only the high LDL-C category was positively associated with depressive symptoms in those who were middle-aged, female, had a low BMI, and taking or not taking dyslipidemia medications.
The association between serum cholesterol levels and depression has continuously been studied since the 1990s [17,18], however, the results remain inconsistent. For example, some studies have shown lower LDL-C levels in patients with depression [19,20], while others have shown higher LDL-C levels [21,22]. Our results are consistent with those of Tedders et al. [23], who documented a U-shaped association between LDL-C levels and severe depression among the US household population. However, inconsistent with a previous study that showed a U-shaped association among males, the present study showed a U-shaped association after adjusting for sex and a significant association between higher LDL-C levels and depression among females in the subgroup analysis. These discrepancies across studies might be related to differences in study populations, measurements of depression, and the selection of cut-off points for LDL-C category, if it was categorized. To the best of our knowledge, this is the first study to categorize LDL-C levels according to the Korean guidelines for dyslipidemia and investigate their association with self-reported symptoms of depression. Therefore, we suggest that further studies are needed to determine appropriate LDL-C levels that do not increase the risk of depression in Koreans.
Although the exact mechanisms underlying the association between LDL-C and depression remain inconclusive, several theories have been suggested. Cholesterol is a vital component of cellular membranes and plays a crucial role in membrane organization, dynamics, and function [24]. Since cholesterol is abundant in the brain, 25% of total body cholesterol is distributed in the brain, and the role of cholesterol in central nervous system function has been emphasized [25]. Naturally low or therapeutically lowered cholesterol may be associated with the depletion of brain cell membrane cholesterol and decrease the exposure of serotonin receptors on the membrane surface, resulting in low serotonin function [26]. In addition, low cholesterol may cause depression due to the reduced synthesis of neurosteroids, which play a role in the pathophysiology of stress and stress-related psychiatric disorders [27]. High cholesterol may also be associated with depression as it decreases membrane fluidity, which could negatively affect the activity of serotonin receptors in the central nervous system [28,29].
Although we explored the relationship between LDL-C levels and depression in a large sample size, this study had several limitations. First, we could not examine causality between LDL-C levels and depression because this was a cross-sectional study. Further longitudinal studies are required to determine the causal relationship between LDL-C levels and depression. Second, this study did not consider all other health conditions that could be risk factors for depression, such as chronic pain or a family history of mental health problems. Third, the measurement of depressive symptoms in this study was acquired using a simple self-report questionnaire. Since the Patient Health Questionnaire, which is a more accurate diagnostic tool for depressive symptoms or depressive disorders [30], was only administered for a few years in the KNHANES, only a small number of participants could be included in the analysis. Future studies with a larger number of participants and more accurate tools for determining depression are warranted. Finally, LDL-C levels were calculated using the Friedewald equation and were not measured directly. It is known that the Friedewald equation tends to underestimate LDL-C levels, especially if TG levels are high, 31) further studies with directly measured LDL-C levels are necessary.
In conclusion, the present study found that serum LDL-C levels and depressive symptoms have a U-shaped relationship in the Korean population, after adjusting for possible confounders. We categorized LDL-C levels according to the international guidelines for dyslipidemia and our findings suggest that LDL-C levels that are too low or too high are associated with depressive symptoms. Further prospective studies are needed to determine the causal relationship of this association.
Notes
CONFLICT OF INTEREST
No potential conflict of interest relevant to this article was reported.