Types of Usual Source of Care and Patient-Centered Communications
Article information

Abstract
Background
A usual source of care (USC) is related to longitudinal and personalized services, which are attributes of primary care. Patient-centered communication, an important element of patient-centered care, helps physicians understand health problems from a patient’s point of view. We analyzed the association between USC and patient-centered communication.
Methods
Data from the Korea Health Panel 2018 were used in the analysis. Patient-centered communication scores were obtained by combining the four communication-related questionnaire items. Usual source of care types were categorized based on responses to two questionnaire items: no USC, a place without a regular doctor and with a regular doctor. Multiple logistic regression analysis was used to adjust for confounders.
Results
Good communication rate was higher for those with a regular doctor (71.8%) than for those with no USC (61.8%) or a place only (61.5%). Those with a regular doctor had better communication (odds ratio, 1.49 for individuals with poor/moderate health, and 2.08 for those with good health) than those without a USC after adjusting for confounders. In terms of communication, no difference was observed between individuals with no USC and those with a place only.
Conclusion
Having a regular doctor promotes communication between patients and doctors. Good communication may be a mediator between having a regular doctor and related beneficial outcomes. Better communication by having a regular doctor, along with several other benefits identified in previous studies suggests the need for a health policy that encourages individuals to have regular doctors.
INTRODUCTION
The concept of “patient-centered care” was established in 1993 by the Picker Institute/Harvard School of Medicine in “Through the patient’s eye,” which provided an approach to establishing treatment plans and providing and evaluating medical services that are mutually beneficial to health care providers, patients, and patient families by establishing cooperative relationships [1]. Patient-centered care is composed of respect for patients’ values, preferences, and needs, coordination and integration of care, information, communication, and education, physical comfort, emotional support, and alleviation of fear and anxiety. In 2001, the American Institute of Medicine designated patient-centered care as one of the six goals for improving health care, and in recent years, patient-centered care has become an essential element of medical care [2].
Patient-centered communication plays an essential role in patient-centered medicine. Epstein and Street [3] presented the following important elements of patient-centered communication: derivation and understanding of the patient’s point of view, understanding the patient in psychosocial and cultural contexts, and finding treatment strategies consistent with the values pursued by the patient. Patient-centered communication allows patients to understand treatment options and participate in decision-making autonomously in cooperation with their doctors [4]. From a practical perspective, patient-centered communication increases patient adherence to medical care, enhances efficient management of chronic diseases, promotes health, improves medical care quality, and positively affects hospital earnings [5-9].
A usual source of care (USC) is defined as “a particular medical professional, doctor’s office, clinic, health center, or other place where a person would usually go if sick or in need of advice about his or her health.” A USC, whether dependent on a place or single doctor, can be classified as a regular doctor (RD) or a USC without a RD (place only) [10]. Having a USC improves access to medical care, promotes close patient-doctor relationships, diminishes unmet medical needs and medical expenses, increases patients’ adherence to medication and preventive services, and enhances doctors’ recommendations for smoking cessation [11-13].
We hypothesized that a USC, especially a RD, would facilitate good patient-centered communication. Because having a USC might improve the attributes of primary care, such as first contact, comprehensiveness, coordination, continuity, and personalized services [14], we considered that a RD would value the patients’ questions and allocate sufficient interview time to understand patients’ reasons for consultations and preferences. We also thought that a RD would provide a personalized understandable explanation to his/her patient and would share decision-making. Additionally, USC and patient-centered communication have several common advantages, as they are associated with high health quality indicator scores and greater patient satisfaction. Therefore, we inferred that better patient-centered communication would mediate the beneficial effects of USC.
However, few studies have examined the association between USC and patient-centered communication; thus, we decided to conduct this investigation.
METHODS
1. Data Source and Sample Selection Process
The study analysis was conducted using the 2018 Korea Health Panel (KHP) survey data (version 1.7), which was conducted and published in 2021 by the Korea Institute for Health and Social Affairs and National Health Insurance Service. Version 1.7, released in 2020, is a revised and supplemented version of beta version 1.7. The KHP survey has been conducted annually since 2008 with the aim of identifying factors that directly or indirectly affect healthcare service use, medical expenses, financial resources, and observing trends. For the health panel survey, representative sample households were selected through stratified sampling of the entire Korean population. All household members of the selected households were surveyed. To address dropouts, 2,520 households were newly recruited in 2012, and the survey was conducted in a similar manner. In the 13th survey conducted in 2018, 4,803 households and 12,952 household members answered approximately 400 questions.
A schematic of the sample-selection process is shown in Figure 1. Originally, 13,413 adults aged ≥18 years answered the appendage questionnaire. We excluded data of 1,741 individuals who never visited the outpatient department of a medical institution, as well as dental and oriental medicinal visits. Additionally, data of 1,418 individuals who did not answer any of the four questions about patient experience and data of 23 individuals who gave contradictory answers to USC questions were also excluded. Finally, data from 10,231 respondents were included in the analysis.
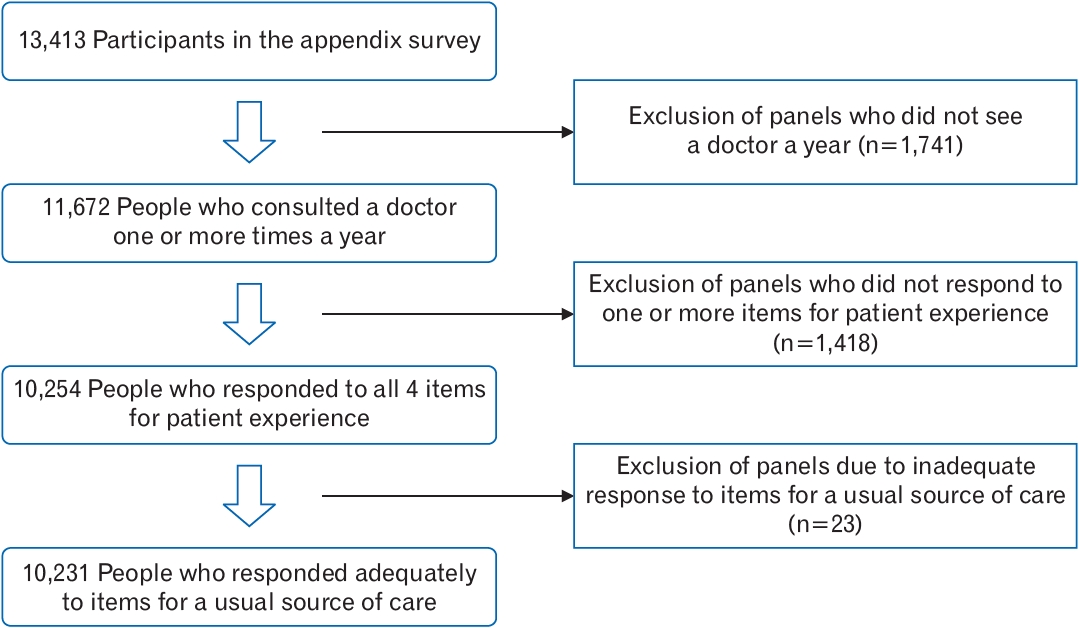
Sample selection process in this study.
Permission from the institutional review board was not needed as the KHP data were open to the public and did not have specific personal identifiers.
2. Variables
1) Outcome variables: integrative scores for patient-centered communication
In this study, patient-centered communication was evaluated using answers to four KHP questions about patient experiences (PA2-5), which addressed sufficient time for a conversation with doctors, straightforward explanations, opportunity for questions, and shared decision-making. These items were similar to those used in the 2015 Korea National Health and Nutrition Examination Survey [15]. The answer type for all the four questions was a 4-point Likert scale: always, mostly, sometimes, and not at all. The question regarding shared decision-making had one more answer item: “I did not want to participate.”
Lee and Choi [7] used the average value of the above four items as patient-centered communication score. We dealt differently with the integrated score of patient-centered communication, as the distribution of answers was skewed, not at all (<4%), and mostly (>51%). For these four items, positive answers (“always” and “mostly”) were given one point and negative answers (“sometimes” and “not at all”), which is zero points. The answer to the shared decision-making question, “I did not want to participate,” was given one point as the patients’ opinion was thought to reflect that they did not want to participate. A combination of the four converted scores was taken as a composite variable, that is, an integrated score for patient-centered communication, as the factor analysis showed convergence to only one distinctive factor. The Cronbach’s α was 0.82. We dichotomized the study participants into two groups according to the four converted scores: a good communication group, in which all scores were 1, and a poor communication group, in which at least one of the scores was 0.
2) Explanatory variable: types of USC
The types of USC were classified into three groups using questions that addressed a USC (SE7) and visit to a RD (SE17) on the appendage questionnaire. The USC-related question was, “is there a medical institution that you usually visit when you are sick or when you want to get tests or treatment consultation?” The question concerning visiting a RD was “when you are sick or when you want to have tests or treatment consultation, mainly do you have any visiting doctors?” The three groups were as follows: no USC group (those with neither a USC nor an RD), place-only group (with a USC, but without an RD), and RD group (with both a USC and an RD). Those with an RD, but without a USC were excluded from the analysis because there were only 23, and the meaning was vague.
3) Control variables
The patients were divided into males and females. Age was categorized as 18–39, 40–64, and ≥65 years, and education duration was categorized as elementary school (0–6 years), middle or high school (7–12 years), and college or over (13 years or more). Household income was categorized into quintiles. Marital status was categorized as married or others (divorced, separated, widowed, or never married). Health coverage was categorized as national health insurance subscribers or others (medical care for low-income people, special care for national merit, care for foreigners, and stopped care due to non-payment). Private health insurance was categorized as private health insurance. Private health insurance is an additional insurance policy, and individuals choose insurance as needed because all Korean citizens are covered by the national health insurance. Disability status was classified as either with or without a disability, regardless of whether they were registered. Self-rated health (SRH) status was evaluated using the health status question (S17) and rated on a 5-step Likert scale. The specific question was “how do you rate your current health status”? Responses, including “not applicable,” were treated as missing values. SRH status was classified as poor, moderate (responses were very bad, bad, or average), or good (responses were good or very good). The number of chronic diseases was classified as none or ≥1, and the number of yearly doctor visits was classified as 1–13 or ≥14, according to the median value.
3. Statistical Analysis
Chi-square tests were used to analyze the association between the participants’ general characteristics and types of USC, and between general characteristics and patient-centered communication. Multiple logistic regression analysis was performed to obtain adjusted odds ratios (ORs) for reporting good patient-centered communication. An interaction term between USC type and health status was included in the multiple logistic regression. This interaction term was the only significant item (P-value of <0.05) among the primary interactions between the types of USC and other confounders. Stata/SE ver. 16.1 (Stata Corp., College Station, TX, USA) was used for statistical analysis, and statistical significance was accepted for P-values less than 0.05.
RESULTS
1. General Characteristics of Study Participants by Usual Source of Care Types
Table 1 shows the distribution of USC types according to the general characteristics of the study participants. All distributions of the general characteristics, except for sex and marital status, were significantly different for the USC types. The retention rates of the RDs for those aged 18–39, 40–64, and ≥65 years were 12.7%, 25.4%, and 38.0%, respectively, and for those with ≤6, 7–12, and ≥13 years of education were 35.3%, 28.6%, and 21.5%, respectively. The RD retention rate was lower for private health insurance subscribers (25.1%) than for those without private health insurance (35.4%). Patients with poor or moderate health status (30.7%) had a higher RD retention rate than those with good health status (21.9%). Patients with chronic diseases (33.0% versus 11.7% without diseases) and those who visited outpatient departments 14 times or more per annum (36.1% versus 19.5% for those who visited 13 times or less) were more likely to have an RD.
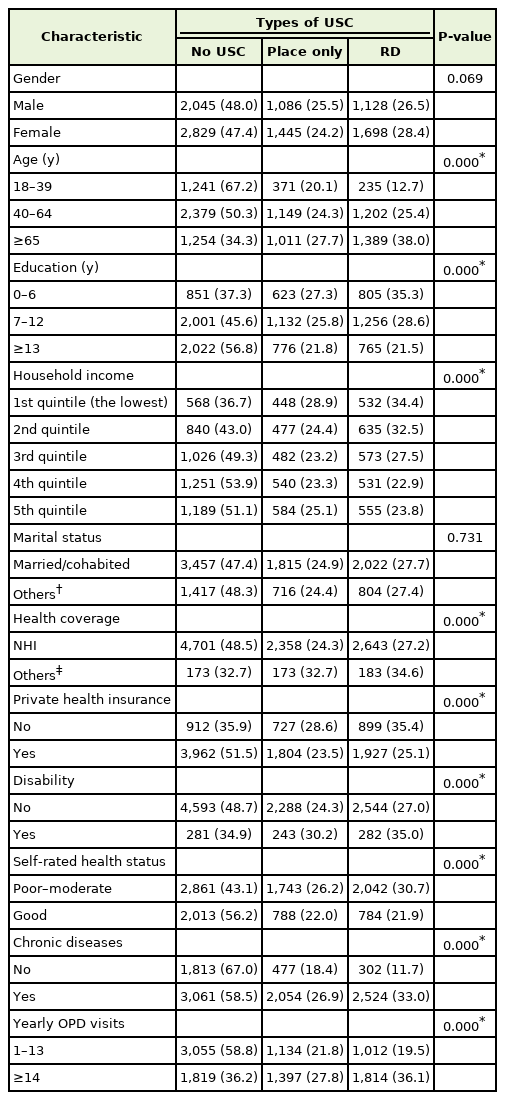
General characteristics of study subjects by USC types (N=10,231)
2. General Characteristics and Patient-Centered Communication
Table 2 shows results of the bivariate analysis of the relationship between general characteristics and patient-centered communication. The percentage of study participants who reported good communication was 61.8% in those without a USC, 61.5% in those with a place only, and 71.8% in those with an RD. Sex, age, education duration, health coverage, private health insurance, chronic disease, and number of annual outpatient visits did not have a significant effect on reported good communication.
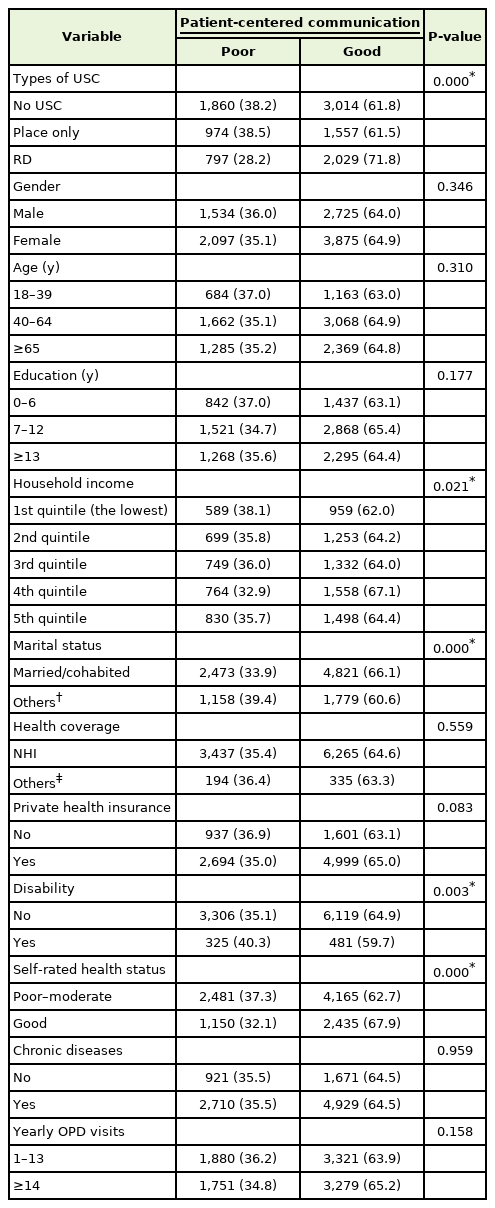
General characteristics and patient-centered communication (N=10,231)
3. Adjusted Odds Ratios of Individuals Reporting Good Patient-Centered Communication
Table 3 shows the ORs of individuals reporting good patient-centered communication after adjusting for confounders. As compared to those without USC, the odd ratios of those with a place only were not significantly different (OR, 0.95; 95% confidence interval [CI], 0.84–1.08) for those with poor or moderate health and 1.16 (95% CI, 0.97–1.38) for those with good health. The ORs of those with RD were significantly different (OR, 1.49; 95% CI, 1.32–1.68) for people with poor or moderate health, and 2.08 (95% CI, 1.70–2.53) for individuals with good health.

Adjusted odds ratios of receiving good scores for patient-centered communication (N=10,231)
Compared to those with poor or moderate health, people with good health had a significantly higher OR of good communication for the no USC (1.17; 95% CI, 1.04–1.33), a place only (1.43; 95% CI, 1.19–1.71), and RD groups (1.64; 95% CI, 1.34–1.99).
For the study participants in the no USC group, individuals with good health had a significantly higher OR of good communication than those with poor or moderate health (1.17; 95% CI, 1.04–1.33), and in a place only and RD groups, corresponding ORs were 1.43 (95% CI, 1.19–1.71) and 1.64 (95% CI, 1.34–1.99), respectively. The OR for good communication among individuals without a spouse (divorced, separated, widowed, and single) was 0.78 (95% CI, 0.70–0.86), as compared with those with a current spouse (married and living together). The OR of people with disabilities was 0.84 (95% CI, 0.72–0.98), as compared with those without a disability.
DISCUSSION
This study was undertaken to investigate the relationships between the types of USC and good patient-centered communication using 2018 data from the KHP. No significant difference in effective patient-centered communication with doctors was found between a place-only and no USC groups. However, those in the RD group communicated with their doctors more effectively in a patient-centered manner than those in the no USC group (Table 3). To the best of our knowledge, this study is the first to report the differential effect on good patient-centered communication between a place only and RD groups, as compared to the no USC group.
In a study using the 2017 KHP data, the OR in individuals without a USC for negative answers for the question that addressed sufficient time for a conversation with their doctors was 1.65 (95% CI, 1.48–1.85), as compared to those with a USC. 16) The ORs for negative answers for the questions that addressed straightforward explanations, opportunity for questions, and shared decision-making were 1.51 (95% CI, 1.33– 1.71), 1.73 (95% CI, 1.54–1.95), and 1.32 (95% CI, 1.18–1.48), respectively. This study, based on 2017 data, produced results similar to our study using 2018 data with regard to good communication for each of the four communication-related items for individuals with USC. However, we found that only people with an RD showed a significant difference from those without a USC, but not from those with a USC without an RD. Our findings made progress in the study of the association between communication and a USC by subdividing individuals with USC into two groups: one with only a regular place without an RD, and the other with both a regular place and an RD.
The ORs for good communication among study participants with good SRH compared with those with poor or moderate SRH were highest in the RD group (Table 3). This suggests that patient-centered communication is better for RD.
Our finding of better communication for individuals with RD than for those without USC may be why having an RD was found to have many beneficial effects in previous studies, e.g., to decrease unmet health needs, decrease medical expenses, increase medication adherence, increase in the acceptance of preventive services, and increase doctors’ recommendations for smoking cessation [12-14,17-20]. Starfield suggested that a repository of stored information about patients and increased knowledge of people derived from a personal association are factors that enhance the benefits of having a USC [21]. Patient-centered communication may play an important role in knowing patients and obtaining information effectively. Lee and Choi [7] also suggested that patient-centered communication has a positive effect on the quality of life of chronically ill patients.
Our results showed that the OR of good communication was higher in individuals with RD than in those without USC, but not different in individuals with a place only, which might also explain the different outcomes between RD groups and place-only groups in previous studies. In a study by Xu [22], five preventive services (flu vaccination, cholesterol test, blood pressure measurement, Pap smear, and mammography) were more frequently received by place only and RD groups than by the no USC group. However, only two preventive services, blood pressure measurement and cholesterol testing, showed a significant difference between those with RD and those with place only. While blood pressure measurement and cholesterol testing are effective items among conflict-driven prevention treatment and are doctor-led items in terms of cost, the remaining three items have patient-driven aspects [22]. In a study by Doescher et al. [23], individuals with a place only and those with RD showed an increase in receiving preventive services; however, those with RD had significantly higher influenza vaccination and mammography rates than those with a place only. In a study by Blewett et al. [19], individuals with a place only and those with an RD received influenza vaccination, Pap smear, and mammography more often than those without USC, but the ORs were higher in the RD group. In a study based on 2013 KHP data, as in this study, the number of emergency room visits by diabetic patients was significantly lower in the RD group (OR, 0.57) than in the place-only group [24]. Hypertensive patients with a comprehensive community clinic as a USC (mostly with an RD) had lower emergency room visits (OR, 0.61) and hospitalization rates (OR, 0.69) than hypertensive patients with a place only [25]. As Starfield suggested, cumulative information gained over time from long-term relationships between patients and specific doctors provides more benefits regarding the recognition of patients’ problems than technical care [21]. Effective patient-centered communication may play a significant role in effectively obtaining information.
This study has several limitations. First, the cross-sectional nature of the study prevented accurate determination of the causal relationship between RD and effective patient-centered communication. However, regardless of causation, we found that RD was associated with better patient-centered communication. Second, there is a possibility of recall bias because the questions posed concerned events that occurred over approximately a year. However, we believe that this would not have affected our conclusions because recall bias is unlikely to be differentially influenced by the type of USC. Third, although patient-centered communication is a composite variable, and although we experienced no reliability or factor analysis-associated problems, it was not developed as a tool, its interpretation as a general result of patient-centered communication may introduce limitations. Fourth, our results do not apply to individuals aged ≤17 years. Additional studies are required to determine the impact of panel analysis using historical data on the relationship between USC and patient-centered communication in younger individuals and the mediating effects of patient-centered communication and USCs on actual outcomes.
This study shows that RD improves effective patient-centered communication. As the medical paradigm shifts from disease-to patient-centered approaches, the importance of patient-centered communication is rapidly increasing. Along with the positive effects of having a RD, improved patient-centered communication, as demonstrated by this study, suggests the need for a health policy that encourages individuals to have RD.
Notes
CONFLICT OF INTEREST
No potential conflict of interest relevant to this article was reported.