Association of Body Mass Index and Waist Circumference with Osteoarthritis among Korean Adults: A Nationwide Study
Article information

Abstract
Background
Evidence on the association between obesity parameters, including body mass index (BMI) and waist circumference (WC), and osteoarthritis is limited. This study aimed to investigate these associations in Korean adults.
Methods
This nationwide cross-sectional study used data from 24,101 adults aged ≥19 years who participated in the Korea National Health and Nutrition Examination Survey 2016–2020. Odds ratios (ORs) and 95% confidence intervals (CIs) for osteoarthritis according to BMI and WC were analyzed using multivariable logistic regression analyses.
Results
The prevalence of osteoarthritis was higher in individuals with general (10.0%) and abdominal obesity (12.8%) compared with those without. Greater BMI and WC were associated with a higher prevalence (P<0.001) and risk of osteoarthritis (Model 3, P for trend <0.001). Individuals with general and abdominal obesity were associated with a 1.50-fold (OR, 1.50; 95% CI, 1.35–1.67) and 1.64-fold (OR, 1.64; 95% CI, 1.47–1.84) increased risk of osteoarthritis, compared with those without. Similar associations were observed in subgroups according to age, sex, smoking status, and presence of diabetes mellitus. The odds of osteoarthritis 1.73-fold increased (OR, 1.73; 95% CI, 1.53–1.95) in individuals with both general and abdominal obesity compared with those without any of them.
Conclusion
Greater BMI, WC, and general and abdominal obesity were associated with an increased risk of osteoarthritis in Korean adults. Appropriate management of abdominal and general obesity may be important to reduce the risk of osteoarthritis.
INTRODUCTION
Osteoarthritis is a clinical syndrome of joint pain accompanied by functional limitation and reduced quality of life [1]. The knee is the most frequently affected site, and the prevalence of knee osteoarthritis has been estimated between 4.3% and 33% of the adult population, depending on the method of radiographic assessment in the United States [2]. In Korea, the prevalence of osteoarthritis is increasing and is 14.3% in individuals aged ≥50 years [3,4]. Osteoarthritis ranks second in the prevalence of chronic diseases after hypertension [5]. People with osteoarthritis often have a lower quality of life, particularly when accompanied by symptoms such as joint pain [6]. This may lead to physical disability, falls, and fractures, which are risk factors for death [6-8]. Therefore, early detection and appropriate management of osteoarthritis are necessary to prevent such disease complications. Proven risk factors for osteoarthritis include genetics, female sex, past trauma, advancing age, and obesity [9].
Obesity is known to be associated with metabolic syndrome, diabetes mellitus (DM), coronary heart disease, chronic obstructive pulmonary disease, as well as musculoskeletal conditions [10]. The global prevalence of obesity has tripled since 1980 [11]. The prevalence in Korea was recently reported as 36.3% [12] and is expected to be 61.5% for men and 37.0% for women by 2030 [13]. Obesity is considered one of the most important risk factors for osteoarthritis. However, most studies exploring the association between obesity and osteoarthritis have focused on symptomatic or radiological knee osteoarthritis [14], and few studies have considered other types of osteoarthritis. Moreover, previous studies have investigated the association, mainly using body mass index (BMI) to measure obesity [15]. While BMI is influenced by differences in lean mass [16], waist circumference (WC) measures body fat distribution and may be less affected by lean mass variations [17]. Furthermore, evidence on the associations between general and abdominal obesity and osteoarthritis in Asian populations is limited. We aimed to investigate the association between obesity parameters, including BMI and WC, and osteoarthritis in Korean adults using a nationally representative database.
METHODS
1. Source of Data and Study Participants
This study was based on the Korea National Health and Nutrition Examination Survey (KNHANES) 2016–2020. The KNHANES is a population-based cross-sectional survey of the health and nutritional status of the general Korean population. Since 1998, the Korea Centers for Disease Control and Prevention Agency has conducted surveys using a stratified, multistage, clustered probability design based on geographic area, sex, and age. The survey comprised a health questionnaire, physical and laboratory examinations, and nutritional assessments.
We initially considered 39,738 individuals who participated in the KNHANES 2016–2020, excluding those aged <19 years (n=7,610), those who had previously been diagnosed with tuberculosis, thyroid disease, liver cirrhosis, renal failure, or cancer (n=3,820), and those with missing data (n=4,207). Finally, data from 24,101 participants (10,910 men and 13,191 women) were included in the analysis. Written informed consent was obtained from all participants before the study began. The study protocol was approved by the Institutional Review Board of Korea University Anam Hospital, Seoul, Korea (approval no., 2021AN0419).
2. Anthropometric Measurement and Definition of General and Abdominal Obesity
Weight, height, and WC were measured with the participants wearing light clothing without shoes. BMI was calculated as the individual’s weight (kg) divided by the square of the height (m) [18]. The participants were categorized by five BMI groups: underweight (<18.5 kg/m2), normal weight (18.5–22.9 kg/m2), overweight (23.0–24.9 kg/m2), obesity (25.0–29.9 kg/m2), and severe obesity (≥30.0 kg/m2) based on the AsiaPacific BMI cut-offs recommended by the World Health Organization [19]. The WC was measured at the narrowest point between the lower borders of the rib cage and the iliac crest at the end of normal expiration. Abdominal obesity was defined as a WC ≥90.0 cm for men and ≥85.0 cm for women, which was determined for the Korean population [20]. The participants were categorized into five WC groups: (1) WC <80.0 cm in men and <75.0 cm in women, (2) 80.0–84.9 cm in men and 75.0–79.9 cm in women, (3) 85.0–89.9 cm in men and 80.0–84.9 cm in women, (4) 90.0–94.9 cm in men and 85.0–89.9 cm in women, and (5) WC ≥95.0 cm in men and ≥90.0 cm in women.
3. Definition of Osteoarthritis
The presence of osteoarthritis was determined by responding to the following self-reported question: “Have you ever been diagnosed with osteoarthritis by a doctor?”
4. Covariates
The socioeconomic status and health-related behaviors were measured using the self-report questionnaire. Education was categorized into two groups according to whether participants had ≥12 years of education or not. Household income levels were categorized into two groups: the lowest quartile and the second lowest to the highest quartile. Smoking status was divided into nonsmokers (ex-smokers and never-smokers) and current smokers. Alcohol drinkers were defined as those who consumed more than one drink per month. Regular exercise was defined as engaging in at least 150 minutes of moderate-intensity physical activity per week or at least 75 minutes of vigorous-intensity physical activity per week [21].
Blood pressure (BP) was measured twice at 5-minute intervals on the right arm by a mercury sphygmomanometer with participants sitting after resting for at least 10 minutes [22]. Venous blood samples were obtained in the morning after ≥8 hours of fasting. Fasting glucose, total cholesterol, triglycerides, high-density lipoprotein cholesterol, and low-density lipoprotein cholesterol were measured. Comorbidities, such as hypertension, DM, and dyslipidemia, were defined based on laboratory findings or diagnoses by physicians. Hypertension was defined as systolic/diastolic BP ≥140/90 mm Hg or a history of hypertension diagnosed by a doctor. DM was defined as fasting blood glucose ≥126 mg/dL or being diagnosed with DM by a doctor. Dyslipidemia was defined as serum total cholesterol ≥240 mg/dL or diagnosed with dyslipidemia by a doctor.
5. Statistical Analysis
Based on the complex sample design, we conducted all the analyses by assigning dispersed stratification estimates, stratification variables, and weighted sample values. The basic characteristics of the participants were compared according to the presence of osteoarthritis using an independent t-test for continuous variables and the chi-square test for categorical variables. Using a multivariable logistic regression analysis, we calculated the odds ratios (ORs) and 95% confidence intervals (CIs) to determine the associations of BMI and WC with osteoarthritis. Model 1 was not adjusted. Model 2 was adjusted for age, sex, household income, education, smoking status, alcohol consumption, and physical activity. Model 3 was additionally adjusted for hypertension, DM, and dyslipidemia to the variables in Model 2. We assessed the association of the combined presence of general and abdominal obesity with osteoarthritis using a multivariable logistic regression analysis. Stratified analyses were performed for sex, age, smoking status, and DM status. Statistical analyses were performed using the IBM SPSS software ver. 24.0 (IBM Corp., Armonk, NY, USA), as recommended by the user guidelines of the KNHANES. The statistical significance level was set at P<0.05.
RESULTS
1. Characteristics of Study Population
Table 1 presents the basic characteristics of the participants according to the presence or absence of osteoarthritis. The mean age was 65.4±0.3 years in individuals with osteoarthritis and 44.2±0.2 years in those without osteoarthritis. The prevalence of osteoarthritis was 10.7% (n=2,588) among the participants, and the prevalence in women was higher than in men. While the proportion of individuals with lower income and education was higher in individuals with osteoarthritis (P<0.001), the proportion of current smokers, alcohol drinkers, and regular exercisers was higher in individuals without osteoarthritis (P<0.001). The means of BMI and WC were 25.1±0.1 kg/m2 and 86.3±0.2 cm in the osteoarthritis group and 24.0±0.0 kg/m2 and 82.8±0.1 cm in the non-osteoarthritis group, respectively (P<0.001). The mean values of systolic BP and fasting glucose and the prevalence of comorbidities (hypertension, DM, and dyslipidemia) were higher in individuals with osteoarthritis than in those without osteoarthritis (P<0.001).

Characteristic of study participants
2. Prevalence of Osteoarthritis by General and Abdominal Obesity in Sex and Age Groups
In Figure 1, the prevalence of osteoarthritis was significantly higher in the group with general obesity than the group without in the total population, women, middle-aged, and older individuals (P<0.001). The prevalence of osteoarthritis was higher in the group with abdominal obesity than the group without in the total population, both sexes, middle-aged and older individuals (P<0.001).

Prevalence of osteoarthritis in the presence of general obesity (A) and abdominal obesity (B) in total, age, and sex groups. (A) The prevalence of osteoarthritis was higher in individuals with general obesity than in those without, across the total population, women, middle-aged, and older individuals (*P<0.001). (B) The prevalence of osteoarthritis was also higher in individuals with abdominal obesity than those without, across the total population, both sexes, middle-aged and older individuals (*P<0.001).
3. Associations between Obesity Parameters and Osteoarthritis
As shown in Table 2, the proportion of patients with osteoarthritis was higher in the groups with higher BMI and WC (P for trend <0.001), and the proportion was higher in individuals with general and abdominal obesity than in those without (P<0.001). After adjusting for confounding variables (Model 3), compared with individuals with a BMI of 18.5–22.9 kg/m2 (reference), the OR for osteoarthritis was 1.44-fold higher in those with a BMI of 23.0–24.9 kg/m2 (OR, 1.44; 95% CI, 1.24–1.67), 1.68-fold higher in those with a BMI of 25.0–29.9 kg/m2 (OR, 1.68; 95% CI, 1.47–1.92), and 2.11-fold higher in those with a BMI ≥30.0 kg/m2 (OR, 2.11; 95% CI, 1.68–2.65). The ORs for osteoarthritis significantly increased in the higher BMI groups (P for trend <0.001).

Associations between obesity parameters and osteoarthritis
Likewise, after adjusting for confounding variables (Model 3), compared with individuals with a WC of 80.0–84.9 cm in men and 75.0–79.9 cm in women (reference), the OR for osteoarthritis was 1.30-fold higher in those with a WC of 85.0–89.9 cm in men and 80.0–84.9 cm in women (OR, 1.30; 95% CI, 1.08–1.56), 1.63-fold higher in those with a WC of 90.0–94.9 cm in men and 85.0–89.9 cm in women (OR, 1.63; 95% CI, 1.35–1.96), and 1.86-fold higher in those with a WC ≥95.0 cm in men and ≥90.0 cm in women (OR, 1.86; 95% CI, 1.56–2.20). The ORs for osteoarthritis significantly increased in the higher WC groups (P for trend <0.001).
4. Associations of Combined Presence of General and Abdominal Obesity with Osteoarthritis
In Figure 2, compared with individuals who had neither general nor abdominal obesity, the OR for osteoarthritis was highest in those with both general and abdominal obesity (OR, 1.73; 95% CI, 1.53–1.95), followed by those with only abdominal obesity (OR, 1.54; 95% CI, 1.26– 1.87) and then by those with only general obesity (OR, 1.21; 95% CI, 0.98–1.50) (P<0.001).
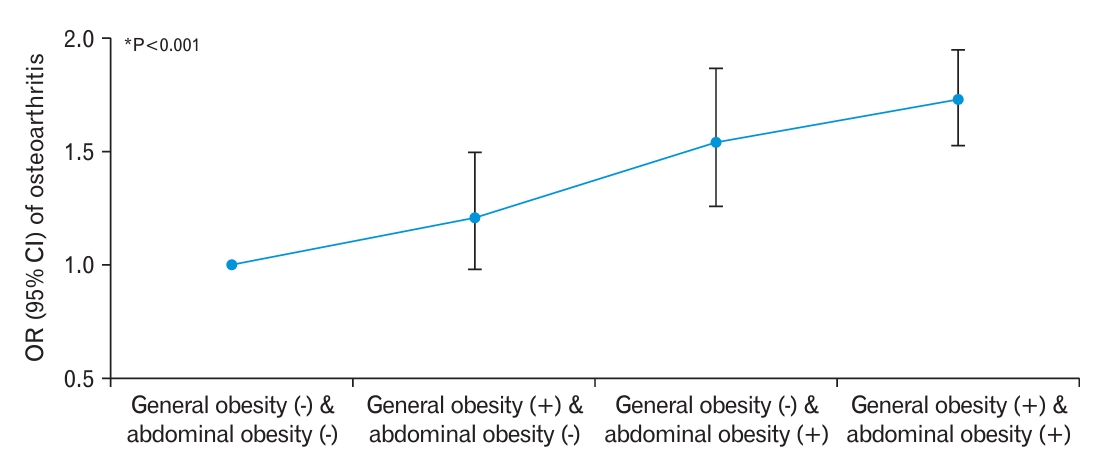
Associations of the combined presence of general and abdominal obesity with osteoarthritis. The odds of osteoarthritis were highest in individuals with general and abdominal obesity (odds ratio [OR], 1.73; 95% confidence interval [CI], 1.53–1.95), followed by those with only abdominal obesity (OR, 1.54; 95% CI, 1.26–1.87), and then those with only general obesity (OR, 1.21; 95% CI, 0.98–1.50) (*P<0.001).
5. Subgroup Analysis
Table 3 shows the results of the stratified analyses according to sex, age, smoking status, and presence of DM. Significantly positive associations between general or abdominal obesity and osteoarthritis were observed in all subgroups except in individuals aged 19–39 years. Although the associations between obesity and the risk of osteoarthritis did not differ between the subgroups (all Ps for interaction >0.05), the ORs for osteoarthritis in individuals with general or abdominal obesity compared with those without were greater among women, older individuals, and those without DM than among the other groups.

Subgroup analysis
DISCUSSION
This nationwide study with a large sample size showed a positive association between general and abdominal obesity and the risk of osteoarthritis among Korean adults. Dose-responsive associations were also observed between BMI and WC and the prevalence and risk of osteoarthritis. In addition, the combined presence of general and abdominal obesity was associated with a 1.73-fold higher risk of osteoarthritis compared with those without either of them. Our results suggest that general and abdominal obesity may be important factors for osteoarthritis among adults. Abdominal obesity and the combined presence of both types of obesity may play a greater role in osteoarthritis than general obesity. Preventing and managing general and abdominal obesity may help reduce the risk of developing osteoarthritis.
Previous studies have demonstrated associations between BMI and osteoarthritis in Western countries with a high prevalence of obesity. A UK study found that compared with normal-weight subjects, the ORs for osteoarthritis were 2.3 and 7.5 times higher in individuals who are overweight and obese based on BMI [23]. A study conducted in South Korea revealed that BMI was significantly associated with an increased risk of osteoarthritis in the older population [24]. Additionally, another study found that general and abdominal obesity were associated with an increased risk of knee osteoarthritis, with the risk being highest when the two types of obesity coexist [25]. However, evidence on the association between abdominal obesity and osteoarthritis remains insufficient. Our study showed that the proportion of patients with osteoarthritis was higher in the groups with an increased WC and BMI (both P for trend <0.001) (Table 2). As shown in Figure 2, compared with those without general or abdominal obesity, the risk of osteoarthritis was highest in individuals with both types of obesity and significantly higher in those with abdominal obesity only. Our findings provide additional evidence that abdominal obesity may be a modifiable and independent risk factor for overall osteoarthritis.
Possible mechanisms between obesity and osteoarthritis may be linked to mechanical and metabolic changes in joint structure among adults with obesity [26]. Excessive weight can stress the joint beyond biological capabilities, resulting in degenerative change [27,28], and weight loss may help reduce the symptoms and progression of osteoarthritis [29]. Loss of 10% of body weight is recognized as a fundamental and essential component for managing patients with obesity and osteoarthritis and can lead to significant improvement in pain relief, physical function, and health-related quality of life [29]. Abdominal obesity puts extra stress on the joints and triggers inflammation from adipokines, which can accelerate the breakdown of cartilage. Adipocytes produce and release adipokines (such as leptin), which can cause direct and downstream effects, destroying and remodeling joint tissue [26,30]. Therefore, using WC as a surrogate parameter for abdominal obesity may help reduce the risk of osteoarthritis.
In the subgroup analysis, although the associations between obesity and osteoarthritis did not differ between subgroups stratified by sex, age, smoking status, and the presence of DM, a positive association between general and abdominal obesity and osteoarthritis was observed in women and older age groups. This implies that abdominal obesity, as well as general obesity, may contribute to a higher risk of osteoarthritis, particularly in women. Furthermore, the detrimental effects of obesity on joint health are more pronounced in older age groups, leading to an increased risk of osteoarthritis. The positive associations observed in women and older age groups highlight the need for targeted interventions and preventive measures to mitigate the impact of obesity on osteoarthritis risk in these populations.
Our study has several limitations. First, the causal relationship between general and abdominal obesity with osteoarthritis cannot be determined because of the cross-sectional design. Second, possible effects from confounding variables exist, such as genetic factors, occupational and recreational usage, and joint malalignment [1], which were unavailable in the KNHANES data. Third, although osteoarthritis was defined based on a diagnosis by a physician, data on specific sites and severity of osteoarthritis could not be obtained from the database. Despite these limitations, our findings are the first population-based study to reveal the associations between BMI, WC, and osteoarthritis in the South Korean population. Thus, these nationally representative samples support the validity of our findings, allow us to make comprehensive adjustments for confounding variables, and perform several subgroup analyses. We also showed an association between abdominal obesity and the combined presence of general and abdominal obesity and the risk of osteoarthritis. Further research is warranted to confirm and expand upon our findings and investigate the underlying mechanisms driving the observed associations between obesity and osteoarthritis in specific subgroups.
In conclusion, this large-scale nationwide study found dose-responsive positive associations between BMI and WC and the risk of osteoarthritis and that general and abdominal obesity were associated with an increased risk of osteoarthritis in South Korean adults. Our findings indicate that appropriately managing abdominal and general obesity may be important for preventing osteoarthritis.
Notes
CONFLICT OF INTEREST
No potential conflict of interest relevant to this article was reported.
FUNDING
This study was supported by the 2022 JOMES Research Grant (grant no., KSSO-J-2021002) of the Korean Society for the Study of Obesity (Youn Huh) and supported by a Korea University Grant (Ga Eun Nam).