Association of Lipoprotein(a) with Progression of Coronary Artery Calcification: Retrospective Longitudinal Study
Article information

Abstract
Background
Atherosclerotic cardiovascular disease (ASCVD) is a major health concern, and lipoprotein(a) (Lp(a)) is an independent risk factor. However, there is limited evidence regarding Lp(a) and the risk of ASCVD in Asian populations. This study aimed to assess the predictive value of changes in coronary artery calcification (CAC) for ASCVD risk associated with Lp(a) level.
Methods
Participants (n=2,750) were grouped according to their Lp(a) levels, and the association between Lp(a) and CAC progression was examined. CAC progression was defined as the occurrence of incident CAC or a difference ≥2.5 between the square root (√) of baseline and follow-up coronary artery calcium scores (CACSs) (Δ√transformed CACS). To adjust for differences in follow-up periods, Δ√transformed CACS was divided by the follow- up period (in years).
Results
Over an average follow-up of 3.07 years, 18.98% of participants experienced CAC progression. Those with disease progression had notably higher Lp(a) levels. Higher Lp(a) tertiles correlated with increased baseline and follow-up CACS, CAC progression (%), and Δ√transformed CACS. Even after adjustment, higher Lp(a) levels were associated with CAC progression. However, annualized Δ√transformed CACS analysis yielded no significant results.
Conclusion
This study demonstrated an association between elevated Lp(a) levels and CAC progression in a general population without ASCVD. However, longer-term follow-up studies are needed to obtain meaningful results regarding CAC progression. Further research is necessary to utilize Lp(a) level as a predictor of cardiovascular disease and to establish clinically relevant thresholds specific to the Korean population.
INTRODUCTION
Lipoprotein(a) (Lp(a)) was discovered by Berg et al. [1] in 1963. It consists of a lipid core composed of cholesterol esters and triglycerides, apolipoprotein B-100 (apoB-100), and the distinctive structure of apolipoprotein(a) (apo(a)). Apo(a) and apoB-100 are covalently bound through a disulfide linkage [2].
The plasma levels of Lp(a) are primarily determined by the LP(a) gene located on chromosome 6q26-27 [3], and the subunit repeat pattern of kringle IV in apo(a) explains the variability in Lp(a) concentrations [4]. Plasma Lp(a) levels exhibit different tendencies according to race, with generally higher levels observed in individuals of African descent and lower levels in Asians [5].
Lp(a) contributes to the development of atherosclerotic cardiovascular disease (ASCVD) risk through three main mechanisms. First, as a low-density lipoprotein (LDL)-like particle containing apo(a), Lp(a) poses risks that can occur with LDL (pro-atherogenic). Second, the characteristic structure of apo(a) kringle domains can induce inflammatory responses, and inflammatory reactions can also occur because of oxidized phospholipids transported by Lp(a) (pro-inflammatory). Third, owing to the structural similarities between the kringle domains of apo(a) and plasminogen, plasminogen activity and generation are reduced, promoting blood clotting and thrombotic effects (prothrombotic). Therefore, Lp(a) can potentially increase the risk of atherosclerosis more than LDL [6].
Lp(a) level is an independent risk factor for ASCVD [7-11] and aortic valve disease [12,13]. Based on scientific evidence, recent guidelines recommend measuring Lp(a) at least once in a lifetime to assess the risk of cardiovascular disease (CVD) [14,15]. The recommended targets for testing are individuals with Lp(a) levels ≥180 mg/dL (or >95th percentile). The reason for testing is to identify individuals with heterozygous familial hypercholesterolemia, as they have a similar risk of ASCVD. Additionally, testing is recommended for individuals with a family history of early-onset CVD or those with a moderate-to-high risk of CVD. The purpose of testing is to stratify additional risks and determine treatment strategies for individuals at the risk threshold.
Rubenfire et al. [16] suggested that the threshold for Lp(a) indicating a high risk of ASCVD requiring treatment is ≥50 mg/dL. Findings from the Copenhagen City Heart Study (CCHS) also showed that elevated Lp(a) levels (80th percentile or >47 mg/dL) significantly increased the risk of CVD events compared to traditional CVD risk factors alone [8]. However, these values are primarily based on studies conducted in the United States and Europe, and there is a lack of evidence from large-scale observational studies focusing on Asian populations.
In 2023, Kim et al. [17] conducted a study on the relationship between Lp(a) levels and cardiovascular mortality in Korean adults. The results showed that adults with Lp(a) levels above 50 mg/dL had a 20% increase in overall mortality and an 83% increase in cardiovascular mortality compared to adults with Lp(a) levels below 50 mg/dL.
The Agatston coronary artery calcium score (CACS), first developed in 1990, is a powerful marker of calcified coronary artery plaques [18]. It is independently associated with ASCVD [19] and has been shown in the Multi-Ethnic Study of Atherosclerosis (MESA) in the United States to better predict future cardiovascular events than carotid artery intima-media thickness [20]. Recent guidelines also recommend the use of coronary artery calcium scoring as a key tool for personalized risk management in the primary prevention of ASCVD [14,21].
Furthermore, coronary artery calcification (CAC) progression has been revealed to be a stronger predictor of CVD mortality compared to baseline CACS or traditional cardiovascular risk factors [22]. The process of atherosclerosis is highly dynamic, making it more effective to track changes in CAC progression rather than compare baseline CACSs for predicting the risk and prognosis of ASCVD [23].
Therefore, this study aimed to investigate the correlation between Lp(a) levels and CAC progression in an asymptomatic general population with no known CVD.
METHODS
1. Study Population
This study included a total of 2,801 adult participants aged ≥21 years who visited a health promotion center at the Samsung Changwon Hospital for health checkups from January 2017 to December 2020. These participants underwent serum Lp(a) measurements and multidetector computed tomography (MDCT) at least twice. Among them, 29 individuals with cardiovascular conditions such as angina, myocardial infarction, heart failure, arrhythmia, and valvular heart disease; nine with cerebrovascular conditions such as ischemic stroke and transient ischemic attack; and 13 non-responders were excluded. Therefore, this retrospective longitudinal analysis focused on 2,750 participants.
Written informed consent was obtained from all participants before the study. This study was conducted with the approval of the Institutional Review Board (IRB) of the Samsung Changwon Hospital (IRB no., SCMC 2023-07-003).
2. Anthropometric Measurement and Laboratory Assessment
All adult participants who visited the health promotion center completed a pre-screening questionnaire, which included questions regarding sociodemographic factors, lifestyle habits (alcohol consumption, smoking, and regular exercise), personal medical history, and treatment status (hypertension, diabetes, and hyperlipidemia). The smoking status was classified into two groups: current smokers and nonsmokers. Alcohol consumption was divided into two categories: no alcohol consumption and alcohol consumption at least once per week. Exercise was classified into an exercise group (engaging in moderate-intensity physical activity for at least 30 minutes, 3 or more times per week) and a non-exercise group (engaging in physical activity below this threshold).
Height and weight were measured using an automated device (BSM330; Biospace Co., Seoul, Korea). Body mass index (BMI) was calculated by dividing the weight (kg) by the square of height (m). The waist circumference measurement was taken at the midpoint between the lower edge of the rib cage and the iliac crest. Blood pressure was measured using an automated blood pressure monitor with a cuff that could encircle more than 80% of the upper arm circumference positioned at heart level. Participants were instructed to sit in a relaxed position for at least 10 minutes before the blood pressure measurement. Systolic and diastolic blood pressures were measured in a seated position, and a repeat measurement was performed 5 minutes later, with the average value used for analysis.
Blood samples were collected after a minimum fasting period of 8 hours. Fasting blood glucose, glycosylated hemoglobin (HbA1c), total cholesterol, LDL cholesterol (LDL-C), high-density lipoprotein cholesterol (HDL-C), triglycerides (TG), high-sensitivity C-reactive protein, and uric acid levels were measured.
3. Evaluation of Insulin Resistance
Insulin resistance was assessed using the triglyceride glucose index (TyG index), which was calculated using the following formula: ln [fasting triglycerides (mg/dL)×fasting plasma glucose (mg/dL)/2].
4. Measurement of Lipoprotein(a)
Serum Lp(a) levels were measured by using a high-sensitivity immunoturbidimetric assay with a Roche analysis module system (Cobas 8000 c702; Roche Diagnostics, Mannheim, Germany). The measurable concentration range was 3–180 mg/dL, and concentrations below this range were recorded as 3 mg/dL.
5. Measurement of Coronary Artery Calcium Score
Images were acquired using a 64-section MDCT scanner (SOMATOM Definition AS+Excel Edition; Siemens, Munich, Germany) in the non-contrast-enhanced mode. Calcifications were defined as areas showing an attenuation of 130 Hounsfield units (HU) or higher along the course of the coronary arteries. The measurement was based on the scoring system proposed by Agatston et al. [18], and a CACS >0 was defined as CAC.
The definition of CAC progression was as follows: (1) If the baseline CACS=0, progression was defined as a follow-up CACS >0, or (2) If the baseline CACS >0, progression was defined as a difference ≥2.5 between the square roots (√) of the baseline and follow-up CACS (Δ√transformed CACS) taking into account the variability between scans [24].
To adjust for differences in the duration of follow-up examinations, the Δ√transformed CACS was divided by the duration of follow-up (in years) and used for analysis (annualized Δ√transformed CACS).
6. Statistical Analysis
To reduce bias in the data, we added 1 to the CACS value and converted it to a logarithm. To examine the characteristics of the participants, we presented the frequency and percentage of categorical variables according to the Lp(a) quartiles and conducted a chi-square test. For continuous variables, we presented the mean±standard deviation or median (Q1–Q3) and conducted an analysis of variance or the Kruskal-Wallis test (Table 1). To compare the degree of CAC progression, the participants were divided into two groups: a CAC progression group and a non-progression group. We presented the frequencies and percentages of categorical variables and conducted a chi-square test. For continuous variables, we conducted t-tests or Mann-Whitney U tests to present and analyze the mean±standard deviation or median (Q1–Q3) (Table 2). Logistic regression analysis was used to examine the correlation and odds ratio (OR) (95% confidence interval [95% CI]) between Lp(a) levels and CAC progression (Table 3). Linear regression analysis was conducted to examine the correlation and regression coefficient (95% CI) between the level of Lp(a) and the Δ√transformed CACS (Table 4). In model 1, an unadjusted analysis was performed, whereas in model 2, adjustments were made for age and sex. Model 3 included additional adjustments for smoking, exercise, and alcohol consumption, based on the variables adjusted in model 2. Model 4 was further adjusted for the presence of hypertension, diabetes, and hyperlipidemia, based on the variables adjusted in model 3. The analysis was conducted using Stata ver. 15.1 (Stata Corp., College Station, TX, USA), and a significance level of P<0.05 was used as the threshold.

Baseline characteristics according to lipoprotein(a) tertiles

Baseline characteristics of participants by change in CACS at follow-up
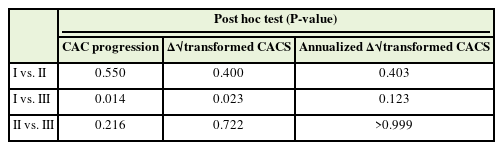
Post hoc analysis in Figure 2

Coronary artery calcification progression according to lipoprotein(a) tertiles
RESULTS
1. Distribution of Lipoprotein(a) in the Study Population
The distribution of Lp(a) was significantly skewed towards lower concentrations, ranging from 3 to 165.6 mg/dL. The median (50th percentile) was 7.96 mg/dL, 80th percentile was 23.47 mg/dL, and 95th percentile was 60.33 mg/dL (Figure 1).

Distribution of lipoprotein(a) concentration.
2. Clinical Characteristics of the Study Population according to Lipoprotein(a) Tertiles
In total, 2,750 participants were included in the study, including 2,344 males (85.24%) and 406 females (14.76%). The mean age was 45.24±6.96 years. The participants were stratified into three groups (T1, T2, and T3) based on their Lp(a) levels.
The mean Lp(a) level of the entire population was 16.21±20.99 mg/ dL, while the values for T1, T2, and T3 were 3.33±0.52 mg/dL, 8.44±2.66 mg/dL, and 36.90±25.73 mg/dL, respectively. As serum Lp(a) levels increased from the 1st to the 3rd tertile, age and total cholesterol, LDL-C, and HDL-C levels showed an increasing trend. In contrast, height, weight, BMI, waist circumference, TG, smoking history, insulin resistance as indicated by the TyG index, and uric acid levels showed a decreasing trend. However, there were no significant differences among the groups in terms of comorbidities, such as diabetes, hypertension, and hyperlipidemia, as well as alcohol consumption and exercise habits (Table 1).
3. Comparison of Variables according to Coronary Artery Calcification Progression
Among the study participants, 522 (18.98%) experienced CAC progression. When comparing the baseline characteristics between the CAC progression and no-progression groups, the CAC progression group had a higher average age and a higher likelihood of being male. Additionally, these participants had significantly higher height, weight, BMI, waist circumference, and blood pressure than those in the noprogression group. Fasting blood glucose, HbA1c, TyG index, and uric acid levels were also higher in participants with CAC progression. Furthermore, the mean serum Lp(a) level was significantly higher in participants with CAC progression than in those without progression (15.53±19.87 versus 19.09±25.02, P<0.001) (Table 2).
4. Coronary Artery Calcification Progression according to Lipoprotein(a) Tertile Levels
The mean follow-up period was 3.07±6.57 years, and there were no significant differences among the three groups. Baseline CACS, Follow-up CACS, incidence of CAC progression, and Δ√transformed CACS increased as Lp(a) tertiles increased, and this increase was statistically significant. However, when considering the follow-up period, annualized Δ√transformed CACS also increased as Lp(a) tertiles increased, but it did not show a statistically significant difference (Table 1, Figure 2).

Change of coronary artery calcification (CAC) according to lipoprotein(a) tertiles. (A) CAC progression (%) according to lipoprotein(a) tertiles (P=0.024). (B) Δ√transformed coronary artery calcium score (CACS) according to lipoprotein(a) tertiles (P=0.028). (C) Annualized Δ√transformed CACS according to lipoprotein(a) tertiles (P=0.107). CAC progression, incidence CAC or difference of ≥2.5 units between the baseline and follow-up square root of CAC score (Δ√transformed CACS); Annualized Δ√transformed CACS, Δ√transformed CACS/follow-up period.
Regarding post hoc analysis to examine differences between individual groups, the CAC progression rate for the Lp(a) 3rd tertile was relatively higher at 21.64% than that for the 1st quartile at 16.68% (P=0.014). Additionally, the Δ√transformed CACS for the Lp(a) 3rd tertile was relatively higher at 0.98 than that for the 1st quartile at 0.69 (P=0.023). However, there were no significant differences in CAC progression rate or Δ√transformed CACS between the 1st and 2nd tertiles, as well as between the 2nd and 3rd tertiles (Table 3).
5. Association between Coronary Artery Calcification Progression and Lipoprotein(a) Tertiles
When using the 1st tertile (T1) of serum Lp(a) as the reference, the OR for CAC progression in T3 was higher (OR, 1.38; 95% CI, 1.09 to 1.74), with a statistically significant P-value for trend of 0.007. Even after adjusting for confounding variables such as age, sex, smoking status, regular exercise, alcohol consumption, hypertension, hyperlipidemia, and diabetes as an underlying disease, T3 still showed a significant association with respective ORs of 1.31 (95% CI, 1.03 to 1.68), 1.31 (95% CI, 1.03 to 1.67), and 1.33 (95% CI, 1.04 to 1.70) (P=0.026, P=0.028, and P=0.023, respectively). The ORs progressively increased from T1 to T3; however, T2 did not show a statistically significant association (Table 4).
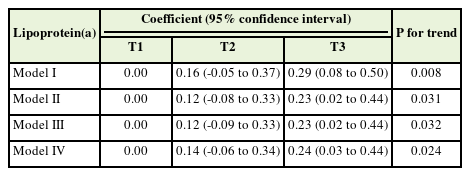
6. Association between Δ√Transformed Coronary Artery Calcium Score and Lipoprotein(a) Tertiles
When using the first tertile (T1) of serum Lp(a) levels as a reference, the regression coefficient for T3 was higher compared to that for T1 (coefficient, 0.29; 95% CI, 0.08 to 0.50), and the coefficient ratio had a statistically significant P-value for trend of 0.008. Even after adjusting for confounding variables such as age, sex, smoking status, regular exercise, alcohol consumption, hypertension, dyslipidemia, and underlying diabetes, the regression coefficients for T3 remained significantly, with values of 0.23 (95% CI, 0.02 to 0.44), 0.23 (95% CI, 0.02 to 0.44), and 0.24 (95% CI, 0.03 to 0.44) (P=0.031, P=0.032, and P=0.024, respectively). There was an increasing trend in the coefficient ratios from T1 to T3; however, T2 did not show any statistical significance (Table 5).
Δ√Transformed coronary artery calcium score according to lipoprotein(a) tertiles
7. Association between Annualized Δ√Transformed Coronary Artery Calcium Score and Lipoprotein(a) Tertiles
When the first tertile (T1) of serum Lp(a) levels was used as a reference, the regression coefficients for T2 and T3 were not associated. Even after adjusting for confounding variables such as age, sex, smoking status, regular exercise, alcohol consumption, hypertension, dyslipidemia, and underlying diabetes, the coefficient ratio increased from T1 to T3, but the difference was not statistically significant (Table 6).

Annualized Δ√transformed coronary artery calcium score according to lipoprotein(a) tertiles
DISCUSSION
This study analyzed the association between baseline Lp(a) levels and the progression of CAC over an average follow-up period of 3.07 years in a general population sample of adults aged ≥21 years in Korea. The study findings showed that the group with CAC progression had significantly higher average serum Lp(a) levels than the group without progression. When stratifying Lp(a) levels into three groups, there was a statistically significant increase in CAC progression and Δ√transformed CACS from the highest Lp(a) tertile compared to the lowest Lp(a) tertile. This trend persisted even after adjusting for age, sex, lifestyle factors (smoking, alcohol consumption, and exercise), and medical history (hypertension, diabetes, and dyslipidemia). On the other hand, in the analysis of annualized Δ√transformed CACS, adjusted for differences in follow-up periods, statistically significant results were not obtained.
A recent publication presented findings from the MESA cohort study, which investigated the association between Lp(a) and other lipid biomarkers and CAC progression (Agatston score, volume, and density) at baseline and during follow-up observations in individuals without recent clinical ASCVD [25]. When adjusting for the follow-up period in this study, no significant correlation was observed between Lp(a) levels during short-term follow-up observations (mean 2.4 years) and the progression of CAC volume, consistent with the findings of our study. However, in the long-term follow-up period (mean 9.5 years), there was a significant association between Lp(a) levels and the progression of CAC volume (OR, 1.11; 95% CI, 1.03 to 1.21). The lack of significant results in the analysis of annualized Δ√transformed CACS in our study is likely due to the relatively short mean follow-up period of approximately 3 years. This is a limitation of our study that indicates the need for long-term follow-up studies to complement this aspect.
Insulin resistance is a substantial risk factor for ASCVD [26], and the TyG index is a reliable surrogate marker for insulin resistance [27]. In this study, we observed a statistically significant increase in the TyG index in the group with CAC progression compared with that in the group without CAC progression. These findings are consistent with those of previous studies investigating the utility of the TyG index as a predictive indicator of CVD risk associated with insulin resistance.
In contrast, in this study, as the tertiles of Lp(a) level increased, the TyG index decreased significantly. The inverse association between serum Lp(a) levels and the risk of type 2 diabetes has attracted considerable attention in large-scale studies such as the Women’s Health Study and the CCHS [28]. In a large cross-sectional study of 25,000 Chinese individuals, low Lp(a) levels were also found to be associated with an increased risk of prediabetes and insulin resistance [29]. The mechanism underlying this association remains uncertain, but a plausible hypothesis is that the genetic diversity related to Lp(a) levels, primarily determined by genetic mechanisms, is in an imbalanced relationship with genes that protect against insulin resistance [30].
In this study, the 95th percentile of Lp(a) concentration was found to be 60.33 mg/dL, and the 80th percentile was 23.47 mg/dL. Considering that approximately 20% of the European population (80th percentile) has an Lp(a) concentration exceeding 50 mg/dL [31], a difference in the distribution of Lp(a) concentration between Americans/Europeans and Koreans can be observed.
Based on the results of previous studies, in the case of the United States and Europe, a significant increase in the risk of fatal ASCVD has been observed among study participants with Lp(a) levels above the 80th percentile. Therefore, a threshold Lp(a) level of 50 mg/dL was proposed for treatment purposes.
In a study conducted by Kim et al. [17] on the relationship between Lp(a) levels in 275,430 healthy Korean adults and CVD mortality, a threshold value of 26.3 mg/dL for Lp(a) was proposed, which was found to affect the CVD mortality rate. Considering that the 80th percentile of Lp(a) concentration in this study’s participants was 23.47 mg/dL, this finding is consistent with that of Kim et al. [17]. However, the aforementioned study had a very small number of deaths and focused on healthy young adults, which limited the determination of the threshold value for Lp(a), as the participants had a relatively low CVD risk.
This study had several limitations. This was a retrospective longitudinal study, and potential confounding factors were not completely controlled. In other words, during the follow-up period from the initial health examination to the subsequent examination, the participants’ health behaviors (smoking, drinking, exercise, diet, etc.) were not controlled or monitored, which could have led to variations in the test indicators. The study may have a selection bias, as it focused only on individuals who underwent Lp(a) and MDCT repeatedly, which were not included in the routine screening. In addition, genetic variations in Lp(a) associated with ASCVD risk were not considered. Although this study used a definition of CAC progression, there was no consensus on the optimal method for quantifying CAC changes. Finally, although CAC progression is an excellent surrogate marker for predicting ASCVD, it should be noted that this study confirmed CAC progression as an outcome rather than an actual CVD event.
Despite these limitations, this study demonstrates the potential to predict the risk of future ASCVD occurrence using non-invasive and easily measurable CACSs and Lp(a) concentrations through blood tests in asymptomatic general populations without CVDs. This is a meaningful study in the context of a lack of related domestic research.
Furthermore, by measuring Lp(a) levels in healthy individuals without other traditional cardiovascular risk factors, we were able to identify previously undetected high-risk patients and provide them with opportunities for proactive lifestyle modifications and early management of risk factors.
However, longer-term follow-up studies are needed to obtain meaningful results regarding CACS progression while considering the follow-up period. Additionally, to utilize Lp(a) as a predictor of CVD, domestic research is needed to confirm its association with other predictors of CVD besides CACS.
Future studies that are clinically relevant to the Korean population are necessary to identify the threshold values that indicate an increased risk of CVD. Additionally, subsequent studies are warranted to determine whether proactive lifestyle modifications and early management of risk factors in individuals with Lp(a) levels above the threshold value yield significant results in the prevention of CVD.
Notes
CONFLICT OF INTEREST
No potential conflict of interest relevant to this article was reported.