Misinterpreting Odds Ratio in the Articles Published in Korean Journal of Family Medicine
Article information
Abstract
Background
In reporting results of case-control studies, odds ratios are useful methods of reporting findings. However, odds ratios are often misinterpreted in the literature and by general readers.
Methods
We searched all original articles which were published in the Korean Journal of Family Medicine from 1980 to May 2011 and identified those that report "odds ratios." Misinterpretation of odds ratios as relative risks has been identified. Estimated risk ratios were calculated when possible and compared with odds ratios.
Results
One hundred and twenty-eight articles using odds ratios were identified. Among those, 122 articles were analyzed for the frequency of misinterpretation of odds ratios as relative risks. Twenty-two reports out of these 122 articles misinterpreted odds ratios as relative risks. The percentage of misinterpreting reports decreased over years. Seventy-seven reports were analyzed to compare the estimated risk ratios with odds ratios. In most of these articles, odds ratios were greater than estimated risk ratios, 60% of which had larger than 20% standardized differences.
Conclusion
In reports published in the Korean Journal of Family Medicine, odds ratios are frequently used. They were misinterpreted in part of the reports, although decreasing trends over years were observed.
INTRODUCTION
In reporting the results of medical studies, relative risk is one of the most standard reporting methods.1) Relative risk is a scale showing how many times higher the incidence of an event is in the group exposed to the risk factors of the event than in the group not exposed by calculating the ratio of the incidence in the exposed group to that in the non-exposed group.2) Odds ratio is a scale used often in medical research reports because it has a number of useful characteristics. First of all, odds ratio provides uniform (regular) values in both retrospective and prospective studies.2,3) Unlike relative risk, odds ratio treats the two variables being compared symmetrically, and can be estimated using some type of non-random samples. For this reason, many case-control studies report odds ratio.
In order to calculate relative risk accurately, the incidence of an event should represent the proportion in the general population. That is, the research should be conducted with a sample having high representativeness for the general population. In reality, however, clinical studies are conducted with samples obtained through convenient sampling at a specific hospital and therefore it may be difficult to get relative risk in most small-scale studies.2,3)
According to a series of simulations, odds ratio is almost the same as relative risk in rare diseases.4,5) Moreover, odds ratio can be derived easily even through more complicated calculation under the condition that confounding variables are controlled as in logistic regression analysis.6)
Odds ratio has highly useful and convenient aspects, but still it has limitations compared to relative risk.3) Relative risk itself allows intuitive interpretation. That is, if the relative risk is A, we can say "the risk of an event is A times higher in those exposed to certain risk factors: than in unexposed ones." Because odds ratio is just 'ratio of odds' it may not be interpreted intuitively.2,3)
When readers need to determine the effect of exposure to a risk factor on the incidence of a specific event, they may want to know relative risk.3) In addition, odds ratio is easily mistaken for relative risk by lay people or media personnel without expert knowledge about the definitions of relative risk and odds ratio or difference between the two concepts. Odds ratio is reported in many newspaper articles on academic studies, and many of them are misinterpretations of relative risk. For example, a research result saying "The odds ratio for disease A is B if one eats C" is often described wrongly as "The risk of disease A increases B times higher if one eats C much." Even in some theses, odds ratio is mistaken for relative risk. As mentioned above, however, in order for odds ratio to be similar to relative risk, the odds ratio should be close to 1 or the incidence of the event should be low.4,5) According to Zhang and Yu,1) if P0, namely, the incidence of an event in the non-exposed group is higher than 0.1 or the odds ratio is higher than 2.5 or lower than 0.5, difference between the odds ratio and the relative risk is expected to be large. Thus, although odds ratio should not be mistaken for relative risk,1) such a mistake can be made easily and this may lead to wrong interpretation and application of research results.3)
Thus, this study purposed to analyze cases that used and misinterpreted odds ratio among theses published in the Korean Journal of Family Medicine during the period from 1980 when the journal began to be published, to the present as of May 2011. In this study, we counted the frequency of cases misinterpreting odds ratio as relative risk, estimated relative risk using odds ratio and the incidence of disease in the group not exposed to risk factors,1) and assessed difference between the odds ratio and the estimated relative risk. The objective of this study was 1) to investigate cases misinterpreting odds ratio, 2) to assess difference between odds ratio and estimated relative risk when possible.
METHODS
For this study, we searched the online site of the Korean Journal of Family Medicine and obtained research papers published during the period from 1980 to May 2011.7) The search keyword was 'odds ratio.' For theses before 1994, we manually searched the Korean Journal of Family Medicine.
Two independent authors read the titles and abstracts of the collected theses and selected only original articles. From the original articles, those whose text was available were selected and their texts were examined. Then, we 1) selected theses in which odds ratio was misinterpreted as relative risk and analyzed the percentage, and 2) separated theses for which estimated relative risk was calculable and analyzed them separately. As estimated relative risk was calculable only when P0 (the incidence of disease in the group not exposed to risk factors) was reported or when it could be derived from data presented in the theses, we excluded theses for which estimated relative risk was not calculable from the analysis that required the estimation of relative risk.
In comparison with the total number of theses using odds ratio, we evaluated the yearly and overall frequencies of cases misinterpreting odds ratio as relative risk. Odds ratio is defined as follows.
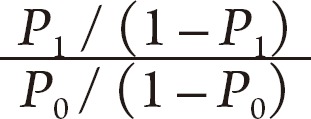
Where, P0 is the incidence of disease in the group not exposed to risk factors and P1 is that in the exposed group. For odds ratio, however, we used the value reported in the theses as in the research by Holcomb et al.3) and if correction was made for confounding variables the final corrected value was used.
Estimated relative risk was calculated by the method proposed by Zhang and Yu1) in 1998. The formula is as follows.

Where, P0 means the incidence of disease in the unexposed group. The validity of this formula was proven in a simulation using virtual cohorts, and as expected, the difference between odds ratio and relative risk was larger when P0 was high.1) In order for odds ratio to be similar to relative risk, the incidence of disease should be low. This formula can be applied to prospective cohort studies and clinical trials, and to retrospective studies with known prevalence.4,5)
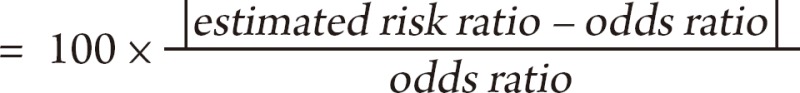
In order to assess differences between odds ratio and relative risk, we expressed odds ratios and estimated relative risks for all theses in which estimated relative risk was calculable on a scatter plot using odds ratio and estimated relative risk as axes X and Y, respectively, and then obtained the difference between odds ratio and estimated relative risk using the equation below.
Difference (%) between odds ratio and estimated relative risk
If multiple odds ratios were presented in a thesis, the representative odds ratio was selected by criteria as follows: 1) odds ratio presented as a major research result in the abstract, introduction or method of the thesis; 2) odds ratio presented as a major research result in the results or conclusions of the thesis; 3) the only statistically significant odds ratio if there is no value falling under 1) or 2); and 4) the largest odds ratio if there is no value falling under 1), 2) or 3). If there is an odds ratio lower than 1 and another higher than 1, the equation below was used in order to find the largest odds ratio.
|log10 (odds ratio)|
RESULTS
After searching theses published in the Korean Journal of Family Medicine during the period from 1980 to May 2011, a total of 128 theses were found to report odds ratio. Among them, 6 were excluded because their original texts were not available. Accordingly, a total of 122 theses could be used for analysis on the misinterpretation of odds ratio. Among them, 45 theses were excluded from the calculation of estimated relative risk because for them it was impossible to estimate relative risk by the method of Zhang and Yu1) based on P0. For the remaining 77 theses, we calculated estimated relative risk, and analyzed the difference between estimated relative risk and odds ratio using data from these theses (Figure 1).
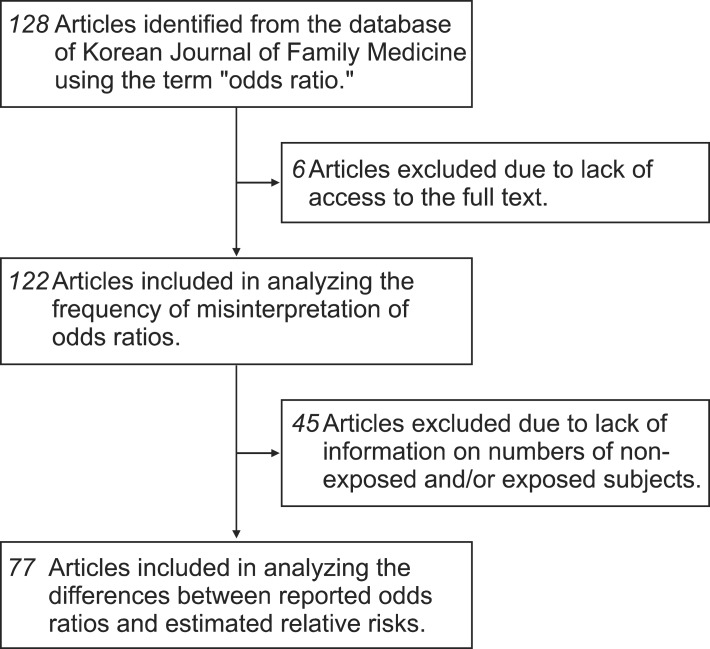
Flow diagram of literature search.
First, the yearly number of theses reporting odds ratio was in an increasing trend (Figure 2A). Of the theses, 22 (18%) misinterpreted odds ratio as relative risk. The yearly number and five-year average number of article which misinterpreted odds ratio showed a pattern of gradual decrease (Figure 2B).
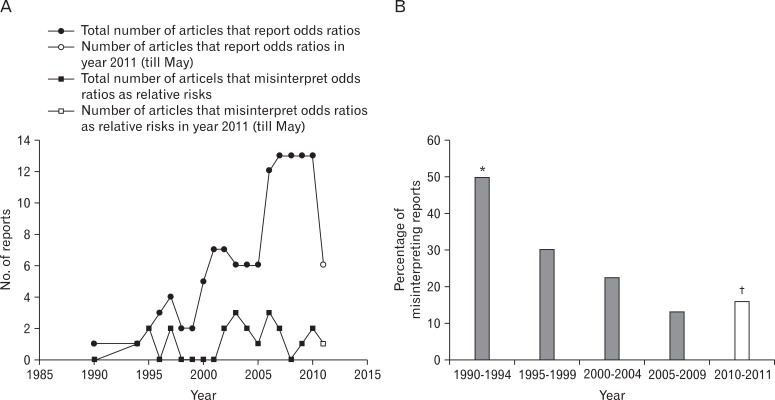
Descriptive presentation of number of reports that report odds ratios (black circles) and those that misinterpret odds ratios as risk ratios (black squares) (A) and frequency of misinterpreting reports averaged every five year (B). *Only 2 articles were available and included in calculating the percentage. †Articles that were published from 2010 to May 2011 were included.
When their results were evaluated using estimated relative risk, odds ratio was overestimated in almost all the theses (Figure 3). In around 60% of the theses, difference between odds ratio and relative risk assessed through |log10 (odds ratio)| was over 20%.

Comparison of estimated risk ratios and reported values of odds ratios. Axes are adjusted to the logarithmic scale. The diagonal line denotes the line of equal values.
DISCUSSION
In the results of reviewing theses reporting odds ratio among research papers published in the Korean Journal of Family Medicine since 1980, around 18% of them misinterpreted odds ratio as relative risk. Although there may be difficulties in making simple comparisons due to differences in the total number of theses examined and search years, our result was lower than the 26% reported by Holcomb et al.3) We observed a decreasing trend in the frequency of misinterpretation over time. With the exception of a small number of theses, odds ratio was different from estimated relative risk and odds ratio was larger than estimated relative risk (Figure 3). In around 60% of the theses, difference between odds ratio and estimated relative risk was over 20%. This result suggests the possibility that readers may mistake odds ratio for relative risk even if the thesis itself does not misinterpret odds ratio.
Odds ratio is a very useful tool for medical studies, mathematically convenient, and is easily applicable in designing and executing case-control studies. Because of these advantages, it is presented in the results of many medical studies. Medical studies, in particular those using odds ratio, draw lay people's attention. However, general readers are likely to interpret odds ratio not as 'odds ratio' but as relative risk. Accordingly, if odds ratio can be overestimated, such as in cases when P0 is quite large, the authors need to prevent such a misinterpretation of odds ratio. Based on medical reports, physicians or ordinary people may make medical or health-related decisions. For example, if a treatment effect calculated as relative risk indicates improvement of 20% but is interpreted as improvement of 40%, doctors and patients may overestimate the effect of the corresponding drug and such a decision can have an adverse effect on the patients.
As a solution to this problem, it is necessary to educate medical researchers on the usefulness and limitations of odds ratio. Such education may reduce the possibility to misinterpret odds ratio as relative risk, and as in the study by Kurkinen-Raty et al.,8) we can reduce the room for misinterpretation by reporting both odds ratio and relative risk at the same time, if possible. In case relative risk is not calculable, the report of estimated relative risk using 'relative risk estimation method'1) with well-proven validity can remind the readers of the limitations of odds ratio.
Nevertheless, this study does not deny the validity of studies reporting odds ratio. The convenience and applicability of odds ratio have activated many case-control studies as it allows researchers to design and execute research easily, and these studies have made remarkable contributions to the development of medicine.1-3) In particular, guidelines in the field of medicine have been established through meta-analysis that analyzes the results of multiple studies together.9)
A limitation of this study is that it analyzed cases in a journal without direct comparison with other journals. Another limitation is the possibility that, for theses published earlier than the 1990s, the percentage of theses misinterpreting odds ratio might be overestimated because the total number of theses reporting odds ratio was small in that period. Nevertheless, we tried to enhance the reliability of results by reviewing all of the theses published in the Korean Journal of Family Medicine by two independent authors and using manual search for theses that could not be covered by online search.
Contrary to expectations based on the report by Holcomb et al.,3) the percentage of theses misinterpreting odds ratio in the Korean Journal of Family Medicine was relatively low and decreased continuously. The reasons for the decreasing pattern could not be found in this study, but they may be related to the improved quality of medical studies and statistical education. Considering the health-related effects of misinterpretation on general readers of medical reports, however, there should be continuous caution against the misinterpretation of odds ratio, and further efforts by researchers to reduce the possibility of misinterpretation.
Notes
No potential conflict of interest relevant to this article was reported.