Effects of Oral Procaterol for Postinfectious Cough in Adults: Single-Centre, Randomized Double-Blind, Placebo-Controlled Trial
Article information

Abstract
Background
Persistent cough following an upper respiratory tract infection (URTI) is common in clinical practice. We investigated the effects of procaterol on cough-specific quality of life (QoL) and peripheral-airway function among adults suffering from postinfectious cough (PIC).
Methods
This was a prospective, randomized, double-blinded placebo-controlled trial (NCT 02349919) conducted at a university hospital. Seventy-four non-asthmatic adults who had persistent post-URTI cough for ≥3 weeks were assessed by a physical examination, chest/paranasal sinus radiographs, spirometry, and impulse oscillometry (IOS) and were allocated to receive procaterol or placebo for 4 weeks. The Thai version of the Leicester Cough Questionnaire (LCQ-T), spirometry and IOS were assessed at baseline, 2 weeks, and 4 weeks.
Results
Mean LCQ-T total scores for the procaterol group (10.8) and placebo group (10.9) at baseline were not significantly different (P=0.821). After adjustment for baseline Borg Cough Scale score and post-nasal drip, the mean between-group difference was not significant for LCQ-T total score (-1.26; 95% confidence interval [CI], -2.69 to 0.17), physical domain score (-0.35; 95% CI, -0.76 to 0.06), psychological domain score (-0.53; 95% CI, -1.06 to 0.01), or social domain score (-0.38; 95% CI, -0.92 to 0.16). Large improvements in LCQ-T total score were reported in both groups after 2 weeks (procaterol, 4.21±2.73; placebo, 5.34±3.2), and 4 weeks (procaterol, 5.94±3.68; placebo, 7.07±3.44). No differences between groups were found in the mean changes of spirometry or IOS parameters after 4 weeks.
Conclusion
Our study shows that procaterol is not effective in the treatment of PIC, in terms of improvement of cough-specific QoL or peripheral-airway function.
INTRODUCTION
Cough that persists following an upper respiratory tract infection (URTI) in previously healthy subjects is termed “postinfectious cough” (PIC). PIC can be a disabling medical condition. Four underlying mechanisms of airway narrowing and hyperresponsiveness have been postulated [1-3]. First, epithelial necrosis may contribute to airway narrowing and damage to the ciliated epithelium, resulting in irreversible obstruction of peripheral airways [2]. Second, animal studies have shown that viral infection reduces the activity of neural endopeptidases from exposed sensory nerves and increases susceptibility to neurogenic inflammation by allowing a higher concentration of substance P to reach their receptors in the airways [4]. Third, in vitro studies have shown enhancement of immunoglobulin E-mediated histamine release from mononuclear leucocytes [5-7]. Also, release of inflammatory mediators, such as leukotriene C4, in nasopharyngeal secretions during acute viral infection has been reported in pediatric populations [8]. Finally, there is an increase in cough sensitivity to capsaicin that does not affect the caliber or responsiveness of airways [9]. A previous study proposed that various types of stimulations are not directly transmitted to cough receptors in the airways, but they can cause contraction of bronchial smooth muscle, which stimulates cough receptors to trigger cough [10].
Therapeutic trials of PIC with albuterol [11], nasal decongestants, antihistamines, inhaled corticosteroids [12,13], cough suppressants, and ipratropium bromide [14] have yielded unpredictable results. In this study, we hypothesized that procaterol may have an effect on the bronchial smooth muscle and possibly ameliorate cough mediated through an adrenergic pathway, and investigated the effects of procaterol on cough-specific quality of life (QoL) and peripheral-airway function using impulse oscillometry (IOS) among adults suffering from PIC.
METHODS
1. Participants
The study protocol was approved by the Committee of the Ethics in Human Research of Ramathibodi Hospital (ID 07-57-26). All participants provided written informed consent before participation. This trial is registered with ClinicalTrials.gov (NCT 02349919).
Participants with PIC were defined as adults (age ≥18 years) having cough with a duration of 3–8 weeks following an acute URTI (sore/irritated throat, nasal congestion/discharge, or cough with or without fever). If the participants reported consecutive URTI within 8 weeks before resolution of the cough from the first URTI onset, the duration of cough was counted from the first URTI onset. The exclusion criteria were history of allergy or intolerance to β2 agonists; chronic diseases associated with cough (e.g., bronchiectasis, asthma, chronic obstructive pulmonary disease, and congestive heart failure); current or recent ex-smoker (<2 months); pregnancy; breastfeeding; treatment with drugs that can cause cough (e.g., angiotensin-converting enzyme inhibitors); wheezing or rhonchi on physical examination at screening; and abnormal chest radiographs.
2. Randomization and Masking
Participants were randomly assigned to receive procaterol (25-µg tablets) or identical placebo tablets (Otsuka Pharmaceuticals, Tokyo, Japan) with a 1:1 allocation. The randomization sequence was computer-generated by an independent statistician and was implemented using sequentially numbered packages. Participants, investigators, and research staff were masked to treatment allocation.
3. Procedures
On the screening visit at pulmonary clinic, research staff recorded the presence and onset of URTI symptoms (sneezing, blocked nose, or runny nose), duration of cough, post-nasal drip symptom, previous medications used for cough, history of allergic rhinitis, and smoking status of the participant. Each participant was evaluated to determine if he/she had symptoms suggestive of gastroesophageal reflux using the Gastroesophageal Reflux Disease Questionnaire (GERD-Q), and the severity of his/her cough symptom was rated on a 10-cm Borg Cough Scale (0, no cough; 10, maximum/excruciating cough).
All participants underwent physical examination of the nose, throat, and chest by our investigators who were pulmonologists. The findings (i.e., post-nasal drip, swollen or pale inferior turbinate, wheeze, or rhonchi) were recorded. Radiographs of the chest and paranasal sinuses were obtained in all participants. Participants with history of acute URTI and previous history of allergic rhinitis or sinusitis were allowed to participate in the study, if their cough persisted after they had been well-treated with nasal steroids and/or antibiotics for at least 2 weeks before randomization.
After clear instructions by our investigators, participants completed the Thai version of the Leicester Cough Questionnaire (LCQ-T). The total score of the LCQ-T can be from 3 to 21, with a higher score indicating a better cough-specific QoL [15]. The LCQ-T has been validated in a Thai population with chronic cough and the minimum clinically important difference has been determined [16,17]. Participants performed spirometry and methacholine challenge testing to determine whether they had baseline airway obstruction and to assess for airway hyperresponsiveness. We included those who had no airway obstruction, regardless of airway hyperresponsiveness, in the final analysis. Methacholine challenge testing was carried out in accordance with a standard guideline using a five-breath dosimeter protocol in which the test started from the diluent and proceeded with subsequent five incremental serial concentrations of methacholine solution (0.25, 1, 5, 10, 25 mg/mL) [18]. All solutions were delivered by a nebulizer (De Vilbiss 646; S&M Instruments, Doylestown, PA, USA). The final concentration of methacholine that decreased the baseline forced expiratory volume in one second (FEV1) by 20% (PC20) was recorded. Participants were excluded from the study if spirometry revealed an evidence of airway obstruction (i.e., FEV1/forced vital capacity <0.7), or if they had a GERD-Q score >8 [19]. Participants who had received medications previously for a URTI were asked to discontinue all medications before randomization and during the 4-week trial.
During the randomization visit, participants were asked to complete the LCQ-T and rate their severity of cough on the Borg Cough Scale, as well as complete the validated 36-item Short-Form Health Survey (SF-36) version 2.0 for general QoL [20]. IOS using Masterscreen IOS version 4.5 (Erish Jaeger, Hoechberg, Germany) with a standard method [21], spirometry, and fractional exhaled nitric oxide (FeNO) at exhaled flow of 50 mL/s (NObreath; Bedfont Scientific, Maidstone, UK), were measured. Our investigators then assigned participants to receive the study drug in a package containing 10 procaterol (25 µg) or identical placebo tablets twice daily. All participants were asked to avoid taking self-administered treatment for cough. After 2 weeks, participants were asked to follow-up at the clinic, and research staff counted the doses of tablets taken. Participants were given their study drug to continue for an additional 2 weeks if they did not report adverse effects or did not refuse to continue the study.
At 2 weeks and 4 weeks, participants were asked to complete the LCQ-T, Borg Cough Scale and SF-36. At each visit, IOS, spirometry, and FeNO measurements were obtained.
The primary outcome was the difference in LCQ-T total score between baseline and two follow-up points (2 weeks and 4 weeks). Secondary outcomes were the mean difference of the following parameters between baseline and 4 weeks: (1) spirometry parameters (FEV1, forced expiratory flow25%–75%), IOS parameters (resistance at 5 Hz [R5] and at 20 Hz [R20], difference of R5 and R20 [R5–R20], resonant frequency [Fres], reactance at 5 Hz [X5]), and FeNO levels; (2) SF-36 domain score.
4. Statistical Analyses
The sample size was calculated based on previous studies to have 80% power to detect the changes of the LCQ-T total score of 3, using a standard deviation (SD) of 4.0 and two-tailed α of 0.05 [15,17]. The ratio of intervention/control was set at 1:1. The target sample size was 60 participants. Allowing for a 20% dropout rate, the effective sample size was 74 participants.
The baseline characteristics of patients in treatment and placebo groups are described as the mean (SD) or median (range). To compare the baseline data between the two groups, an independent t-test or Mann-Whitney test for continuous variables and chi-square test for categorical variables were used. A mixed linear regression model was applied to assess the treatment effect on LCQ-T scores, SF-36, and pulmonary function parameters. Within-subject variation was fitted in the model as a random effect whereas the treatment was considered as a fixed effect. Time at measurement (i.e., 2 weeks and 4 weeks) was included in the mixed model by treating it as a fixed effect. Marginal effects on treatment, between treatment and time were compared. Covariables (baseline Borg Cough Scale score, post-nasal drip, and X5 value) were adjusted in the model. Intention-to-treat analyses were carried out for all outcomes. Per-protocol analyses were carried out for LCQ-T total and domain scores in participants who met the criteria for study eligibility, showed adherence to the study drug (defined as taking ≥50% of tablets), did not take self-administered medications for cough, and completed baseline and follow-up LCQ-T. Mixed-effects logistic regression analyses adjusted for these same baseline covariates were performed to assess between-group differences in improvement of LCQ-T total scores. All analyses were carried out by STATA ver. 15.0 (Stata Corp., College Station, TX, USA). A P-value <0.05 was considered significant.
RESULTS
Between July 1, 2015 and December 30, 2017, 100 participants were screened for trial eligibility. Of these, 74 were randomly allocated to receive procaterol (n=37) or placebo (n=37). Of the 74 participants, two met the PC20 at 0.29 mg/dL and 8.4 mg/dL of methacholine at the time of enrolment. Figure 1 summarizes the recruitment and follow-up of participants. The protocol violation of participants (i.e., refusing to take the study drug after enrolment but able to follow-up for taking the LCQ-T at 2 weeks and 4 weeks) during the trial did not differ between groups (one in each group). Table 1 summarizes the baseline characteristics, baseline LCQ-T total score and domain scores, baseline pulmonary function, and FeNO levels of participants. Participants receiving procaterol reported a significantly higher Borg Cough Scale score and worse post-nasal drip at baseline than those receiving placebo (P=0.031 and P=0.001, respectively). Participants receiving placebo showed a significant increase in markers of dysfunction of peripheral airways at baseline from IOS (higher Fres, greater reduction of X5) compared with those receiving procaterol (P=0.025 and P=0.011, respectively).
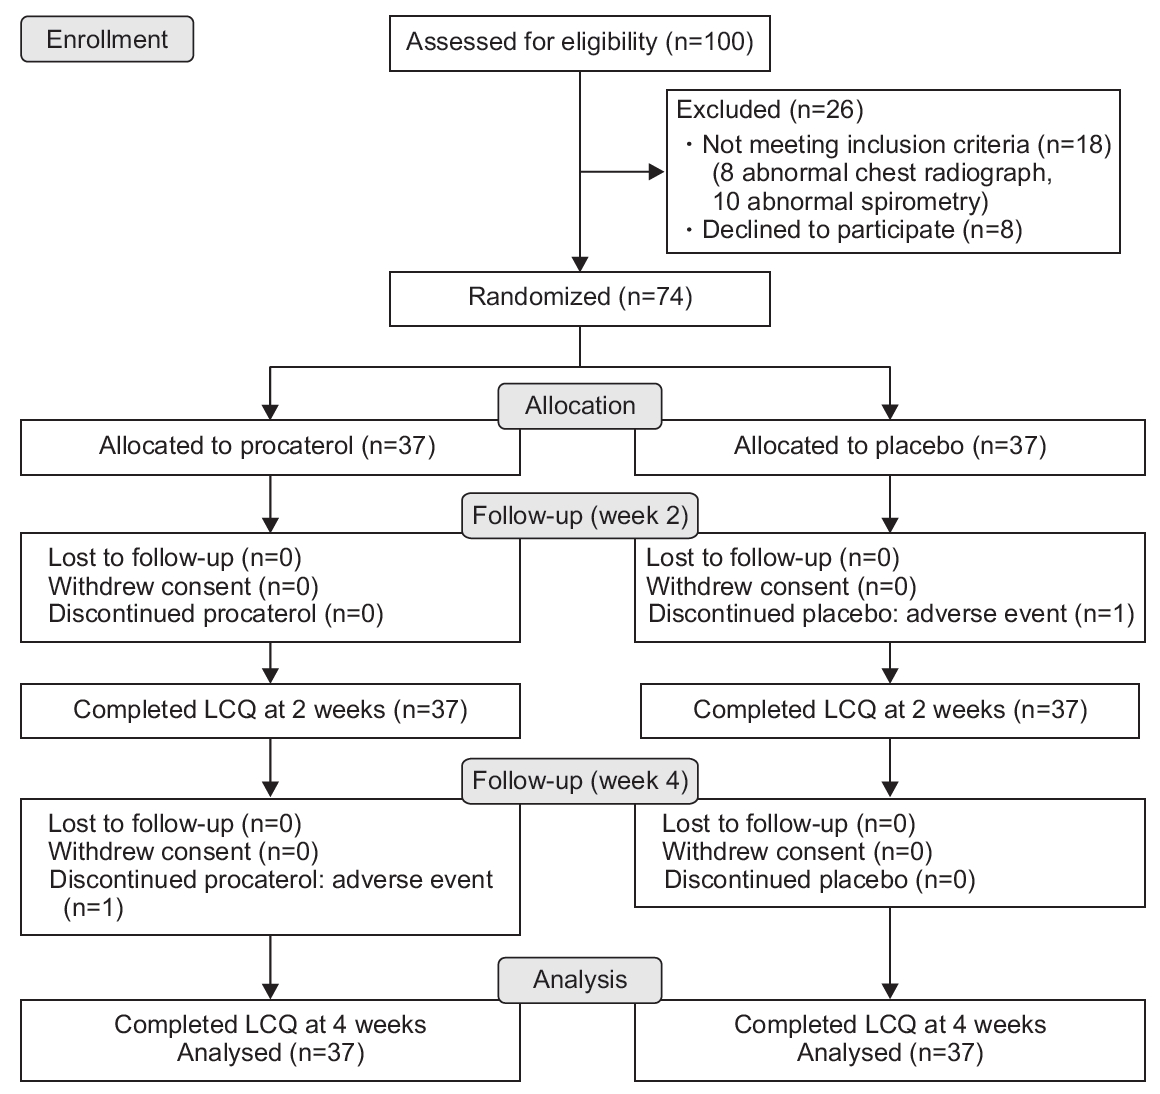
Flow diagram of the study. LCQ, Leicester Cough Questionnaire.
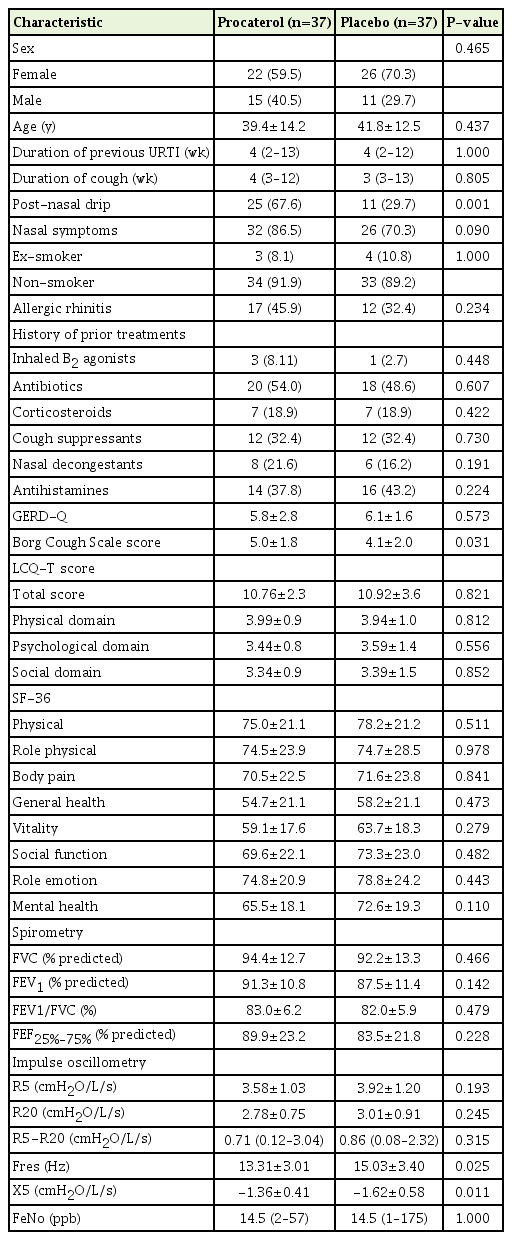
Baseline characteristics of subjects administered procaterol or placebo
Table 2 summarizes the LCQ-T total and domain scores between procaterol and placebo groups. The adjusted mean between-group difference for LCQ-T total score and domain scores did not differ. The crude treatment effects of each group at 2 weeks and 4 weeks are summarized in Supplementary Table 1. Large improvements in LCQ-T total score were observed in both groups at 2 weeks (procaterol, 4.21±2.73; placebo, 5.34±3.2) and 4 weeks (procaterol, 5.94±3.68; placebo, 7.07±3.44). Between-group differences in LCQ-T total score and three domain scores after 2 weeks and 4 weeks were not significant, except for worsening psychological domains in the procaterol group in the per-protocol analysis (Supplementary Table 2). We assessed the interaction effect between treatment and time. There was no interaction effect between treatment and time (i.e., the mean differences of LCQ-T score between the procaterol group and the control group at 2 weeks and 4 weeks were not different). Therefore, we fit the mixed linear regression model without an interaction effect. The likelihood of a large improvement in LCQ-T total score >20% from baseline was similar in both groups (adjusted risk ratio, 0.78; 95% confidence interval [CI], 0.53–1.03). The adjusted mean between-group difference for pulmonary function parameters and FeNO levels is illustrated in Figure 2 and Supplementary Table 3. The mean between-group difference for SF-36 domain scores is shown in Supplementary Figure 1 and Supplementary Table 4.
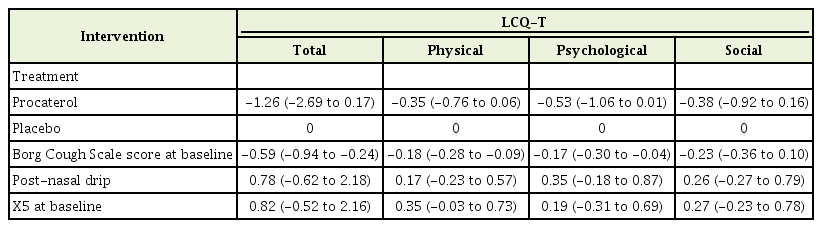
Comparison of the LCQ-T score after 4 weeks between procaterol and placebo groups (intention-to-treat analyses)
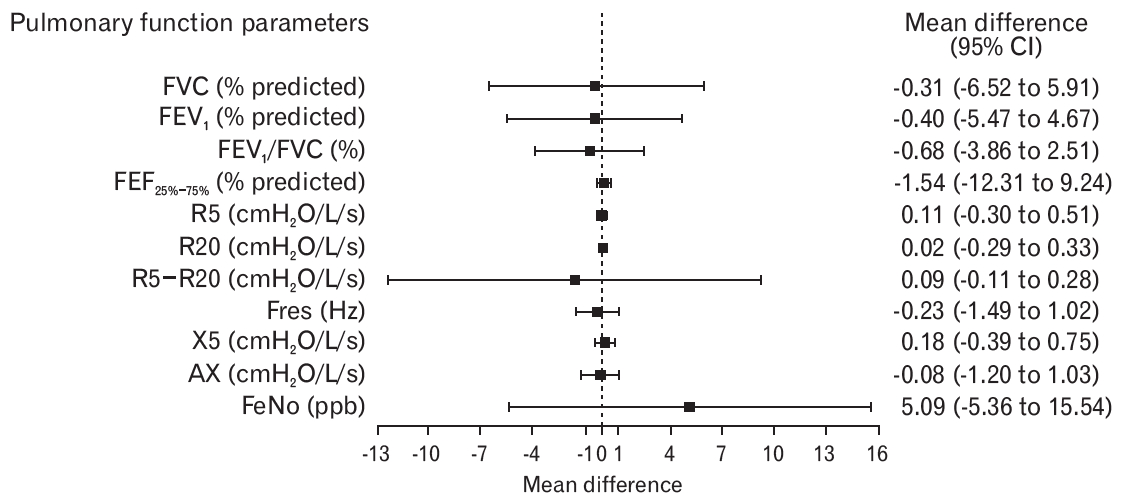
Plot showing the mean difference (95% CI) of pulmonary function parameters and FeNO levels. Values are the mean difference derived from the regression model (placebo as a reference). Adjustment for baseline Borg Cough Scale score, baseline post-nasal drip, and baseline X5 value was analyzed. CI, confidence interval; FVC, forced vital capacity; FEV1, forced expiratory volume in one second; FEF25%–75%, forced expiratory flow between 25% and 75% of FVC; R5, respiratory resistance at 5 Hz; R20, respiratory resistance at 20 Hz; R5−R20, difference between R5 and R20; Fres, resonant frequency; X5, reactance at 5 Hz; AX, reactance area; FeNO, fractional exhaled nitric oxide.
Adverse events are summarized in Table 3. One of the four participants with palpitations in the procaterol group discontinued the study drug after the second day of enrolment. The remaining participants with palpitations completed the trial after reduction to half the drug dose. One of the two participants with dizziness in the placebo group discontinued the study drug, 2 weeks after enrolment. Other reported adverse events were not associated with withdrawal of the study drug. All participants who stopped the study drug prematurely owing to adverse events returned for outcome measurements at 2 weeks and 4 weeks.
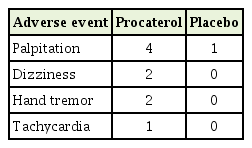
Adverse events
DISCUSSION
Procaterol did not improve cough-specific QoL for patients with PIC. Large improvements in cough-specific QoL were reported in the procaterol and placebo groups, suggesting that PIC tends to improve spontaneously over time.
As reported in several studies, the mechanism of PIC includes cough-reflex hypersensitivity [9,22] and transient vocal dysfunction [23]. Other postulated mechanisms include the release of cytokines, neurotransmitters, and leukotrienes; increased levels of neural receptors (i.e., substance P); and modulation of afferent neural activity possibly via cholinergic motor pathways [24].
Ipratropium bromide was studied in patients with post-viral cough in a controlled double-blind trial [14]. The authors concluded that ipratropium bromide is effective for reducing cough without affecting bronchodilation in this condition. The observation should be interpreted cautiously given the small sample size, and the possibility of a carry-over effect of treatment owing to a crossover design, and no ‘true’ placebo. While procaterol is a smooth muscle relaxant, it can also reduce eosinophilic inflammation through the downregulation of the expression of adhesion molecules and inhibition of eosinophil migration in vitro [25]; inhibition of substance P release; and attenuation of histamine-induced cough during bronchoconstriction in animals [26].
We found no bronchoconstriction at baseline, and only two of the 74 participants (2.7%) showed methacholine-induced bronchoconstriction. These observations may explain the lack of effectiveness of procaterol on the number of coughs. FeNO was considered to be a marker of eosinophilic inflammation in our trial. We found a broad range of FeNo levels in PIC, and there was no significant change in FeNO levels at 2 weeks or 4 weeks in either group. Fujimura et al. [27] showed that inhaled procaterol had no effect on airway cough receptor sensitivity to capsaicin compared with placebo in patients without asthma and chronic bronchitis. That observation could at least in part explain why PIC does not respond to procaterol.
A greater percentage of participants had post-nasal drip and a higher Borg Cough Scale score at baseline in the procaterol group. There was a greater reduction in X5 in the placebo group. The main analysis was adjusted by these factors for the primary outcome and all secondary outcomes. Procaterol did not improve LCQ-T total score and domain scores compared with placebo. The results from our study are similar to the results from a systematic review of inhaled β2 agonists in children with nonspecific chronic cough, in terms of the lack of reduction of cough frequency [28]. In a study by Holmes et al. [14], an inhaled bronchodilator had no effect compared with placebo in the improvement of spirometry. We thought that the measurement of airway resistance by IOS, which is reportedly more sensitive to detect abnormalities compared to spirometry, contributed to the difference of our study from previous reports. In our study, the bronchodilator had no effect compared with placebo with respect to spirometry, IOS parameters, and FeNo levels. Large improvements in cough-specific QoL were observed in procaterol and placebo groups after 2 weeks and 4 weeks, suggestive of natural resolution of PIC.
We acknowledge potential limitations. First, the sample size was relatively small. This was because the sample size was calculated based on a larger change of total LCQ score (i.e., 3) from previous studies [15,17]. However, the threshold of changes in the total LCQ score could be achieved. A back-calculation of the power of our trial was 70%, but the lower boundary of the 95% CI of the treatment effect nearly reached 3 (i.e., 2.69), which was unfavourable towards the procaterol group. The sample size was recalculated for regression analysis, and 60 participants in each group are suggested for future trials. Second, the duration of cough in four patients was longer than those commonly defined for PIC. There are several explanations. First, the duration of cough in this study was counted from the first URTI onset in patients with recurrent episodes of URTI (n=2), therefore cough duration could be >8 weeks up to 13 weeks. Secondly, the cough duration was protracted because of proven influenza (n=2). As previously reported, cough due to pertussis and H1N1 influenza infections, may be prolonged (median: 118 days and 3 months, respectively), as compared with that due mycoplasma or other respiratory viral infections [29,30]. Yet, the tests for both organisms were not obtained. Third, we did not carry out microbiologic investigations of other possible organisms causing PIC, such as Mycoplasma, Chlamydia, or Bordetella pertussis. However, the inclusion criteria for participation in the trial were quite robust, in that a clinical definition of PIC was combined with other investigations before study entry (e.g., radiographs of the chest and paranasal sinuses, spirometry) to exclude significant underlying diseases that can exacerbate cough during URTI. Fourth, although several parameters (i.e., airway responsiveness and inflammation) were measured, the cough-reflex sensitivity was not tested to elucidate the mechanism of cough in our trial. Finally, our trial was conducted at the tertiarycare level where thorough investigations of chronic cough were fulfilled. However, our findings might not be generalizable to the primary-care setting.
In conclusion, in our study, we found that oral procaterol did not ameliorate cough that persisted following URTI. Spirometry parameters, peripheral-airway function, and exhaled nitric oxide level did not improve with procaterol administration, suggesting that PIC does not relate to airway obstruction and tends to improve spontaneously over time.
Notes
No potential conflict of interest relevant to this article was reported.
Acknowledgements
This was an investigator initiated trial funded by Otsuka Pharmaceuticals (Thailand). The company was not involved in the study design; collection, analyses or interpretation of data; report writing; or submission for publication. The primary investigator constructed the study protocol and bore final responsibility for the decision to submit this manuscript for publication. We thank Arshad Makhdum, PhD, from Edanz Group (www.edanzediting.com/ac) for editing a draft of this manuscript.
SUPPLEMENTARY MATERIALS
Supplementary materials can be found via https://doi.org/10.4082/kjfm.19.0118.
Descriptive information of the LCQ-T between procaterol and placebo groups (intention-to-treat-analysis)
Descriptive information of the LCQ-T score after 4 weeks between procaterol and placebo groups (per-protocol analyses)
Descriptive information of spirometry parameters, impulse oscillometry parameters, and FeNO levels after 4 weeks between procaterol and placebo groups
Descriptive information of SF-36 domain score after 4 weeks between procaterol and placebo groups
Mean difference of SF-36 domain score between procaterol and placebo groups.