Analysis of Continuity of Care and Its Related Factors in Diabetic Patients: A Cross-Sectional Study
Article information

Abstract
Background
Continuity of care in primary care settings is crucial for managing diabetes. We aimed to statistically define and analyze continuity factors associated with demographics, clinical workforce, and geographical relationships.
Methods
We used 2014–2015 National Health Insurance Service claims data from the Korean registry, with 39,096 eligible outpatient attendance. We applied multivariable logistic regression to analyze factors that may affect the continuity of care indices for each patient: the most frequent provider continuity index (MFPCI), modified-modified continuity index (MMCI), and continuity of care index (COCI).
Results
The mean continuity of care indices were 0.90, 0.96, and 0.85 for MFPCI, MMCI and COCI, respectively. Among patient factors, old age >80 years (MFPCI: odds ratio [OR], 0.81; 95% confidence interval [CI], 0.74–0.89; MMCI: OR, 0.84; 95% CI, 0.76–0.92; and COCI: OR, 0.81; 95% CI, 0.74–0.89) and mild disability were strongly associated with lower continuity of care. Another significant factor was the residential area: the farther the patients lived from their primary care clinic, the lower the continuity of diabetes care (MFPCI: OR, 0.74; 95% CI, 0.70–0.78; MMCI: OR, 0.70; 95% CI, 0.66–0.73; and COCI: OR, 0.74; 95% CI, 0.70–0.78).
Conclusion
The geographical proximity of patients’ residential areas and clinic locations showed the strongest correlation as a continuity factor. Further efforts are needed to improve continuity of care to address the geographical imbalance in diabetic care.
INTRODUCTION
Diabetes is one of the largest public health concerns, with approximately 463 million patients worldwide [1] and constituting 10% of all global health expenditures. In 2019, the American Diabetes Association (ADA) emphasized the need for higher continuity of care in managing diabetes and its comorbidities [2].
Studies on the interpersonal continuity of care of diabetic patients revealed that higher continuity of care improved patient satisfaction, consequently lowering both hemoglobin A1c level and cost of care [3,4]. Multiple randomized controlled trials, systematic reviews, and observational studies have shown that higher continuity in diabetic patients is associated with fewer emergency room visits and lower mortality rates, which are some of the main clinical goals in diabetes care [2,5,6].
With the increasing attention continuity of care has received [7,8], numerous studies have attempted to evaluate the continuity factors that apply to the primary healthcare environment. However, most of these studies are observational, with several limitations. For example, a research in European categorized and determined factors associated with the level of continuity as population demographics, quality of care [9], and interpersonal relationships between patient and physician [3]. However, many of the factors mentioned were investigated through surveys and interviews, making them susceptible to bias. Similarly, these studies were not performed nationwide, and their results were based on patients’ subjective views on their treatment.
In the Korean healthcare provision, all hospitals and clinics are covered by a single mandatory public insurance system. Recent observational studies conducted in Korea reported that patient demographics and medical institution types were correlated with continuity of care in diabetes [10,11]. These studies were conducted using clinical data but were lacking in the variety of analyzed factors.
This study aimed to measure continuity of care using nationwide health insurance claims data and determine the factors associated with demographics, clinical workforce, and geographical proximity. Although the association between continuity and geographical proximity of primary care clinics may seem apparent, it has not been previously investigated. With such evidence, clinicians and policymakers can better guide diabetic patients to improve their continuity of care and outcomes.
METHODS
1. Data Source and Study Population
This study used claims data from the Korean National Health Insurance Service (NHIS) National Sample Cohort, a population-based cohort study. The cohort was first sampled from the 2002 NHIS database and was followed up until 2017. The NHIS enrolees cover approximately 97% of all Koreans, and with a random sampling rate of 2%, this sample cohort included 1,000,000 individuals. We used data collected from 22,275,040 outpatient attendances across 29,912 office-based clinics from 2014 to 2015. From this pool, we selected patients who had attended outpatient clinics for type 2 diabetes mellitus using their diagnosis records. The NHIS data contain a diagnosis record for each attendance per participant in the form of the International Classification of Diseases 10th revision. To calculate the continuity of care index (COCI) without outliers, we excluded patients who recorded less than four or more than 100 attendances during the follow-up period [12].
We identified the primary care provider for each patient and the clinic most frequently visited by the participant for these attendances. We selected patients whose primary care provider was clinic-based (N=39,130) to focus on continuity in the primary care environment. Finally, patients aged >20 years were included in this study (N=39,096). For example, if a known diabetic patient who attended local clinics five times between 2014–2015 for their diabetes care had a primary care provider based in a general hospital, they would be excluded from the analysis (Figure 1).
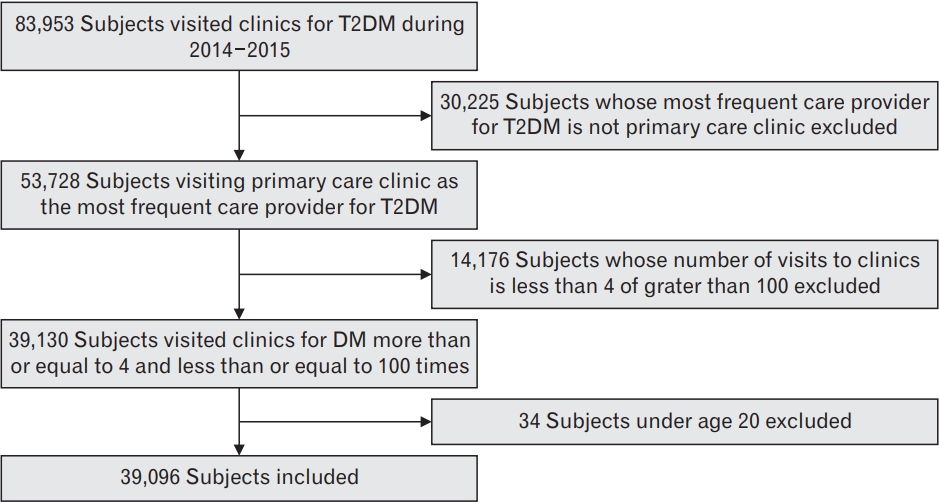
Flowchart of participant selection. T2DM, type 2 diabetes mellitus; DM, diabetes mellitus.
The requirement for informed consent from individual patients was exempted by Seoul National University Hospital due to the retrospective design of this study (1802-071-922).
2. Measures
1) Continuity of care
We calculated three continuity of care indices for each variable to measure continuity of care: the most frequent provider continuity index (MFPCI), modified-modified continuity index (MMCI), and COCI. These three indices must have a value between 0 and 1, according to the following formula:
N: total number of visits; M: total number of clinics visited; ni: the number of visits to ith care provider.
The MFPCI is the ratio of the number of visits to the primary care physician to the total number of visits to all physicians; it shows the concentration of visits to the primary physician [13]. When calculating the MMCI, the number of clinics visited by the patient was included. Therefore, MMCI also reflects the distribution across clinicians, which is not accounted for by MFPCI [14]. COCI combines the characteristics of both MFPCI and MMCI but also considers the degree of concentrated visits to each clinic [15]. Thus, a COCI value of 0 indicates that the patient had visited a different clinician each time, while 1 means that the patient only visited a single physician for diabetic care.
2) Patient factors
The data included basic patient information, including age, gender, residential area, average monthly insurance premium, and the presence of a disability, whether mental or physical. We defined the patients’ ages as of 2014 and categorized them into four groups with a range of 20 years each. Residential areas were provided according to the Korean administrative district (gu), not the specific geographical information. We allocated the residential area to one of four groups: Seoul (capital city), Gyeonggi-do (province), metropolitan city, and other areas. The average monthly insurance premium was also included in the data because it is correlated with household income. Although the initial insurance premiums were graded from 1 to 10 (the lowest to the highest), we categorized the 10 grades into three groups:1–3, 4–7, and 8–10. Disabilities were categorized into absence, mild disability, and severe disability.
3) Clinic workforce factors
We analyzed the most frequent care provider for each patient, established them as the primary care provider and combined it with the given clinical information: specialty of the primary physician, number of hired physicians and nurses, hospitalization facility, and geographical location. Although clinics may employ doctors with various specialties, only the single main medical specialty they reported to the government was considered. For instance, even though an internal medicine clinic employed dermatologists and general practitioners, they would report as internal medicine specialists. For clarity, a general practitioner is a licensed medical doctor without a specialty. Medical specialties accountable for treating more than 1% of the selected patients with diabetes were included in our multivariable model.
The number of registered nurses was also evaluated as a potential factor in the continuity of patients with diabetes. This is a surrogate factor that reflects the size of the clinics and affects the patient experience.
4) Geographical proximity factors
This variable indicates whether the patient’s residential area and the primary physician’s clinic are located in the same gu, thus representing the geographical proximity of the two factors.
3. Statistical Analysis
Patients were first categorized into two groups for each continuity index: high and low continuity. The lower quartile (25th percentile) was used as the cut-off value to divide the groups because the median value of all indices was equivalent to 1, an inappropriate value for discerning the disparity of continuity between the groups. We employed the chi-square test to evaluate the differences between the low- and high-continuity groups for each baseline characteristic.
We applied multivariable logistic regression analysis to investigate the association between the level of continuity and each factor. There were three geographical variables: the patient’s residential area, clinic location, and the concurrence of both factors. We excluded the primary physician’s clinical location factor when performing multivariate analyses adjusted for patient and clinical factors to ensure minimal confounding effects. Because there is no confirmed standard in the continuity of diabetic patients, the most common group for each variable was selected as the reference group.
Odds ratios (OR) and 95% confidence intervals (CI) were calculated. Among the MFPCI, MMCI, and COCI indices, OR values greater than 1 indicated higher continuity of care than the reference group. All analyses were performed with SAS Enterprise guide ver. 7.1 (SAS Institute Inc., Cary, NC, USA), and two-sided P<0.05 were considered statistically significant.
RESULTS
1. Characteristics of the Study Population
A total of 39,096 patients were included in the study, and primary care provider information was obtained for each patient. Of the study population, 20,153 (51.54%) were male, and the average age was 62.6 years. Over half (63.5%) of the patients visited internal medicine physicians as their primary care providers, and most primary care provider clinics hired a single physician (74.3%) and did not have registered nurses (66.7%). Most (85.4%) clinics did not have hospitalization facilities.
Patients attended clinics for diabetes mellitus on an average of 20.2 times (standard deviation [SD]=11.3) over the 2 years, approximately once every 5 weeks. Approximately 50% of the patients were followed up at a single clinic to treat their diabetes for 2 years, demonstrating high continuity. On average, the participants visited 1.6 clinics over 2 years (SD=0.9) to manage their diabetes. Mean±SD values of continuity of care indices were 0.90±0.16, 0.96±0.08, and 0.85±0.21 for MFPCI, MMCI, and COCI, respectively. We divided the patients into two groups of continuity based on the lower quartile (25th percentile) value of each index. The cut-off limits for the lower quartile index values for MFPCI, MMCI, and COCI were 0.83, 0.98, and 0.98, respectively. Patients in the lower quartile were defined as the lower continuity group and further statistical analyses were performed to evaluate factors associated with higher continuity.
Age, residential area, presence of disability, physician specialty, clinic location, hospitalization facility, and distance between the patient location and their primary care clinic showed significant differences in the distributions of the lower and higher MFPCI, MMCI, and COCI groups (P<0.05). The numbers of physicians and registered nurses showed statistical incongruity among the indices.
1) Patient factors
Multivariate logistic regression was used to discern the elements associated with greater continuity. For each continuity index, we used regression analyses to investigate the continuity of all baseline characteristic variables (Table 1), excluding clinic location.

We found that patients aged 20–39 years old (MFPCI: OR, 0.75; 95% CI, 0.65–0.86; MMCI: OR, 0.73; 95% CI, 0.64–0.84; and COCI: OR, 0.73; 95% CI, 0.64–0.84), and >80 years (MFPCI: OR, 0.81; 95% CI, 0.74–0.89; MMCI: OR, 0.84; 95% CI, 0.76–0.92; and COCI: OR, 0.81; 95% CI, 0.74– 0.89) were associated with lower continuity of care. There was a significant statistical association between continuity, residential area, and the presence of a disability. Patients living in metropolitan areas had higher continuity of care than those living in other areas (metropolitan area, MFPCI: OR, 1.19; 95% CI, 1.17–1.27; MMCI: OR, 1.17; 95% CI, 1.10–1.25; and COCI: OR, 1.19; 95% CI, 1.12–1.27). Patients with mild disabilities showed a lower continuity of care than those without such disabilities. However, patients with severe disabilities showed no significant differences in continuity compared with those without disabilities.
2) Clinic workforce factors
Analysis of the medical specialties of primary care physicians showed that general practitioners and orthopedic specialists were associated with lower continuity of diabetes. Family medicine was correlated with higher continuity, whereas general surgery showed lower continuity. However, these two specialties demonstrated no statistical significance.
3) Geographical factors
Geographical discrepancies between a patient’s residential area and their primary care clinic location demonstrated significantly lower continuity of care (MFPCI: OR, 0.74; 95% CI, 0.70–0.78; MMCI: OR, 0.70; 95% CI, 0.66–0.73; and COCI: OR, 0.74; 95% CI, 0.70–0.78) (Table 2).

DISCUSSION
In the current study, diabetic patients in Korea on average have high continuity of care. Continuity of diabetic care was significantly higher in middle-aged patients (40–59 years); who lived in metropolitan areas, did not have disabilities, visited an internal medicine specialist, and lived close to their primary care providers.
Earlier studies have shown that gender and medical institution type are some of the factors related to continuity. However, we included information that may reveal more significance for continuity of care, such as physician specialty, number of hired physicians and nurses per clinic, and geographical relationships.
In agreement with previous studies, continuity was distinctively lower in the younger age group (20–39 years), which can partly be explained by milder disease severity, fewer complications, and more frequent residential migration. However, the current phenomenon can pose an impending threat to the working population since the legacy effect of diabetes has been recently reported [16].
Consistent with earlier findings, our results showed a lower continuity in patients with disabilities [17]. However, we further examined how continuity of care differed between participants with mild and severe disabilities; patients with mild disabilities showed lower continuity. This is not only because severely disabled patients have higher hospital visit rates but also because disability-related policies are mostly targeted at more severely disabled patients [18,19]. Those with mild disabilities are socially disadvantaged, indicating a need for more social and political attention to their well-being.
To our knowledge, no study has explored the correlation between continuity and geographical proximity of a patient’s residential area and primary care location. In Korea, patients can choose their primary care doctors and the type of institution they visit. Our results showed that more than 30% of the sample cohort patients visited clinics in gu other than their homes, which led to a marked decline in continuity. This conveys a large disparity between the supply and demand of medical resources in South Korea. In 2019, the ADA guidelines recommended that diabetic patients meet their primary caregivers every 2–3 months [2,20]. Moreover, the prevalence of diabetes is closely related to residential location [21], which implies that local physicians can manage their patients more customized, and communicatively. To further improve continuity of care, efforts are required to address the geographical imbalance in diabetes care.
We also investigated the association between continuity and clinicrelated factors, such as the primary clinician’s specialty, the number of physicians and nurses per clinic, and the hospitalization facility. Our data trend indicated that solo or group practice, hospitalization facilities, and the number of hired nurses did not impact continuity. These surrogate markers indicate that patients do not have preferences regarding the size of office-based clinics. In contrast, the specialty of primary and continuity physicians showed a range of statistical relevance. Continuity was lower in patients with diabetes who visited general practitioners than in those who visited internal medicine specialists. This implies that patients prefer specialist care even when managing chronic diseases. Raising awareness of the primary care environment is essential for future healthcare planning [22,23].
The current study had several limitations. Some patients with diabetes may visit outpatient clinics with an issue other than diabetes, which cannot be deferred from our results. For example, although our results revealed that some patients visited surgical specialists for diabetic care, it is possible they visited the clinic for other needs. Secondly, we identified a patient’s geographical proximity and MFPCI by a concurrence of their location with the gu. However, this discrete variable does not indicate the actual distance between each patient and their MFPCI, which is susceptible to error. Finally, although we analyzed the direct association between variables and continuity of care, we could not evaluate the influence of interpersonal care. Qualitative indices should be assessed to examine the dynamic relationship between patients and their physicians.
The main strength of our study is the use of nationwide, representative, and large cohort data that can be generalized to the South Korean population. Such research is valuable for identifying additional factors associated with continuity of care. Furthermore, regular follow-up studies conducted in similar settings can monitor behavioral changes in the primary care environment and assess the impact of healthcare policies.
Continuity of diabetes is affected by various factors associated with patients, clinics, and the location of clinics. Among these factors, geographical proximity to the primary care clinic and patient’s residence significantly correlated with high continuity of care. Policies to support the geographical disparity in the supply and demand of diabetic care are necessary to promote continuity in diabetic patients.
Notes
CONFLICT OF INTEREST
No potential conflict of interest relevant to this article was reported.
FUNDING
We declare that that we are funded by the Korean Medical Association with grant number 2018-09.