• KAFM
  • Contact us
  • E-Submission
ABOUT
ARTICLE CATEGORY
BROWSE ARTICLES
AUTHOR INFORMATION

Articles

Original Article

Do People Have Healthier Lifestyles in Greener Environments? An Analysis of the Association between Green Environments and Physical Activity in Seven Large Korean Cities

Korean Journal of Family Medicine 2013;34(1):58-63.
Published online: January 28, 2013

Department of Family Medicine, Seoul National University Hospital, Seoul National University College of Medicine, Seoul, Korea.

Corresponding Author: Belong Cho. Tel: +82-2-2072-2195, Fax: +82-2-766-3276, belong@snu.ac.kr
• Received: August 30, 2009   • Accepted: November 6, 2012

Copyright © 2013 The Korean Academy of Family Medicine

This is an open-access article distributed under the terms of the Creative Commons Attribution Non-Commercial License (http://creativecommons.org/licenses/by-nc/3.0/) which permits unrestricted noncommercial use, distribution, and reproduction in any medium, provided the original work is properly cited.

  • 5,958 Views
  • 33 Download
  • 14 Crossref
  • 14 Scopus
prev next
  • Background
    Recent studies suggest that neighborhood environments influence levels of health and disease in individuals. Evidence suggests that green environments have positive effects on physical and psychological health. In this study, we examined the association between public park per person (PPP) and physical activity in 7 large Korean cities with a population of over 1 million.
  • Methods
    We obtained data from the third Korea National Health and Nutritional Survey and data on the area of PPP from the Korean national statistics office.
  • Results
    Physical activity and adjusted mean of physical activity increased significantly with PPP. When stratified by family income, physical activity increased significantly in all groups in a PPP-dependent manner. Physical activity significantly increased as PPP increased (coefficient, 16.025; 95% confidence interval, 12.392 to 19.658) before and after adjustment for age, sex, and family income. Physical activity increased in all income groups including the low income group.
  • Conclusion
    These results show that green park spaces independently promote physical activity and influence healthy lifestyles. Therefore, the importance of PPP for physical activity and health should be emphasized in urban planning.
Modern medicine has emphasized the importance of personalized access for health promotion. However, with this approach, each person has to spend his or her own time and money to access health-related resources such as pills, gyms, personal training, and healthier foods. The availability of time and money vary significantly according to socioeconomic status; this difference generates health inequities.1)
The influence of neighborhood environments on health has recently attracted interest. Neighborhood environments are not personal property, but have the potential to change lifestyle and health status.2) Many studies have focused on neighborhood and regional environments and their effects.3) Green environments are defined as "open, undeveloped land with natural vegetation"; they occupy an important position among neighborhood environments and include parks, forests, playing fields, and river corridors.4) Evidence suggests that contact with green environments is an independent promoter of physical activity and that green environments have many epidemiological and psychological effects.5-8)
However, the ratio of greenery to developed land has decreased remarkably compared to previous eras due to the processes of modernization, industrialization, and urbanization.9) In combination with the development of motor vehicles, these processes have reduced the physical activity of urban dwellers. These results have many negative consequences, such as an increase in obesity and cardiovascular disease among the population. It is well known that physical inactivity is an important determinant of ill-health and that even moderate levels of activity confer health benefits.10)
Recently, some studies have shown that individual activity increases in areas with a high proportion of green space.11,12) In Korea, where there is increasing interest in well-being and ecosystems, urban park construction is actively underway.
Public parks are one of the most accessible green environments in the big city. Thus, in this study we aimed to examine the association between green environments and physical activity in 7 large Korean cities with a population of over 1 million each. This study will enable estimation of the influence of green environments for use as an index of healthy urban neighborhood environments in Korea.
1. Data
We obtained data from the International Physical Activity Questionnaire (IPAQ) survey component of the 2005 Korean Health and Nutritional Survey. We also used green-space area data, which was obtained from the authorities of statistics and government of forests as independent variables. The target group comprised 4,148 people who lived in 7 large Korean cities and responded to the 2005 survey (94% of people responded to this survey). Forty-six people without family income were excluded. We calculated the metabolic equivalent of task scores ([50 kcal/m2h]-min/wk) and used them as a measure of physical activity. Subjects were divided into 3 activity groups according to IPAQ scores: low, moderate, and high.
2. Statistical Analysis
We analyzed basic characteristics with t-test and analysis of variance using the STATA ver. 10.0 (Stata Co., College Station, TX, USA) program. Multiple linear regression was used to analyze the correlation between physical activity and green park spaces. Results were adjusted for age, sex, and family income and were stratified into 3 groups to confirm the correlation between physical activity and green park space according to family income. An adjusted mean was used to analyze the correlation of physical activity in the 3 groups. In all statistical analysis, weighted values were applied.
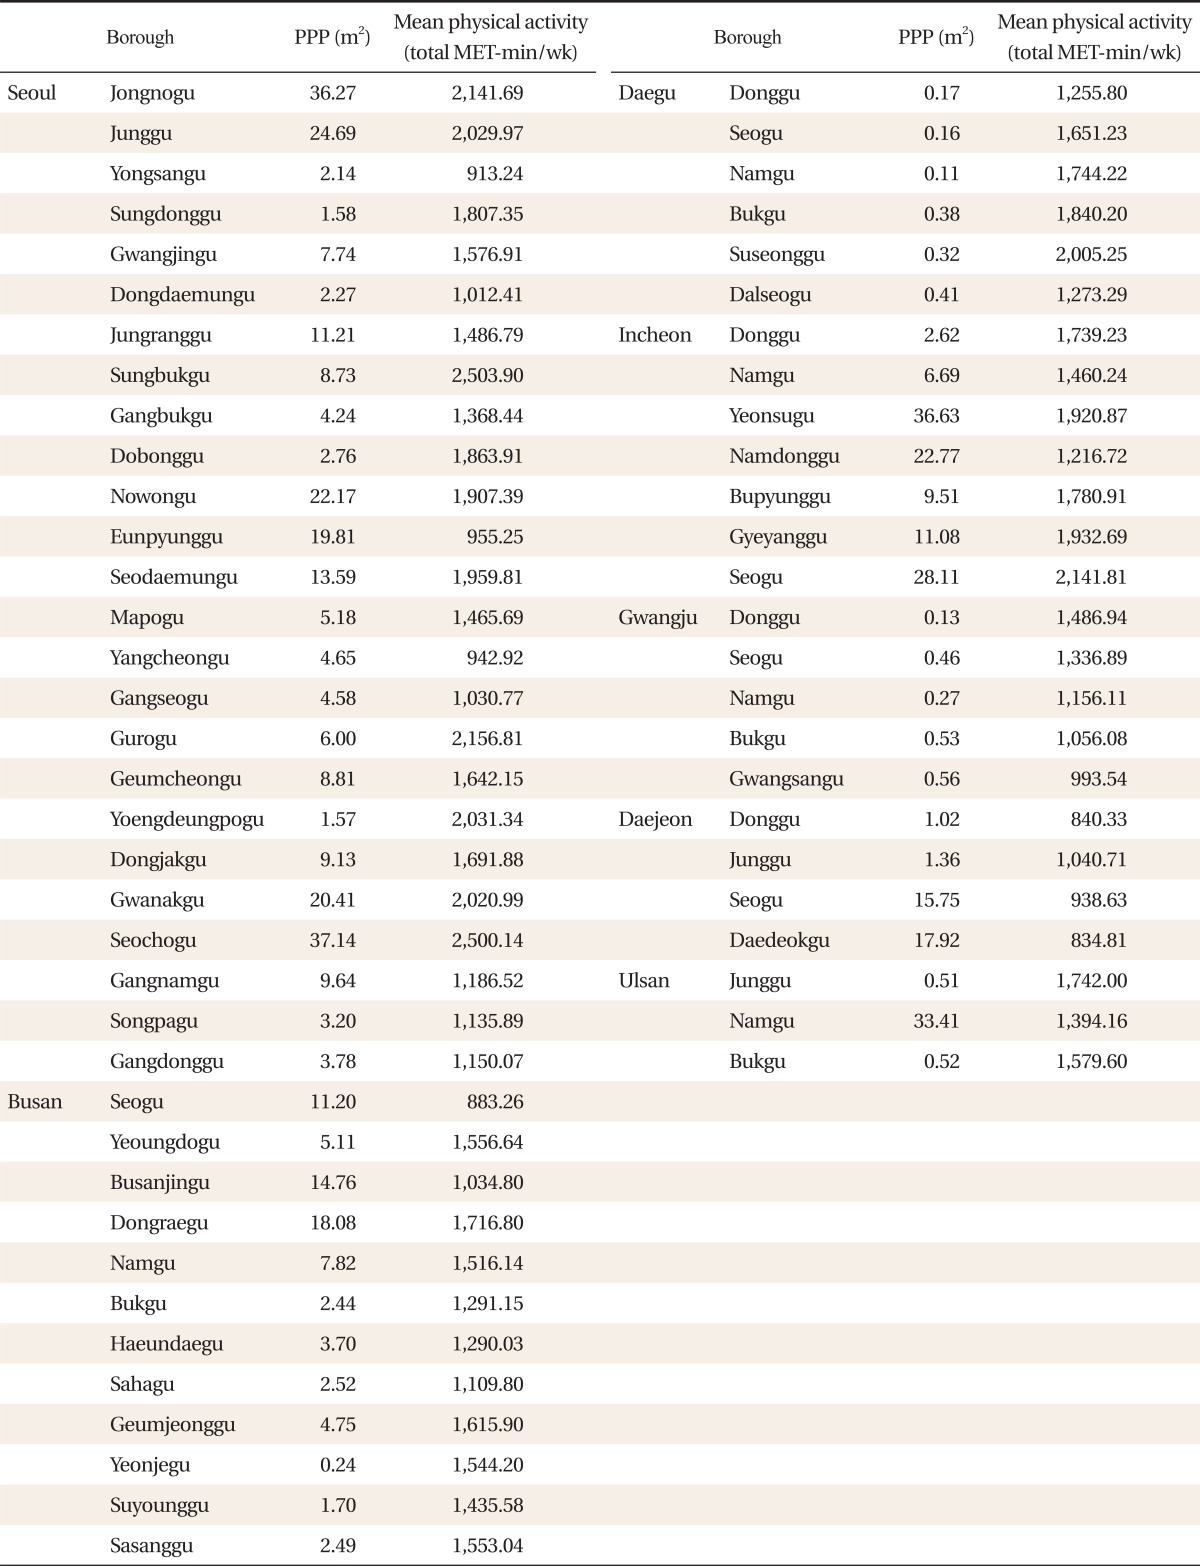
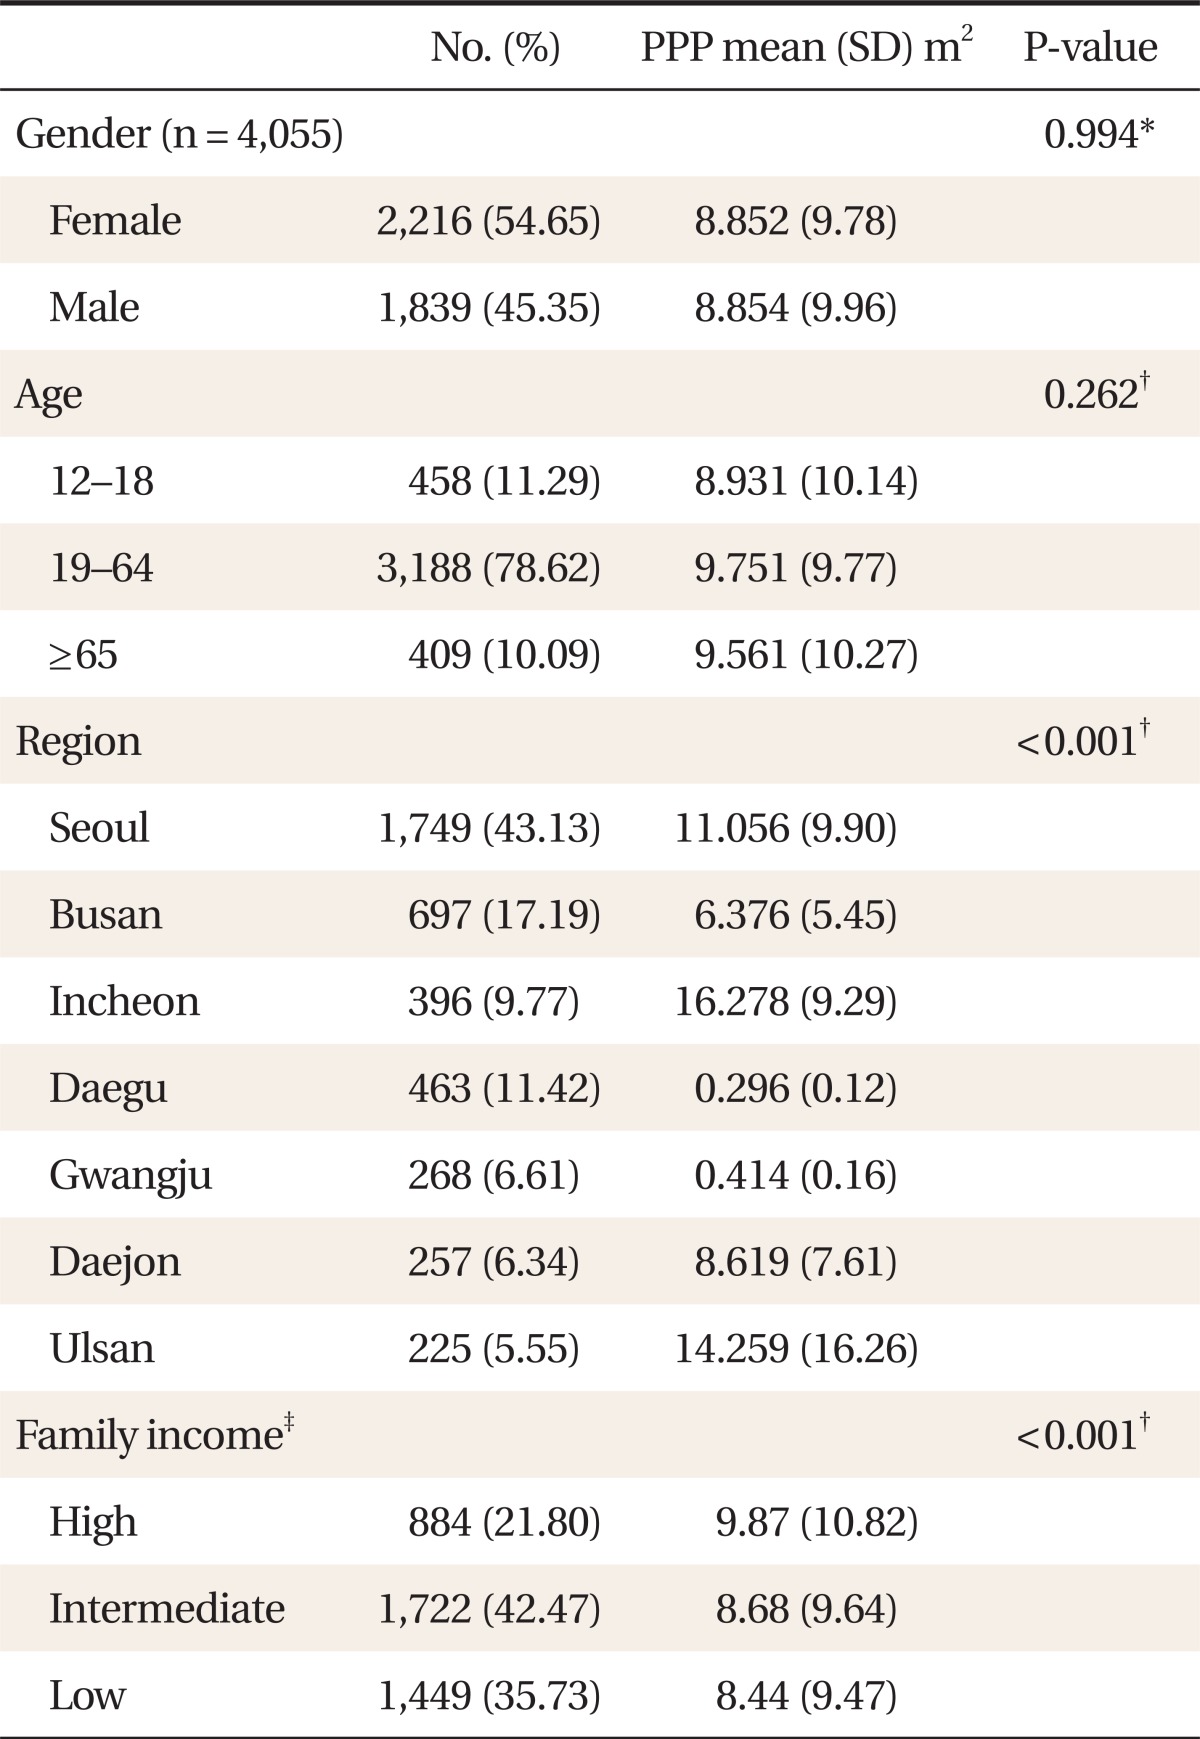
The area of park per person (PPP) and mean physical activity for each borough are presented in Table 1. There was no significant difference in PPP depending on sex or age group, but there was a significant difference in terms of family income: PPP increased when family income increased (Table 2). Furthermore, physical activity increased significantly when PPP increased (Table 3).
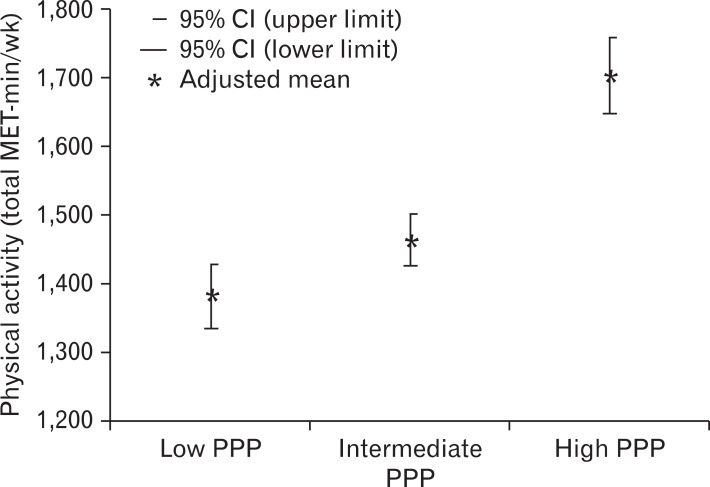
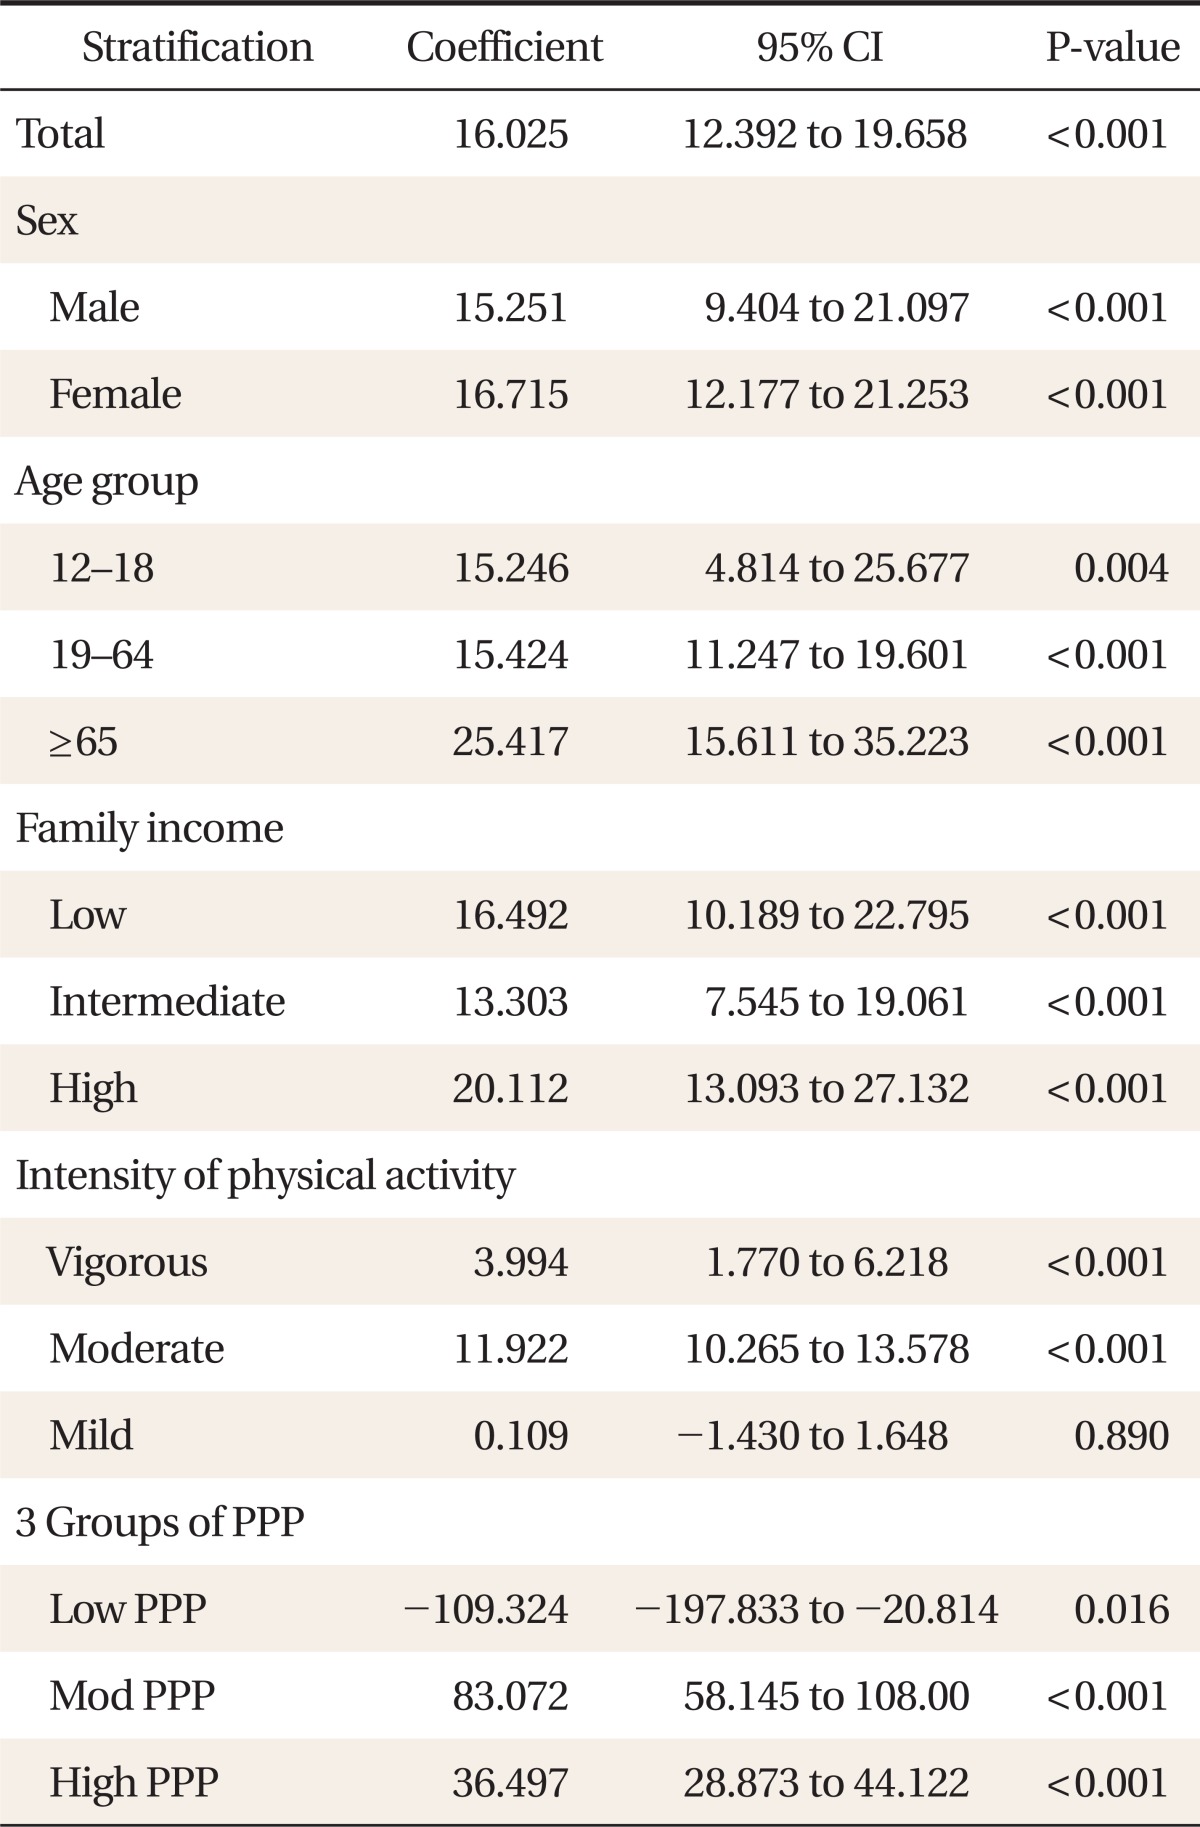
When PPP was divided into 3 groups, the adjusted mean increased with PPP (Figure 1). PPP and physical activity were positively correlated in both sex groups (Table 3). Moreover, physical activity increased in proportion to an increase in PPP across all age groups. The gradient was steepest in the above-65 age group (Table 3).
When stratified by family income, physical activity increased when PPP increased in all groups. The gradient was steepest in the high family-income group, followed by the low income group, and smallest in the intermediate income group (Table 3).
When we divided physical activity into low, moderate and high activity groups, physical activity increased in accordance with PPP in the moderate and high activity groups, but there was no significant correlation in the low activity group. When PPP was divided into 3 groups, physical activity decreased in the lowest PPP group when PPP increased, but in the intermediate and high PPP group, there were significant increases in physical activity according to PPP. The gradient was steepest in the intermediate PPP group.
In this study, physical activity dramatically increased in the high PPP group. This is because most boroughs had less than 5.0 m2 PPP, but the highest group had approximately 20 m2 PPP, which is much higher than the area for the intermediate group.
When stratified according to family income level, physical activity increased when PPP increased, regardless of the income level. The lowest income group had a steeper gradient than the intermediate income group, implying that the increase in PPP strongly influenced the increase in physical activity among people with insufficient income to access paid athletic facilities. One recent study found that those in low income groups experience fewer health disparities when they live in areas with large areas of green space.13) Similarly, that study suggested that the provision of green park spaces may mitigate differences in health behavior due to economic inequalities.
There was a significant negative correlation between PPP and physical activity in the lowest PPP group. In the intermediate PPP group, the increase in PPP showed a positive linear correlation with an increase in physical activity, with a steep gradient and thus good explanatory power. In the highest PPP group, the increases in physical activity and PPP were significantly correlated, but the explanatory power was weaker than that for the intermediate group. Therefore, we concluded that a certain level of PPP should be ensured in order to maintain a significant positive correlation between PPP and physical activity. Notably, some studies suggest that exercising in green spaces has greater mental and physical effects than doing so anywhere else;14,15) one study showed that children who live near large areas of green space experienced a decrease in body mass index during the 2 years of follow-up.16) Thus, green park spaces should be given preference in urban environment planning.
In Korea, not much research has been conducted to determine the link between neighboring environments and health. To our knowledge, our study is the first to explore the association between green environments and health. The key strengths of our method are that it used nation-level survey data and PPP statistics to accurately reflect the real state of community parks. One limitation of our study was that we could not ascertain the order of incidents because it was a cross-sectional study. In addition, we could not establish the distance from green park spaces to each person's residence, which could be an important factor. Although we adjusted for family income, we did not adjust for regional economic status, which may influence regional park conditions, and adjusting for regional economic status would have required multi-level analysis. Finally, adjustments should also be made for regional gyms, school playgrounds, and green spaces other than parks.
If one considers the personal level of medical condition, not only the personal cost, time spending and effort should be increased, but also environmental burden will grow due to the increase in medical practice that will affect the ecosystem adversely.17) In many regards, there are some limitations when we address medical problems through the one-to-one doctor-patient relationship. Anyone who wants to change their lifestyle will be affected by the neighborhood environment, which doctors are unable to influence.18,19)
In this study, an increase in PPP had a strong positive correlation with an increase in physical activity. This shows a clear relationship between neighborhood environments and personal health. Therefore, individuals can increase their physical activity when they live in areas with abundant green spaces, and urban planning officials should maintain their citizens' physical activity levels and health by providing sufficient park areas.
Looking beyond this study, there is more to be learned about the relationship between health and environmental factors. First, we can apply the same methods to rural areas. Second, we can find the distance that maximizes physical activity by analyzing the distance between residences and green park spaces. We also can study the relationship between green park spaces and other health-related indicators such as body mass index, blood pressure, blood sugar level, and mental health. Additionally, we can analyze differences in physical activity before and after moving to green neighborhoods. Finally, we can investigate the effect of the difference between physical activity performed in green spaces and that performed in other areas. We anticipate many subsequent studies relating to health and green spaces, with this paper as a starting point.

No potential conflict of interest relevant to this article was reported.

  • 1. Marmot M. Commission on Social Determinants of Health. Achieving health equity: from root causes to fair outcomes. Lancet 2007;370:1153-1163. PMID: 17905168.
  • 2. Jung SW, Cho YT. Neighborhood characteristics and individual health under Korean context. J Prev Med Public Health 2005;38:259-266. PMID: 16323625.
  • 3. Sallis JF, Saelens BE, Frank LD, Conway TL, Slymen DJ, Cain KL, et al. Neighborhood built environment and income: examining multiple health outcomes. Soc Sci Med 2009;68:1285-1293. PMID: 19232809.
  • 4. Centers for Disease Control and Prevention. Healthy places terminology [Internet]. [updated 2010 June 28; cited 2011 Feb 12]. Atlanta: Centers for Disease Control and Prevention; Available from: http://www.cdc.gov/healthyplaces/terminology.htm
  • 5. Groenewegen PP, van den Berg AE, de Vries S, Verheij RA. Vitamin G: effects of green space on health, well-being, and social safety. BMC Public Health 2006;6:149PMID: 16759375.
  • 6. Hartig T, Evans GW, Jamner LD, Davis DS, Garling T. Tracking restoration in natural and urban field settings. J Environ Psychol 2003;23:109-123.
  • 7. Maas J, Verheij RA, Groenewegen PP, de Vries S, Spreeuwenberg P. Green space, urbanity, and health: how strong is the relation? J Epidemiol Community Health 2006;60:587-592. PMID: 16790830.
  • 8. Mitchell R, Popham F. Greenspace, urbanity and health: relationships in England. J Epidemiol Community Health 2007;61:681-683. PMID: 17630365.
  • 9. Park CH. A change detection of urban vegetation of Seoul with green vegetation index extracted from Landsat data. J Korean Soc Remote Sens 1992;8:27-43.
  • 10. Centers for Disease Control and Prevention. Physical activity and health [Internet]. [updated 2011 Feb 16; cited 2012 May 5]. Atlanta: Centers for Disease Control and Prevention; Available from: http://www.cdc.gov/physicalactivity/everyone/health/index.html
  • 11. Cohen DA, McKenzie TL, Sehgal A, Williamson S, Golinelli D, Lurie N. Contribution of public parks to physical activity. Am J Public Health 2007;97:509-514. PMID: 17267728.
  • 12. Librett J, Henderson K, Godbey G, Morrow JR Jr. An introduction to parks, recreation, and public health: collaborative frameworks for promoting physical activity. J Phys Act Health 2007;4(Suppl 1):S1-S13. PMID: 17672219.
  • 13. Mitchell R, Popham F. Effect of exposure to natural environment on health inequalities: an observational population study. Lancet 2008;372:1655-1660. PMID: 18994663.
  • 14. Pretty J, Peacock J, Sellens M, Griffin M. The mental and physical health outcomes of green exercise. Int J Environ Health Res 2005;15:319-337. PMID: 16416750.
  • 15. Van Den Berg AE, Hartig T, Staats H. Preference for nature in urbanized societies: stress, restoration, and the pursuit of sustainability. J Soc Issues 2007;63:79-96.
  • 16. Bell JF, Wilson JS, Liu GC. Neighborhood greenness and 2-year changes in body mass index of children and youth. Am J Prev Med 2008;35:547-553. PMID: 19000844.
  • 17. Cox S. Sick planet: corporate food and medicine. 2008. London: Pluto Press.
  • 18. Giles-Corti B, Donovan RJ. The relative influence of individual, social and physical environment determinants of physical activity. Soc Sci Med 2002;54:1793-1812. PMID: 12113436.
  • 19. Rundle A, Neckerman KM, Freeman L, Lovasi GS, Purciel M, Quinn J, et al. Neighborhood food environment and walkability predict obesity in New York City. Environ Health Perspect 2009;117:442-447. PMID: 19337520.
Figure 1
The association between physical activity (total MET-min/wk) and 3 quantiles of public park per person (PPP). The mean area of PPP 3 quantiles: low PPP 0.765 m2, intermediate PPP 5.712 m2, and high PPP 20.577 m2. CI: confidence interval.
kjfm-34-58-g001.jpg
Table 1
Public park per person (PPP) and mean physical activity of each borough in seven large cities of Korea

MET: metabolic equivalent of task.

*Some boroughs had no respondent of International Physical Activity Questionnaire survey, so were excluded from above list.

kjfm-34-58-i001.jpg
Table 2
Public park per person (PPP) according to the baseline characteristics

*t-test. Analysis of variance. The mean income of each group: high 470.54, intermediate 239.40, and low 94.84 (×104 won/mo).

kjfm-34-58-i002.jpg
Table 3
The association between physical activity (total MET-min/wk) and public park per person (PPP)*

All results were adjusted by age, sex, family income except stratification variable itself.

MET: metabolic equivalent of task, CI: confidence interval.

*Linear regression.

kjfm-34-58-i003.jpg

Figure & Data

References

    Citations

    Citations to this article as recorded by  
    • Urban green space and risk of cardiovascular disease and mortality among residents of the same area: updated retrospective cohort study in South Korea
      Sun Jae Park, Jun Hwan Kim, Sumin Seo, Jiwon Yu, Jihun Song, Hye Jun Kim, Sangwoo Park, Seogsong Jeong, Sang Min Park
      Revista Española de Cardiología (English Edition).2026; 79(6): 510.     CrossRef
    • Espacios verdes urbanos, riesgo cardiovascular y mortalidad entre los residentes de una misma zona: estudio de cohortes retrospectivo y actualizado en Corea del Sur
      Sun Jae Park, Jun Hwan Kim, Sumin Seo, Jiwon Yu, Jihun Song, Hye Jun Kim, Sangwoo Park, Seogsong Jeong, Sang Min Park
      Revista Española de Cardiología.2026; 79(6): 510.     CrossRef
    • Green space is associated with new-onset stroke among Chinese middle-aged and older adults: data from China Health and Retirement Longitudinal Study (CHARLS)
      Qiong Lu, Cheng Lian, Xinglin Chen
      Frontiers in Public Health.2025;[Epub]     CrossRef
    • Associations Between the Built Environment and Physical Activity in Urban Asia: A Systematic Review
      Thitikorn Topothai, Chompoonut Topothai, Sarah Martine Edney, Shenglin Zheng, Zoey Tay, Viroj Tangcharoensathien, Falk Müller-Riemenschneider
      Journal of Physical Activity and Health.2025; : 1.     CrossRef
    • Assessment of Cultural Ecosystem Services and Well-Being: Testing a Method for Evaluating Natural Environment and Contact Types in the Harku Municipality, Estonia
      Fiona Nevzati, Mart Külvik, Joanna Storie, Liisa-Maria Tiidu, Simon Bell
      Sustainability.2023; 15(13): 10214.     CrossRef
    • Impact of Changed Use of Greenspace during COVID-19 Pandemic on Depression and Anxiety
      Seulkee Heo, Miraj U. Desai, Sarah R. Lowe, Michelle L. Bell
      International Journal of Environmental Research and Public Health.2021; 18(11): 5842.     CrossRef
    • Do persons with low socioeconomic status have less access to greenspace? Application of accessibility index to urban parks in Seoul, South Korea
      Seulkee Heo, Amruta Nori-Sarma, Sera Kim, Jong-Tae Lee, Michelle L Bell
      Environmental Research Letters.2021; 16(8): 084027.     CrossRef
    • Does the Connectivity of Urban Public Green Space Promote Its Use? An Empirical Study of Wuhan
      Yuping Dong, Helin Liu, Tianming Zheng
      International Journal of Environmental Research and Public Health.2020; 17(1): 297.     CrossRef
    • Association between urban green space and the risk of cardiovascular disease: A longitudinal study in seven Korean metropolitan areas
      Sumin Seo, Seulggie Choi, Kyuwoong Kim, Sung Min Kim, Sang Min Park
      Environment International.2019; 125: 51.     CrossRef
    • How Does the Built Environment in Compact Metropolitan Cities Affect Health? A Systematic Review of Korean Studies
      Dong Ha Kim, Seunghyun Yoo
      International Journal of Environmental Research and Public Health.2019; 16(16): 2921.     CrossRef
    • Correlates of Physical Activity Among Disadvantaged Groups: A Systematic Review
      Melinda Craike, Matthew Bourke, Toni A. Hilland, Glen Wiesner, Michaela C. Pascoe, Enrique Garcia Bengoechea, Alexandra G. Parker
      American Journal of Preventive Medicine.2019; 57(5): 700.     CrossRef
    • Effects of spatial scale on assessment of spatial equity of urban park provision
      Puay Yok Tan, Rosita Samsudin
      Landscape and Urban Planning.2017; 158: 139.     CrossRef
    • A conceptual framework for studying urban green spaces effects on health
      Liqing Zhang, Puay Yok Tan, Jessica A Diehl
      Journal of Urban Ecology.2017;[Epub]     CrossRef
    • Comments on Statistical Issues in March 2013
      Yong Gyu Park
      Korean Journal of Family Medicine.2013; 34(2): 156.     CrossRef

    Download Citation

    Download a citation file in RIS format that can be imported by all major citation management software, including EndNote, ProCite, RefWorks, and Reference Manager.

    Format:

    Include:

    Do People Have Healthier Lifestyles in Greener Environments? An Analysis of the Association between Green Environments and Physical Activity in Seven Large Korean Cities
    Korean J Fam Med. 2013;34(1):58-63.   Published online January 28, 2013
    Download Citation
    Download a citation file in RIS format that can be imported by all major citation management software, including EndNote, ProCite, RefWorks, and Reference Manager.

    Format:
    • RIS — For EndNote, ProCite, RefWorks, and most other reference management software
    • BibTeX — For JabRef, BibDesk, and other BibTeX-specific software
    Include:
    • Citation for the content below
    Do People Have Healthier Lifestyles in Greener Environments? An Analysis of the Association between Green Environments and Physical Activity in Seven Large Korean Cities
    Korean J Fam Med. 2013;34(1):58-63.   Published online January 28, 2013
    Close

    Figure

    • 0
    Do People Have Healthier Lifestyles in Greener Environments? An Analysis of the Association between Green Environments and Physical Activity in Seven Large Korean Cities
    Image
    Figure 1 The association between physical activity (total MET-min/wk) and 3 quantiles of public park per person (PPP). The mean area of PPP 3 quantiles: low PPP 0.765 m2, intermediate PPP 5.712 m2, and high PPP 20.577 m2. CI: confidence interval.
    Do People Have Healthier Lifestyles in Greener Environments? An Analysis of the Association between Green Environments and Physical Activity in Seven Large Korean Cities

    Public park per person (PPP) and mean physical activity of each borough in seven large cities of Korea

    MET: metabolic equivalent of task.

    *Some boroughs had no respondent of International Physical Activity Questionnaire survey, so were excluded from above list.

    Public park per person (PPP) according to the baseline characteristics

    *t-test. Analysis of variance. The mean income of each group: high 470.54, intermediate 239.40, and low 94.84 (×104 won/mo).

    The association between physical activity (total MET-min/wk) and public park per person (PPP)*

    All results were adjusted by age, sex, family income except stratification variable itself.

    MET: metabolic equivalent of task, CI: confidence interval.

    *Linear regression.

    Table 1 Public park per person (PPP) and mean physical activity of each borough in seven large cities of Korea

    MET: metabolic equivalent of task.

    *Some boroughs had no respondent of International Physical Activity Questionnaire survey, so were excluded from above list.

    Table 2 Public park per person (PPP) according to the baseline characteristics

    *t-test. Analysis of variance. The mean income of each group: high 470.54, intermediate 239.40, and low 94.84 (×104 won/mo).

    Table 3 The association between physical activity (total MET-min/wk) and public park per person (PPP)*

    All results were adjusted by age, sex, family income except stratification variable itself.

    MET: metabolic equivalent of task, CI: confidence interval.

    *Linear regression.

    TOP