Trends in Influenza Vaccination Coverage Rates among Korean Cancer Survivors: Analysis of the Korea National Health and Nutrition Examination Survey III–VI
Article information

Abstract
Background
Few studies have reported on the trends in influenza vaccination rates among cancer survivors in Korea. We investigated these trends over a recent 11-year period (2005–2015).
Methods
Data were obtained from the Korea National Health and Nutrition Examination Survey (KNHANES) III– VI (2005–2015). After excluding individuals younger than 40 years of age, the participants included 2,210 cancer survivors (861 men and 1,349 women). We categorized these study participants into four groups according to age and sex.
Results
The influenza vaccination rate decreased significantly among male cancer survivors, with rates of 74.8, 64.7, 56.2, and 55.2% (β coefficient=-0.257, P for trend <0.001) in KNHANES III, VI, V, and VI, respectively. While influenza vaccination rates decreased significantly among older male cancer survivors (≥65 years) (β coefficient=-0.359, P for trend=0.017), they increased among older female cancer survivors (β coefficient=0.375, P for trend=0.011) from 2005 to 2015.
Conclusion
Influenza vaccination rates in older cancer survivors significantly decreased in men but increased in women in successive KNHANES phases. Efforts are needed to improve immunization education and awareness, especially in older male cancer survivors.
INTRODUCTION
Influenza virus infections cause diseases ranging from the common cold to severe respiratory illness, which can be fatal [1]. Influenza pandemics in the recent centuries include the Spanish flu in 1918, avian influenza A H5N1 in 1997 and 2003, and H1N1 swine flu in 2009. These worldwide influenza pandemics were caused by highly pathogenic influenza viruses and led to a significant number of fatalities [2].
Guidelines recommend vaccination of cancer survivors, who are at high risk for influenza infection. The Advisory Committee on Immunization Practices recommends routine annual influenza vaccination for all persons aged at least 6 months if vaccination is not contraindicated [3]. Additionally, the Infectious Diseases Society of America recommends annual inactivated influenza vaccination for patients aged ≥6 months with hematological malignancies or solid malignant tumors [4].
According to Korean cancer statistics in 2015 [5], approximately 1.6 million people in Korea had a history of cancer diagnosis, and the 5-year relative survival rates for cancer have steadily improved, from 41.2% in 1993–1995 to 70.7% in 2011–2015. According to previous studies in Korea, the influenza vaccination rate among cancer survivors ranged from 34.1% [6] to 50% [7], indicating that only a small proportion of cancer survivors is vaccinated against influenza virus.
Although several studies have reported influenza vaccination rates among cancer survivors in Korea, none have reported trends in these rates according to age from nationwide data. Our study investigated recent 11-year trends in vaccination rates among Korean cancer survivors using data from the Korea National Health and Nutrition Survey (KNHANES) III (2005) to VI (2013–2015).
METHODS
1. Study Population
The KNHANES, which involves cross-sectional and nationally representative surveys, has been conducted by the Korea Centers for Disease Control and Prevention (KCDC) since 1998, following the National Health Promotion Act. The KNHANES has collected data on 23 households from each of the 192 districts as a probabilistic sample annually, surveying approximately 10,000 household members aged 1 year or older. To date, the KNHANES has been performed in six phases: KNHANES phase I (1998), II (2001), III (2005), IV (2007–2009), V (2010–2012), and VI (2013–2015). The sampling encompassed stratified, clustered, and systematic methods based on sex, age, and geographic area using household registries. To obtain information on health status, health behavior, socioeconomic demographics, and laboratory test results, the survey comprises three components: a health interview, a health examination, and a nutrition survey. Trained personnel conduct face-to-face interviews with participants. Participants may refuse to participate in this survey or may provide written consent [8].
We used data from KNHANES III, IV, V, and VI [9]. After excluding subjects younger than 40 years of age, we included 2,210 cancer survivors (861 men and 1,349 women) and 51,704 non-cancer (22,952 men and 28,752 women) participants. Information on socio-demographic characteristics, such as age, sex, education, household income, and residential area, was gathered from self-reported questionnaires completed in each relevant survey period.
The Institutional Review Board of the KCDC approved this study and confirmed that informed consent was obtained.
2. Definitions of Cancer Survivors, Vaccination, and Lifestyle Factors
Cancer survivors were defined as individuals who reported having been diagnosed with any cancer by physicians, based on self-reported questionnaires.
Influenza vaccination was considered positive if participants answered “yes” to the question “Have you been vaccinated against influenza (seasonal flu) within the past year?”
Individuals who engaged in vigorous physical activity 3 or more days per week for at least 20 minutes per day or in moderate physical activity (including walking) 5 or more days per week for at least 30 minutes per day were classified as having “sufficient physical activity” (as per the International Physical Activity Questionnaire Research Committee Guidelines for data processing and analysis of the International Physical Activity Questionnaire [10]. Men who consumed at least 7 cups and women who consumed at least 5 cups of alcohol at least twice per week were considered heavy alcohol drinkers [11]. Individuals who had smoked cigarettes during the relevant survey period were categorized as current smokers.
Education levels were divided into four groups: elementary school or less (education duration less than 6 years), middle school (education duration 6 to <9 years), high school (education duration 9 to <12 years), and college or more (education duration 12 years or more). Occupational status was categorized as manual workers, office workers, and other: (1) manual workers: clerks, or service or sales workers; skilled workers in agriculture, forestry, or fisheries, operators or assemblers of vehicles, boats, planes or equipment or other machinery; and factory workers; (2) office workers: managers, professionals, and administrators; and (3) other: defined as unemployed, housekeepers, and students. Individuals who experienced depressive mood for 2 or more consecutive weeks during the previous year were defined as having depressive symptoms. Participants who reported their level of stress as moderate or severe were defined as having stress symptoms. Finally, chronic diseases included hypertension, diabetes, liver cirrhosis, stroke, coronary heart disease, chronic renal disease, and lung diseases such as asthma, tuberculosis, and chronic obstructive pulmonary disease.
3. Statistical Analysis
All data on continuous variables are presented as means±standard errors (SEs). Data on categorical variables are presented as percentages±SEs. All sampling and weight variables were stratified, and the SAS survey procedure was used for statistical analysis to account for the complex sampling design and to provide nationally representative prevalence estimates. Survey regressions and chi-square tests were used to compare cancer survivors and non-cancer controls. P-values for the trends in vaccination rates were calculated among the KNHANES phases by logistic regression analyses after setting the phase as the continuous variable. Statistical analyses were performed using SAS ver. 9.4 (SAS Institute Inc., Cary, NC, USA). All statistical tests were two-tailed and statistical significance was defined as P-values <0.05.
RESULTS
The final analysis included 2,210 cancer survivors (861 men and 1,349 women) (Table 1). The mean ages of all cancer survivors, men, and women were 61.5, 64.2, and 59.8 years, respectively.
General characteristics of cancer survivors according to sex and KNHANES phase
Table 2 shows the general characteristics of cancer survivors and non-cancer controls. Cancer survivors were older than non-cancer controls for both sexes (64.2 versus 54.7 years in men and 59.8 versus 56.7 years in women). Cancer survivors were less educated, consumed smaller amounts of alcohol and tobacco, and had more chronic diseases than the non-cancer controls of both sexes. More male cancer survivors belonged to the low-income group. More female cancer survivors had a depressive mood. The three most common cancers were gastric (30.1%), colon (17.9%), and liver (7.2%) cancer in men and breast (21.4%), cervical (20.2%), and thyroid (17.2%) cancer in women.

Comparisons of general characteristics between cancer survivors and non-cancer controls
Table 3 shows the factors associated with influenza vaccination. Older cancer survivors were more likely to have been vaccinated against influenza (odds ratio [OR], 2.52; 95% confidence interval [CI], 1.10–5.79 in men and OR, 2.55; 95% CI, 1.46–4.44 in women).

Factors associated with influenza vaccination rates in cancer survivors in multivariate logistic regression analysis adjusted for all variables
Survivors who lived in rural areas were more likely to have been vaccinated than were those living in urban areas. According to the duration after cancer diagnosis, significantly higher adjusted ORs (aORs) and 95% CIs were observed for 5–10 and 10 years in men, at 2.35 (1.09–5.07) and 2.92 (1.03–8.27), respectively, whereas the aORs were not statistically significant in women. Age at cancer diagnosis was a central factor associated with influenza vaccination in both sexes. However, monthly household income, marital status, education levels, and occupation were not.
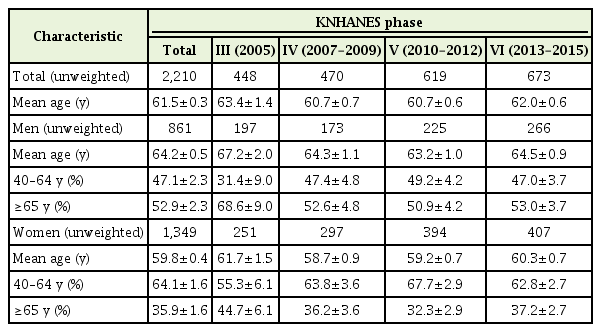
Figure 1 shows the influenza vaccination rates among cancer survivors and non-cancer control according to KNHANES phase. The influenza vaccination rates significantly decreased with successive KNHANES phases among male cancer survivors, at 74.8%, 64.7%, 56.2%, and 55.2% (β coefficient=-0.257, P for trend=0.012) (Figure 1A), but did not significantly change in female cancer survivors, at 67.6%, 45.6%, 51.2%, and 56.2% from KNHANES III to VI, respectively (P for trend=0.066) (Figure 1B). Among non-cancer controls, there was no significant trend for either sex (all P for trend >0.05). The influenza vaccination rates of men were higher in cancer survivors than those in non-cancer controls across all KNHANES phases (all P-value <0.05). Those of women cancer survivors were significantly higher than those in non-cancer controls in KNHANES V and VI.
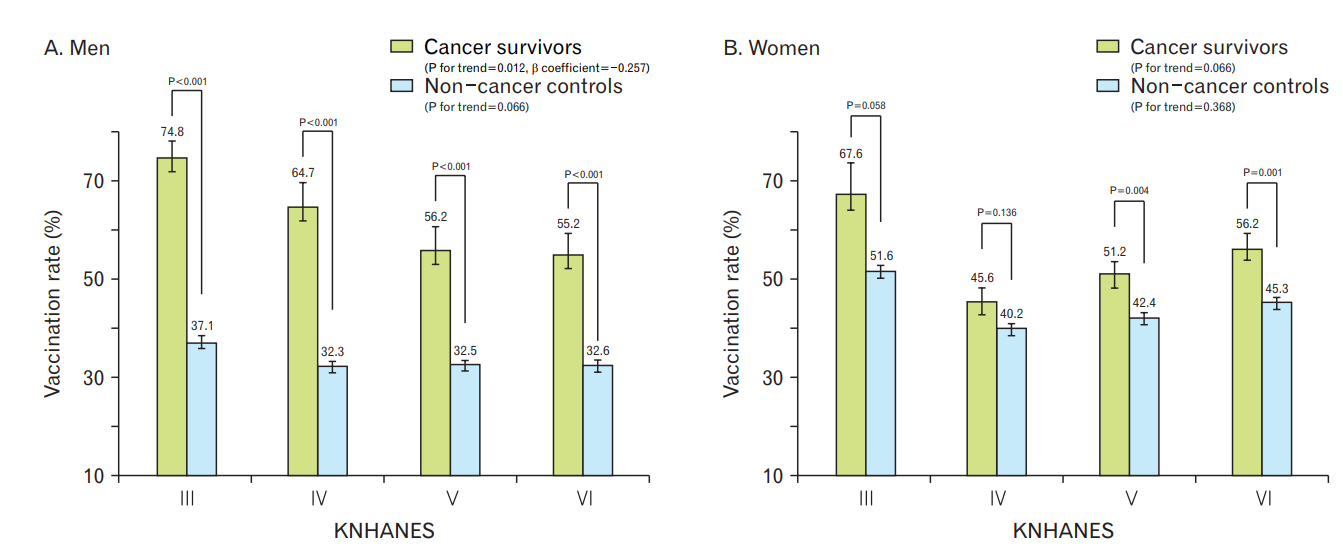
Trends for influenza vaccination rate among cancer survivors and non-cancer controls according to KNHANES phase. KNHANES, Korea National Health and Nutrition Examination Survey.
To investigate vaccination trends according to age, we stratified the participants into age groups of 40–64 and 65 years or older (Figure 2). Influenza vaccination rates significantly decreased with successive KNHANES phases in older male cancer survivors (β coefficient=-0.359, P for trend=0.017), whereas the rates did not significantly change in older non-cancer controls. In women, the vaccination rates increased significantly in both older cancer survivors and non-cancer controls (all P for trend >0.05). In cancer survivors younger than 65 years of age, influenza vaccination rates did not significantly change with KNHANES phase in either sex (all P for trend >0.05).
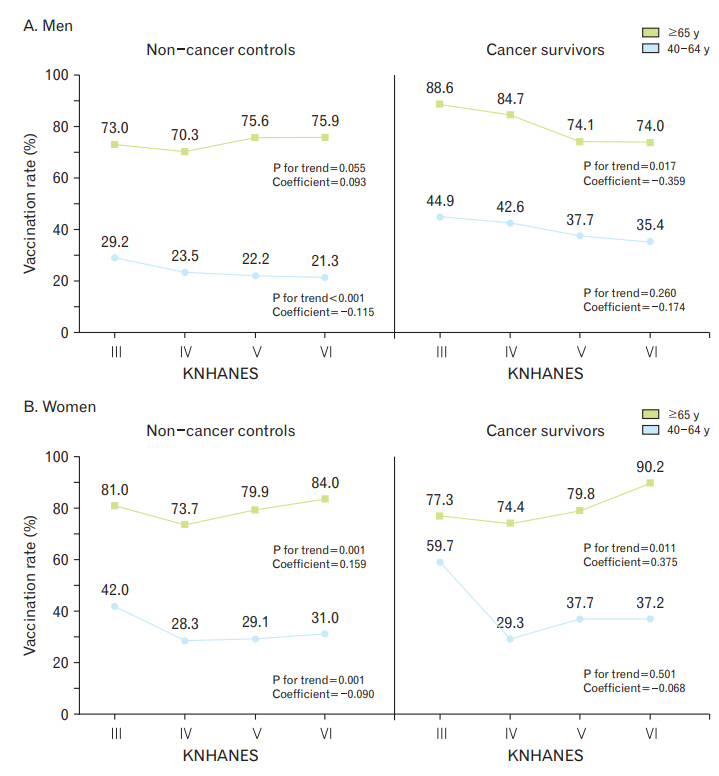
Trends for influenza vaccination rate among cancer survivors and non-cancer controls according to age group. KNHANES, Korea National Health and Nutrition Examination Survey.
DISCUSSION
This study investigated the trends in influenza vaccination among cancer survivors over the last 11 years. In this study, the influenza vaccination rates in cancer survivors were 74.8%, 64.7%, 56.2%, and 55.2% in men and 67.6%, 45.6%, 51.2%, and 56.2% in women from KNHANES III to VI, respectively. Those trends significantly decreased with KNHANES phase in male cancer survivors and did not change in female cancer survivors before stratification by age. Stafford et al. [12] reported an overall percentage of vaccine coverage among cancer survivors of 64%, which was similar to our findings. Several Korean studies reported influenza vaccination coverage over 60% in a high-risk group and in cancer survivors, which were higher than that in the general population [13-15]. Morbidity and mortality rates are unusually high among individuals who are older and have risky medical conditions such as malignancies. Moreover, influenza-related respiratory infections in patients with cancer are often associated with costly hospitalizations, delays in potentially life-saving therapies, and death [16]. Korean health authorities provided free annual influenza vaccines to vulnerable populations such as infants and individuals older than 65 years through the National Immunization Program (NIP) [17]. Partly because of the NIP, the immunization rate against influenza among older Korean individuals is higher than that in other countries [18].
With the increase in the number of cancer survivors, the importance of managing chronic and infectious diseases in these individuals has also increased. Guidelines for cancer survivors recommend influenza; pneumococcal; and tetanus, diphtheria, and pertussis vaccinations according to the usual doses and schedules and human papillomavirus vaccine in survivors aged less than 26 years [19].
As reported by Choi et al. [7], our analysis showed a higher influenza vaccination rate in older cancer survivors than that in younger cancer survivors. Moreover, the influenza vaccination rate increased significantly with KNHANES phase in older (≥65 years) female cancer survivors. However, in older (≥65 years) male cancer survivors, despite free immunization through NIP, the influenza vaccination rate significantly decreased with KNHANES phase in the present study.
In the United States, the Healthy People 2020 initiative has set a target influenza vaccination rate of up to 90% among high-risk adults [20], while the European Union Council has recommended influenza vaccination rates of up to 75% among at-risk populations [21]. In Korea, there is no specific target rate for cancer survivors, but the KCDC has set a goal influenza vaccination rate of over 82.5% of the older population [9]. However, as indicated above, the influenza vaccination rate of cancer survivors in Korea has not reached either international or domestic targets. For example, in 2009, only 34.1% of cancer survivors had received an H1N1 vaccination and 53.5% had not considered the need for vaccination [6]. Another Korean study reported influenza vaccination rates of 50.3% and 31.5% in patients with and without cancer, respectively [7]. Despite higher vaccination coverage in cancer survivors than that in the general population, the influenza vaccination rate in younger cancer survivors should be increased [7,22].
The results of this study showed a significantly vaccination rate among cancer survivors than that of patients without a history of cancer. The most recent vaccination rate of female cancer survivors aged 65 years or older (90.2%) reached the goal of USA Healthy People 2020 and the KCDC, while rates of younger and older male cancer survivors were below the target. The vaccination rate was most closely related to age rather than socioeconomic status such as education level or occupation. In previous Korean studies, the relationship of education level and household income with vaccination rate was not consistent [23].
In part, higher vaccination rates in rural areas might have resulted from free immunization through the NIP, which began in 1997 in low-income older populations and expanded to all adults over 65 years at public health centers from 2005 until 2014. Since 2015, the NIP for influenza has been expanded to private health sectors as well as public health centers [15]. The accessibility of public health centers is better in rural areas than that in urban areas. Even rural areas have good transportation systems and are highly connected. Distances between villages in Korea are not very great. Vaccination is also generally performed in groups.
Identification of barriers can result in achieving target vaccination rates and preventing severe influenza infection. The low vaccination rate in cancer survivors or patients with chronic diseases such as diabetes mellitus may be due to the low rate of vaccination at ages not included in the NIP. Because of the limitation of the survey questions, we could not confirm the reason for these results; however, it might be an epiphenomenon. The National Vaccine Advisory Committee recently suggested that health-care providers and patients lack knowledge and awareness about immunization [24]. However, based on the previous study, decreased vaccination rates in male patients ≥65 years of age may be due to the lack of appropriate advice or information on the need for influenza vaccination or misconceptions about complications after influenza vaccination [25]. Additional research is needed. To increase the influenza vaccination rates for vulnerable at-risk populations such as cancer survivors, more efforts, such as education on vaccines by primary physicians and mass media are needed, especially for older men.
The present study has several limitations. First, we could not entirely exclude the possibility of reporting bias, as we utilized data from self-reported questionnaires for the diagnosis of cancer. Thus, the actual number of cancer survivors may have been underreported. Second, the KNHANES does not include people admitted to hospitals or nursing homes; therefore, the influenza vaccination rate among cancer survivors may have been underreported. Third, the cross-sectional study design was insufficient to conclude causality. As mentioned above, from 2015 onward, distribution of free vaccines was extended to private clinics. Expansion of the NIP is expected to result in changes in vaccination coverage, and further research is needed to identify related factors affecting vaccination rates.
Despite these limitations, the present study has several strengths. Our findings were derived from a large population-based sample with a complex survey design that aimed to generate estimates representative of the Korean population. To our knowledge, this is the first Korean study to examine trends in influenza vaccination coverage rates over the past decade using nationally representative data.
In conclusion, there were sex differences in influenza vaccination rates among cancer survivors. The coverage rate was significantly higher in older women and lower in older men in the KNHANES. Public disease prevention efforts are needed for male cancer survivors.
Notes
CONFLICT OF INTEREST
No potential conflict of interest relevant to this article was reported.
Acknowledgements
This work was supported by the research grant of the Chungbuk National University Hospital in 2019.