INTRODUCTION
Urinary incontinence is a significant public health concern for women that not only affects the physical, psychological, and social aspects of a womanŌĆÖs life, but is also associated with financial burden [1]. The time period of pregnancy in a womanŌĆÖs life has long been established as the predisposing factor in the development of urinary incontinence, which potentially increases in prevalence throughout a lifetime or later in life [2]. Across Malaysia, prevalence of urinary incontinence increased between 34% and 85% during pregnancy over the past 5 years [3,4]. Despite this fact, there are limited continence status screenings during antenatal visits, and not all women are informed about the implications of urinary incontinence during pregnancy [4]; this is concerning and has an impact particularly for pregnant women who do not seek help for onset of urinary incontinence during pregnancy. This is due to unawareness of the fact that urinary incontinence during pregnancy is not a natural physiological change; indeed, it is a highly preventable and treatable condition [5,6]. Moreover, the literature reveals that the overall knowledge and practice of pelvic floor muscle exercise (PFME) remains poor among pregnant women in Malaysia [3,4,7]. Indeed, the delay in providing accurate and timely information concerning preventive strategies of urinary incontinence may hinder pregnant women from adopting preventive actions and interventions during pregnancy.
Contemporary research reviews have established PFME as a first-line preventive measure and as treatment for urinary incontinence during pregnancy and postpartum period, and it should be offered to all pregnant women in the early stage of their pregnancy, even in the absence of incontinence [8-10]. Although many studies have reported the effectiveness of antenatal PFME on urinary incontinence, few studies have addressed the effectiveness of PFME interventions on key behavioral change variables, including knowledge, attitude, practice, and self-efficacy. Moreover, the theoretical basis for PFME intervention is poorly defined, given the importance of behavioral changes in the success of PFME intervention in the prevention and management of urinary incontinence [11,12]. In response to the above issues, this study aims to develop, implement, and evaluate the effectiveness of a theory-driven PFME intervention on knowledge, attitude, practice, and self-efficacy of PFME, and to determine whether this intervention improves the continence status and severity of urinary symptoms among pregnant women.
METHODS
1. Study Design
A single-blinded, two-armed randomized control trial (RCT) was conducted at the Maternity Hospital of Kuala Lumpur (MHKL), located in the central region of Kuala Lumpur. The MHKL is one of the largest and busiest maternity hospitals in Malaysia, and it serves as a tertiary referral center for government antenatal clinics, private hospitals, and private clinics in the region of the Klang Valley. The list of all pregnant women who attended the outpatient antenatal clinic in MHKL was assessed and those who were found to be eligible for the study served as the sampling frame. For each eligible pregnant woman who attended the antenatal clinic, research assistants randomly picked a card containing 170 odd numbers and 50 even numbers in which the pregnant women with an odd number drawn were selected for the study. This random selection process was continued until we reached the required sample size. Random selection was employed to ensure that each eligible pregnant woman in the sampling frame had an equal chance of being selected for the study.
The inclusion criteria of this study were pregnant women from 18 to 20 weeks of gestation, regardless of their continence status and parity, with a singleton pregnancy, and who had provided informed consent to participate in this study. Since the risk status of pregnancy is generally confirmed at 18 to 20 weeks of gestation, individuals were chosen who were in this period of gestation, and high-risk or complicated pregnancies were excluded from this study. Other exclusion criteria included the following: pregnant women aged <18 years, non-Malaysians, women undergoing physiotherapy treatment for severe urinary incontinence, previous urogenital surgery, and chronic medical disorders before pregnancy.
As the study included both categorical and continuous outcomes, the sample size was calculated for both outcomes. The sample size calculation was performed to achieve 80% power at the 5% level of significance and allowed 20% dropout for both categorical and continuous outcomes. For the primary outcome, there was no prevailing information of the intended outcome; therefore, the required sample size was estimated using a medium effect size of 0.50 based on effect size benchmarks suggested by Chow et al. [13] in 2008, and the total sample size was estimated to be 80 respondents per group. For the categorical outcome, the minimum required sample size was 85 respondents per group estimated using sample size formula comparing two proportions; meanwhile, n=(Z╬▒/2+Z╬▓)2 ├Ś[p1 (1-p1)+p2(1-p2)]/ąä2 was used to detect 20% risk reduction in 34.3% of Malaysian pregnant women with urinary incontinence [3,8,13] A large sample size of 170 was selected for this study.
The randomization process was prepared in consultation with a biostatistician using a computer-generated stratified permuted block size of 6. Stratification was undertaken based on continence status and parity to ensure that respondents who were continent/incontinent and nulliparous (women in the first pregnancy)/multiparous were balanced across the intervention and control groups. After obtaining written informed consent forms and completion of the baseline assessments, the research assistants, who were blinded to block size, opened sequentially numbered opaque envelopes within each block corresponding to each stratum to allocate the selected respondents to either the intervention or control group. This process was continued until a total of 170 respondents were allocated to either group.
A single-blind method was used in which respondents were blinded to group allocation by promising that all respondents would obtain the intervention at different times; meanwhile, the respondents in the study were unaware that one group was a control group. Indeed, details of the intervention and control groups were not revealed in the consent forms or in the verbal clarification of the informed consent procedure. Further, to avoid potential contamination resulting from interaction between the respondents, all subjects were requested to withhold information of their participation in the studies. The intervention session was scheduled and held in a private meeting room.
2. Development of Pelvic Floor Muscle Exercise Intervention
The development of PFME interventions includes developing an intervention manual and information booklet. The content of the PFME intervention was based on six concepts of the Health Belief Model, which have been proposed as motivational elements to commence and adhere to PFME: perceived susceptibility, perceived severity, perceived benefits, perceived barriers, self-efficacy, and cues for action [12]. The Elicit-Provide-Elicit approach of Motivational Interviewing was used to provide information on PFME to enhance adherence to this intervention through active discussion among participants, educators, or clinicians [12,14]. The structure of the PFME intervention was designed based on the recommendations of Hay-Smith et al. [11], which includes education sessions, message reminders, and booster sessions. Table 1 displays the content and delivery of the interventions.
The intervention was validated in terms of quality control. Experts comprising senior consultants in Family Medicine, Public Health and Psychology from the Universiti Putra Malaysia (UPM) Faculty of Medicine and Health Sciences, and Physiotherapy at Hospital Kuala Lumpur reviewed the PFME intervention and provided qualitative suggestions with comments. These included the accuracy of the content, organization of information, application of the theory, relevance of the intervention, and comprehensibility. In response, the content of the intervention was revised and modified to meet the local context. The face validity of the intervention was supported by the findings of focus group discussions demonstrating that intervention users/physiotherapists and intervention recipients/pregnant women acknowledged and accepted the intervention.
The PFME intervention was pre-tested using a single-group prepost-test design among 30 pregnant women in MHKL who were not part of the main study using a convenience sampling method. The PFME intervention was delivered in a single session that focused predominantly on the education of the PFME intervention for the participants who were assessed on changes in knowledge and attitude at baseline and immediately post-intervention. The results of the pilot test indicated that the PFME intervention may be suitable for use in pregnant women, given that there was a significant improvement in PFME knowledge items ranging from 38.4% correct at baseline to 92.6% immediately post-intervention (P<0.001), and a favorable attitude towards PFME ranged from 75.8% at baseline to 98.4% immediately post-intervention (P=0.011).
The fidelity of the intervention was randomly checked by one observer, who was a senior breastfeeding educator. Additionally, the primary researcher, who was a physiotherapist, assisted in enhancing the consistency and reliability of the intervention.
3. Intervention Group
The intervention group received PFME in addition to the usual perinatal care. The first PFME education session was provided to a group of approximately 4ŌĆō8 individuals for 35 to 40 minutes before 22 weeks of gestation. During this time, the primary researcher actively engaged in facilitating open discussion and provided information and demonstration of skills based on the PFME intervention manual. The respondents also received a copy of the PFME information booklet, along with a weekly short text message as a reminder to reinforce the practice of PFME over 8 weeks after the first session, as the first 8 weeks of PFME are crucial in the prevention and treatment of urinary incontinence [9]. This was followed by periodic individual and/or group booster sessions, with a duration of approximately 15ŌĆō20 minutes at 4 weeks post first education session, early third trimester 28ŌĆō30 weeks gestation, and late third trimester 36ŌĆō38 weeks of gestations. These booster sessions specifically focused on reinforcing the skills and aims for targeted PFME, and on discussing experiences, challenges, and barriers in practicing PFME that helped to facilitate continuous practice of the intervention.
4. Control Group
The respondents allocated to the control group received the usual perinatal care at the MHKL. They also took part in standard hospital-based antenatal and postnatal education, which was normally offered to pregnant women in the late third trimester and during the hospitalized postnatal period. This education included a brief description of urinary incontinence and PFME.
5. Outcome Measurement
The primary outcome measures of knowledge, attitude, and practice of PFME were assessed using the Knowledge Attitude Practice (KAP) questionnaire, which was adapted and modified with the authorŌĆÖs permission in order to address all aspects of current PFME knowledge, attitudes, and practices that were related to urinary incontinence in our study population [7]. The original KAP questionnaire is available in both English and Malay, but only the English version has been validated. Changes made to the English version of the KAP questionnaire were then applied to the pre-existing Malay version of the questionnaire.
Categorical responses (true/false/donŌĆÖt know) were applied for 18 knowledge questions and a correctly answered question was assigned a score of one point, while a score of zero was assigned for a wrong or ŌĆ£donŌĆÖt knowŌĆØ answer. A 5-point Likert scale was used to measure the eight questions relating to the attitude towards PFME, in which each positive item was scored as either 1 (strongly disagree), 2 (disagree), 3 (neutral), 4 (agree), or 5 (strongly agree), and the scoring was reversed for any negative items. Using a 5-point Likert scale, five questions relating to PFME practice were rated: 1=never, 2=uncommon, 3=typically, 4=frequent, and 5=always.
For detection of the PFME self-efficacy primary outcome, the Self-Efficacy Scale for Practicing Pelvic Floor Exercises (SESPPFE) was used comprising of 17 questions with answers ranging from 0 (not confident at all) to 100 (the most confident) [15]. The final scores were obtained by calculating the mean of the items, ranging from 0 to 100, in which higher values were equivalent to higher self-efficacy in practicing PFME. The SESPPFE was translated into the Malay language using a standard forward-backward translation procedure.
The secondary outcome measures, such as continence status and severity of urinary incontinence, were measured using a validated Malay version questionnaire based on the International Consultation on Incontinence Questionnaire-Urinary Incontinence-Short Form, ICIQ-UI-SF [16]. The severity of urinary incontinence was scored based on the first three questions in the ICIQ-UI-SF, which includes the frequency of urinary incontinence, the amount of leakage, and overall inconvenience related to daily activities, with an overall score between 0 and 21. Greater values of the overall scores indicated increased severity of urinary incontinence.
The Malay versions of KAP, SESPPFE, and ICIQ-UI-SF were evaluated by a group of experts consisting of a psychologist from the UPM Faculty of Medicine and Health Sciences, a senior midwife, and a senior physiotherapist from MHKL for their appropriateness, relatedness, clarity, and presentation format. Some of the questions were fine-tuned for the questionnaireŌĆÖs overall continuation, as recommended by the experts. Subsequently, the face validity of the questionnaire was tested with 10 pregnant women who attended antenatal follow-up in the outpatient obstetric clinic in MHKL. The questionnaire was well accepted by the participants and took 5 to 10 minutes to complete. Statistical analysis was undertaken in the pilot test to determine internal consistency reliability, which was acceptable for each questionnaire with CronbachŌĆÖs ╬▒ ranging between 0.71 and 0.88.
At baseline, information on socio-demographic characteristics, clinical and obstetric characteristics, and health status were collected. In both study groups, data were collected at baseline immediately after recruitment and at three other points in the early third trimester (28ŌĆō30 weeks of gestation), late third trimester (36ŌĆō38 weeks of gestation), and early postnatal period (4ŌĆō6 weeks after delivery), where the prevalence of urinary incontinence was found to be high throughout this period [2].
6. Data Analysis
Data were analyzed using IBM SPSS ver. 23.0 (IBM Corp., Armonk, NY, USA). The respondents of the study were described using descriptive statistics. Variations in baseline respondent characteristics between the intervention and control groups were analyzed using t-tests or the Mann-Whitney test for continuous variables, and chi-square tests or Fisher tests for categorical variables.
Intervention effects were analyzed with a generalized estimating equation (GEE) based on a modified intention-to-treat population that excluded respondents without follow-up measures or non-completers using a last observation carried forward imputation strategy. The GEE was used due to its flexibility, since it can accommodate unbalanced data, miss-specified correlation structure, and repeated correlated data together with unequally spaced time intervals of data collection that includes continuous and categorical outcomes [17].
For the GEE analysis, the model includes study groups, time, covariates, and group by time interaction using an autoregression working correlation with the smallest quasi-likelihood criterion adjusted for potential covariates, which was presented for each outcome. For continuous outcome measures, the link function was identified, while the logit link function was adopted for the binary outcome measure. The GEE analysis for intervention effect was illustrated as the estimated regression coefficients (╬▓ values) or differences in means for continuous outcomes, and binary outcome as the estimated odds ratios for difference in percentage with a 95% confidence interval and significance level, alpha (╬▒) set at 0.05. A sensitivity analysis, included an intention-to-treat population with multiple imputation, complete cases that included all available data at baseline, and at all follow-ups, using GEE was carried out to determine the impact of departures from the assumption underlying the main analysis.
Ethics approval for this study was obtained from the Malaysian Ministry of Health Medical Research Ethics Committee (MREC) (NMRR-16-2029-28782) and the UPM Ethic Committee for Research involving Human Subjects (FPSK [MREC 17] P015). Written informed consent was obtained from each respondent prior to data collection. This study was retrospectively registered in the Australian New Zealand Clinical Trial Registry (ACTRN12619001733167).
RESULTS
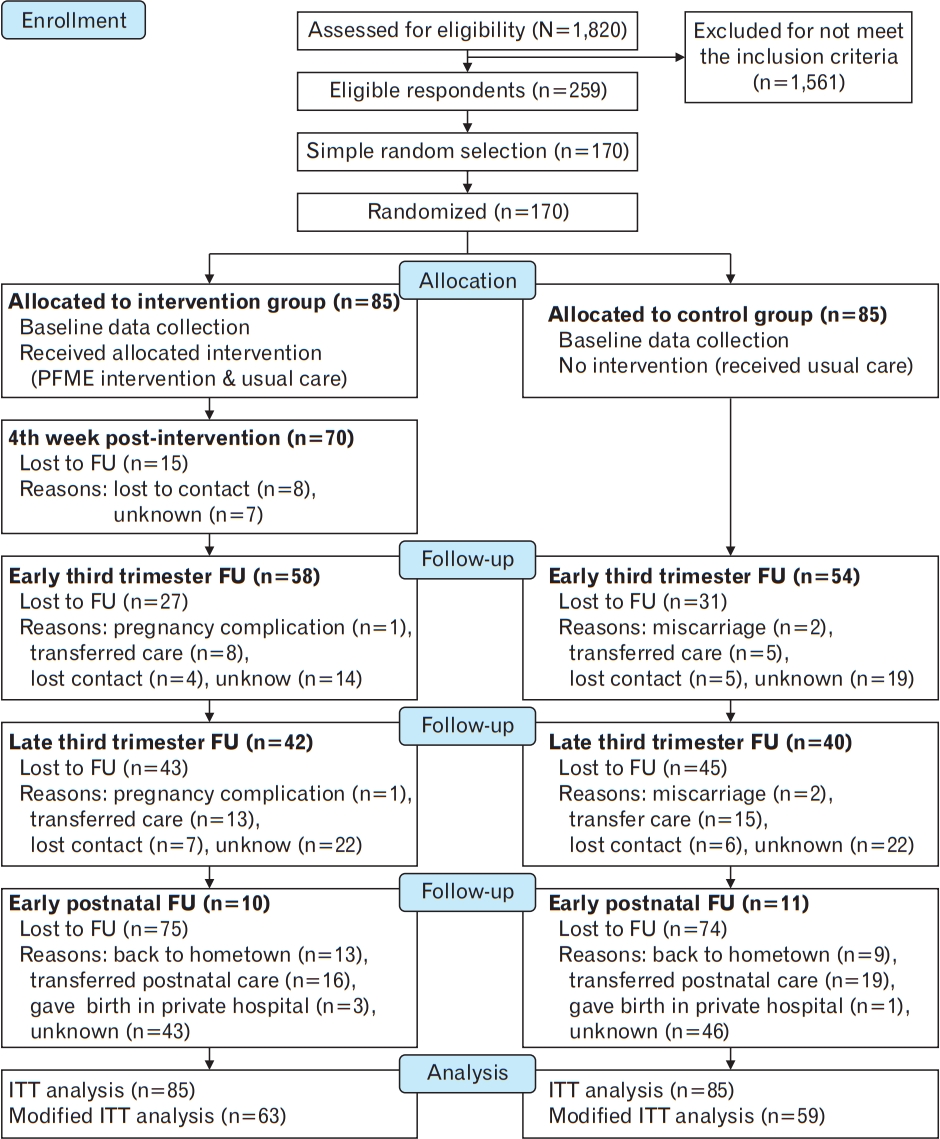
The screening and recruitment processes took place between May 2017 and March 2018, with follow-ups performed until July 2018. As shown in Figure 1 (CONSORT [Consolidated Standards of Reporting Trials] diagram), a total of 1,820 subjects were screened to assess their eligibility, among which 1,561 subjects failed to meet the inclusion criteria; meanwhile, from a total of 259 pregnant women who met the inclusion criteria, 170 respondents were chosen at random and assigned to one of two study groups. Over half of the respondents, specifically 122 (71.7%), completed at least one follow-up, while 40 (23.5%) completed only one follow-up, 71 (41.7%) completed two follow-ups, and 11 (6.4%) completed all three follow-ups. There was no significant difference in the lost to follow-up rates between the intervention and control groups at any time point (P>0.05).
Table 2 displays the baseline sociodemographic and clinical characteristics of the respondents and a comparison between the intervention and control groups. The respondents were predominantly Malay, tertiary educated, working, non-smokers, multiparous, had vaginal deliveries, and constipation. Approximately one-third of the respondents had self-reported health problems. Among the 62 respondents (36.5%) who reported having urinary incontinence, 54 (31.8%) had stress urinary incontinence, and almost 17% reported pre-pregnancy urinary incontinence.
Baseline differences between the intervention and control groups were detected only for body mass index (P=0.049). However, the non-completers without any follow-up were nearly 2 years younger (P=0.046), urinary continence (P=0.022), and nulliparous (P=0.015) compared to the completers. The completers (with at least one followup) in the intervention group were more likely to be tertiary-educated (P=0.025) than the control group. Given these small differences in baseline characteristics, the randomization process was unlikely to have been compromised in this study.
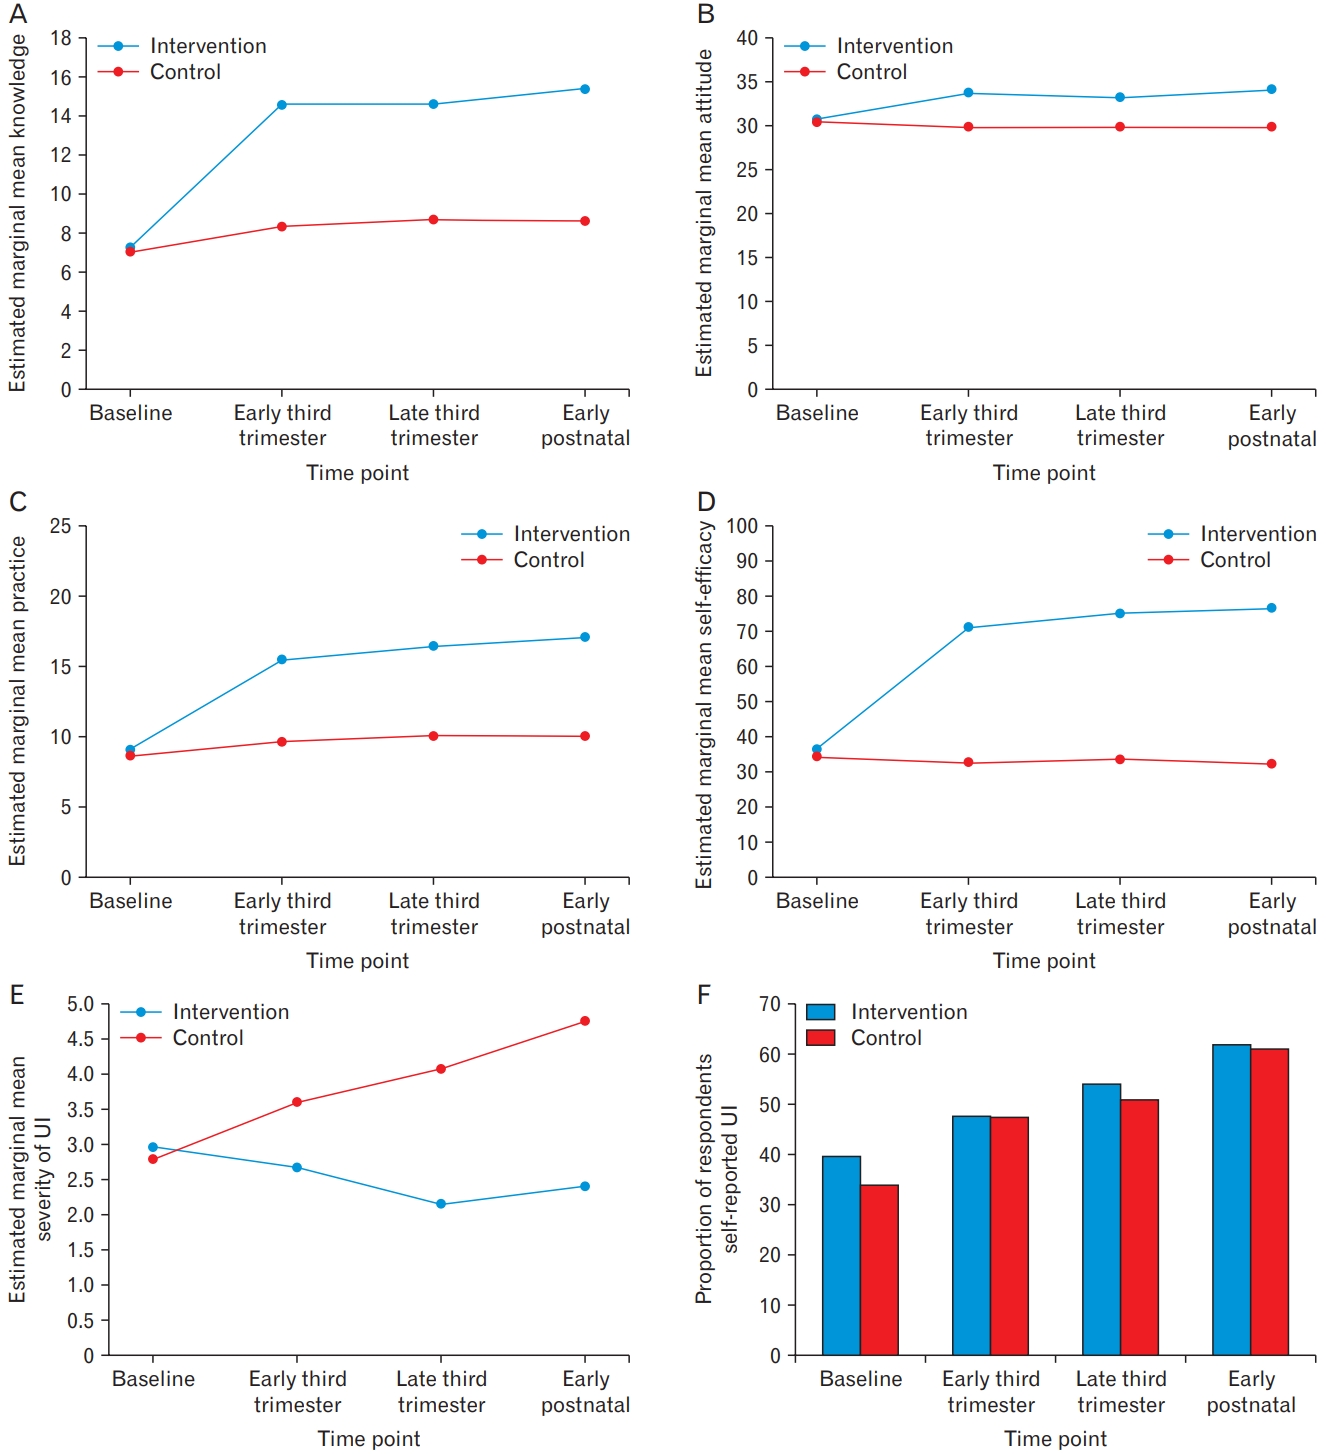
Figure 2 and Table 3 display the results of the GEE model for primary and secondary outcome measures based on the modified intention-to-treat sample (n=122). The intervention group showed significant improvements relative to baseline in all primary outcomes at each time point compared to the control group. The knowledge scores from baseline in the intervention group were 6.04 (P<0.001), 5.71 (P<0.001), 6.58 (P<0.001) higher in the early third trimester, late third trimester, and early postnatal period, respectively, compared to the control group. From the late third trimester to the early postnatal period, an improvement in the knowledge score of 0.88 point (P=0.015) was observed in the intervention group. Meanwhile, in the control group, there was a small increase in knowledge score ranging between 1.25 and 1.61 points (P<0.05).
The intervention group showed an increase in the attitude score with the estimated mean difference changes compared to control groups increasing by 3.59 (P=0.002), 3.15 (P=0.006) and 3.97 (P<0.001) points from baseline to early third trimester, late third trimester and early postnatal, respectively. In addition, the attitude score increased by 0.82 points (P=0.034) from the late third trimester to early postnatal period. A similar trend was found for practice scores in the intervention group compared to those in the control group, with an increase in the estimated mean difference from baseline by 5.40 points (P<0.001) in the early third trimester, 5.93 points (P<0.001) in the late third trimester, and 6.58 points (P<0.001) in the early postnatal period. Likewise, there was a significant increase in practice score by 1.18 points (P=0.038) from early third trimester to the early postnatal period; meanwhile, there was a marginal increase in practice score (0.65 points, P=0.051) from the late third trimester to the early postnatal period. The self-efficacy scores over time in the intervention group were higher by 35.99 (P<0.001), 39.05 (P<0.001), and 41.93 (P<0.001) at the early third trimester, late third trimester, and early postnatal period, respectively, compared to the control group. In addition, an increase in the self-efficacy score was noted from the late third trimester to the early postnatal period (2.89 points, P=0.034).
In the intervention group, there was a significant reduction in the severity of urinary incontinence across all time points compared to the control group, with an estimated mean difference change ranging between 0.44 and 2.54 (P<0.001). The severity of urinary incontinence in the control group was reversed, presenting an overall increase in the severity score, which was significant in the late third trimester (1.29 points, P=0.028) and early postnatal period (1.97 points, P<0.001) compared to baseline and 1.15 points (P=0.005) from the early third trimester, respectively. The odds of self-reporting of urinary incontinence in the intervention group did not differ significantly from that in the control group over time. However, in both groups, there was an increasing trend in self-reported urinary incontinence from baseline.
DISCUSSION
This PFME intervention has led to a significant increase in knowledge, attitude, practice, and self-efficacy, as well as a decrease in the severity of urinary incontinence among pregnant women. Specifically, the combination of educational sessions, message reminders, and one booster session in the first 8 weeks resulted in a drastic improvement in all primary outcomes at the first follow-up. After the subsequent two booster sessions, all primary outcome scores steadily increased, although not all findings met statistical significance. These results may be explained by the fact that more than half of the respondents dropped out during the booster sessions, which may have diluted the effect of the PFME intervention in the follow-up evaluation. The booster sessions, however, contributed to sustaining the initial effect and improving the primary outcomes.
The present study recorded a much higher rate of attrition, especially in the postnatal period, than was initially anticipated compared to previous studies [18-20]. This was a major challenge for the researcher to retain the respondents, while several strategies were adopted to minimize attrition. For example, to minimize the respondentŌĆÖs timing burden, the intervention sessions and collection of data were scheduled based on the womenŌĆÖs routine antenatal and postnatal clinical visits. However, some respondents transferred to a district or health clinic for antenatal care, especially if they were classified as low risk. The possibility of transferring antenatal or postnatal care to a different location could not be ruled out prior to the recruitment process. Budgetary constraints and resource limitations made it difficult to follow up in an alternative healthcare setting. Future studies must consider a different method of data collection using an electronic-based administered questionnaire to allow pregnant women who missed their regular antenatal or postnatal clinic visits to still be able to access and participate in the study.
Nonetheless, most respondents who did not return remain unknown, particularly in the postnatal period. This indicates that attrition is also likely to occur due to other unknown barriers, including the possibility that participation may be too arduous for working women or a lack of motivation and support from healthcare professionals other than the researcher, which were not assessed in the present study [18,19]. Those who were younger, nulliparous, and did not experienced urinary incontinence were lost to follow-up in this study, indicating that they may have seen less improvement or change in symptoms; therefore, they had less interest in continuing the intervention. It is crucial to inspire this group, as they are easily demotivated and may potentially drop out from the study [19].
In this study, the finding based on a modified intention-to-treat population that excluded respondents without follow-up measures was selected as the primary analysis to ensure that the study results reflected the respondentsŌĆÖ experiences with the PFME intervention. Missing data were believed to be a random occurrence, since most respondents did not follow up due to transition to another healthcare setting for antenatal care, or were randomly missing, since drop-out may depend on covariates such as age, continence status, and parity. Primary analysis and complete case analysis, based on both missingness assumptions, can yield unbiased results compared to intention-to-treat with multiple imputation, particularly when the probability of being a complete case does not depend on the outcome after taking covariates into account by including covariates in the regression model [21]. Indeed, even the intention-to-treat analysis had little effect on missingness, the sensitivity test results were generally consistent with the primary analysis results. Furthermore, the direction of the effect changed in favor of the intervention group in all methods of analysis compared to the control group, suggesting that the results are sufficiently robust to account for missingness.
Overall, the present study shows positive changes in the primary outcomes, which is consistent with previous findings [22]. The higher knowledge scores observed in the intervention group, despite indicating the effectiveness of the intervention, may also be useful in distinguishing the level of detail and specific knowledge gained by the respondents in the intervention group. The small increase in knowledge scores in the control group may be explained by the fact that the control group could have been exposed to other informative sources regarding PFME via the Internet, publications and magazines, or antenatal classes [5,23,24]. This result may reflect that the control group only had cursory knowledge from other resources as compared to the intervention group that received more detailed information concerning urinary incontinence and PFME.
While most respondents in both study groups had a high positive attitude towards PFME at baseline, following PFME intervention, their attitude improved significantly, which was consistent with the outcome of a previous pre-post study [22]. In line with this result, Hill et al. [5] also revealed that pregnant women who attended antenatal education classes had a positive attitude towards urinary incontinence and PFME compared to those who did not attend. This indicates that PFME intervention offers an opportunity to shift attitudes regarding PFME, even though they had a positive attitude or mindset before the intervention.
In both groups, the PFME practice improved over time, with significant improvement observed in the intervention group compared to that in the control group. In comparison with previous studies, the present study showed that the practice of PFME increased not only in frequency, but also in terms of the collective rating of the exercise prescription, including frequency, intensity, and functional coordination [18,22,25]. In contrast, Fritel et al. [20] found that pregnant women in both the supervised prenatal PFME training group and the control group who received written information on PFME performed PFME at the same level in terms of frequency, duration, and number of repetitions. While the increased trend in practice scores in the control group could be a result of knowledge gained through usual or routine antenatal education, most of the respondents were educated and were likely to be health-conscious and practice PFME.
The results of this study showed that providing adequate information and physical skills training is a successful way to boost confidence to correctly perform PFME [11,26]. Sangsawang and Serisathien [27] supported this finding, revealing that a supervised PFME program with training skills via verbal instruction and a handbook with comprehensive PFME guidance may be an efficient method for teaching correct PFME that not only builds confidence in the ability to perform it, but also effectively improves urinary incontinence. Regarding self-efficacy, the present study highlights that effective instruction along with measured self-efficacy may help to establish a habit of exercising the pelvic floor muscles that inevitably improve exercise mastery [28].
Interestingly, in the intervention group, the severity of urinary incontinence significantly decreased over time. In the control group, the severity score was reversed and consistent with the study of Sangsawang and Serisathien [27]. The ICIQ-UI-SF scores in the intervention group decreased between 2.10 and 2.54 points over time in the highest range, and this result was comparable with the study reported by Pelaez et al. [26]. Similarly, another study revealed that the severity of urinary incontinence was significantly lower, with a mean difference of 1.99 (P<0.01) in late pregnancy following a 6-week supervised PFME intervention; however, the severity of urine incontinence was assessed using a visual analogue scale of 1ŌĆō10 [29]; which could not be compared to the standard ICIQ-UI-SF minimal clinical difference of 4 points [30].
No significant difference was observed between groups in the self-reported urinary incontinence and gradually worsened, which may explain why the difference in clinical improvement in the severity of urinary incontinence was not achieved. Nonetheless, over-representation multiparous in the study sample may potentially explain the increasing risk of urinary incontinence throughout the pregnancy and the postnatal period, masking the effect of the PFME intervention. Another reason for insignificant changes in self-reported urinary incontinence could be that the sample size was inadequate to detect a difference between the groups [18,20].
The main strengths of this study include the study design (RCT) and the development of the intervention itself, which is considered quite unique, given that it was a theoretically derived intervention and was adapted to the local context together with the expert consensus. Also, the results of the present study represent real clinical data in a locally based tertiary hospital setting.
However, there are several inherent limitations. First, due to an increasing trend in attrition rate throughout the follow-up period from antenatal to postnatal, the analysis was limited to smaller samples, and imputation methods were used to maximize the data available for analysis. Although the results were similar based on primary and sensitivity analyses, the challenges associated with attrition must be addressed in future studies to increase the possibility of these programs being disseminated and resulting in clinically meaningful results, particularly related to urinary incontinence symptoms.
The second limitation was concealment, blinding, and contamination issues. While the block size was not revealed, a randomization sequence with a fixed block size could be predicted. At the same time, we could not rule out the possibility that blinding was not achieved for one or more respondents during the study, in which case those respondents may be subject to assessment bias. Steps were taken to minimize contamination; however, the possibility of contamination from information sharing could not be eliminated, especially when both study groups were recruited from a single center. Nevertheless, the respondents in the intervention groups were unlikely to be able to communicate the entire intervention program to others, since the PFME intervention consisted of components that are difficult to emulate, including education, skill, behavior change, and motivational techniques.
Another limitation is that the results of the present study may not represent the overall population of targeted pregnant women, as the respondents were only recruited from one hospital in Malaysia. Finally, limitations regarding self-reported questionnaires, especially related to practice and self-efficacy of PFME, may result in underreporting or overreporting.
In conclusion, the present study adds to the limited literature available on randomized trials that assess theory-based PFME intervention towards behavioral changes. Although the study suffered from a high lost-to-follow-up rate, the study acquired sufficient statistical power to detect the effectiveness of the PFME intervention in improving knowledge, attitude, practice, self-efficacy, and severity of urinary incontinence. Therefore, PFME is considered effective as an initial intervention in providing information about urinary incontinence prevention in pregnant women.