• KAFM
  • Contact us
  • E-Submission
ABOUT
ARTICLE CATEGORY
BROWSE ARTICLES
AUTHOR INFORMATION

Articles

Original Article

Cultural Adaption and Psychometric Analysis of Family APGAR Scale in Iranian Older People

Korean Journal of Family Medicine 2022;43(2):141-146.
Published online: March 17, 2022

1Faculty of Health, Qom University of Medical Sciences, Qom, Iran

2Spiritual Health Research Center, Qom University of Medical Sciences, Qom, Iran

3School of Paramedical Sciences, Qom University of Medical Sciences, Qom, Iran

*Corresponding Author: Zahra Taheri Kharame Tel: +98-253-3209123, Fax: +98-25-32858464, E-mail: ztaheri@muq.ac.ir
• Received: February 16, 2021   • Revised: May 9, 2021   • Accepted: May 10, 2021

Copyright © 2022 The Korean Academy of Family Medicine

This is an open-access article distributed under the terms of the Creative Commons Attribution Non-Commercial License (http://creativecommons.org/licenses/by-nc/4.0/) which permits unrestricted noncommercial use, distribution, and reproduction in any medium, provided the original work is properly cited.

  • 4,717 Views
  • 109 Download
  • 10 Web of Science
  • 12 Crossref
  • 11 Scopus
prev next
  • Background
    Family function is a necessary factor that influences older people’s health. The Family APGAR has been widely used to study family functions. However, there has been no Persian version of this instrument to assess family function in older people. The aim of this study was to determine the psychometric properties of the Persian version of the Family APGAR Scale to evaluate the perception of family functions.
  • Methods
    The “forward-backward” procedure was applied to translate the scale from English into Persian. The translated version was checked in terms of validity and reliability, with a sample of 281 older people selected from retirement centers. The factor structure of the scale was also tested using a confirmatory factor analysis. To test reliability, internal consistency and test–retest analyses were performed.
  • Results
    The results of the confirmatory factor analysis indicated a good structural model. Criterion-related validity was strongly supported by the pattern of association between the APGAR Scale and the social support survey. Cronbach’s α of the scale was 0.88 and test–retest reliability ranged from 0.96 to 0.98, indicating a good range of reliability.
  • Conclusion
    The findings of this study suggest that the Iranian version of the Family APGAR is a valid and reliable scale to evaluate family functions in health intervention programs.
In the recent decade, the proportion of older people worldwide has increased. According to the latest data from the World Health Organization, between 2015 and 2050, the proportion of the elderly is expected to increase from 12% to 22%, meaning there will be an increase from 900 million to 2 billion elderly people aged 60 years [1]. In Iran, the population over the age of 60 will reach approximately 10 million by 2020 and more than 26 million by 2050. According to these statistics, in the current situation, Iran is moving from a young population to a middle-aged population and will soon join the ranks of countries with an aging population [2].
Social support is one of the social determinants of health, which points to the importance of the social dimension of human beings and has been considered in recent years [3]. Accordingly, many studies indicate that establishing social relationships, particularly with family members, will have a significant impact on the mental health of the elderly [4]. In the elderly with less emotional and social support because of social isolation, it is likely to increase mental disorders, particularly depression, misbehavior, occurrence and exacerbation of chronic diseases, reduced quality of life and satisfaction, and inability and disability [5-7]. Family is considered to be primarily responsible for supporting the social and health needs of the elderly. Therefore, recognizing the dynamics of how the family system works is an important part of caring for the elderly. The systematic characteristics of the family refer to functional performance, family’s ability to coordinate or adapt to changes in life, conflict resolution, solidarity among members, success in disciplinary patterns, adherence to boundaries between members, and the implementation of rules and regulations [8]. To evaluate family performance, Smilkstein et al. [9] in 1982 developed a scale called Family APGAR, which stands for adaptation, which includes family resources when help is needed; partnership, which is associated with family communication and problem-solving; growth, which is the family’s access to role change and emotional growth; affection, which includes intimacy and emotional interactions (reciprocal emotional relationships) in the context of the family; and resolve, which is related to decision, determination, will, and effort in the family.
The Family APGAR Scale provides family performance appraisal independent of the family life and has been used in various studies [10-13]. This scale has been widely used in Brazilian public health services, particularly in family health strategy programs, and has been recognized by the Brazilian Ministry of Health as part of the primary care guidelines for assessing the performance of elderly families [14]. This scale is used to diagnose dysfunction in the family system and help perform interventions to balance family relationships.
Studies that provide psychometric analysis of measurement instruments is important, and their reliability and validation are essential for estimating the scientific quality of standardized tools. Because of social and cultural differences in different parts of the population and geographical areas, it is necessary to consider this point before using health-related tools; in other words, it is important to use stable and valid tools that include the desired concept [15]. Thus, only after confirming that a tool has satisfactory psychometric properties in a particular field of application can it be ensured that its use is appropriate. Evidence from the Family APGAR’s validity and reliability results for elderly people living in northeastern Brazil has reported that the use of such tool to assess the performance of elderly families in many cities in the region is appropriate [8].
Similarly, the translation and standardization of this scale has been studied by researchers in Brazil [8], Peru [14], Korea [16], and Taiwan [17]; and based on the results of most studies, this scale is a valid and reliable tool for performance analysis for families in different cultures. However, despite the efforts of researchers, a standard Persian version of this tool was not found. Given the importance of social support, particularly family support, in improving the quality of life of the elderly and the lack of appropriate tools to measure family performance in the elderly, this study was conducted to meet this aim.
1. Participants and Study Setting
This study was a descriptive psychometric type. The statistical population of this study included all retired older people in Retirement centers in Qom city, Iran. A total of 300 individuals participated in the study, which used multi-stage cluster sampling, and 281 individuals remained after completing the questionnaires. The inclusion criteria for the study were: at least aged 60 years, living at home, ability to speak Persian, and the absence of a diagnosed psychiatric disorder. The exclusion criterion for the study was incompletion of the questionnaires.
2. Translation and Adaptation
After obtaining permission from the developer, the scale was translated into Persian using the backward-forward method [18]. This method includes translating the original version into the target language by two expert bilingual translators and combining the two versions, measuring the quality of the translation (in terms of clarity, common language usage, conceptual equivalence, and overall quality of the translation) and translating the target version into the original language by two translators. The two versions of the scale (original language and back-translated versions) were then compared for concept equivalence and were approved for final English version by the developer of scale. Subsequently, five psychologists and geriatricians confirmed the validity of the content and cultural compatibility of the scale. To examine the formal validity, the questionnaire was then given to 10 older people who had the criteria to participant in the study, and they were asked to express their opinions about the content, clarity, legibility, simplicity, ease of completing the questionnaire, and ease of comprehension.
3. Instruments
The following instruments were used. The Family APGAR Scale, developed by Smilkstein et al. [9] in 1982, identifies family functions. This scale is an acronym for adaptation, partnership, growth, affection, and resolve. The participants determine their level of disagreement or agreement with each of statement on a 5-point Likert scale, ranging from 1 (never) to 5 (always). All scores were added to obtain the overall score. A high score indicated that the subject enjoyed favorable support from the family [9].
The social support survey is a self-report scale with 19 phrases and five subscales, which include emotional, informational, tangible, affectionate, and positive social interactions [19]. In this scale, the subject determines the degree of disagreement or agreement with each of the statements on a 5-point Likert scale (1=never, 5=always). To obtain the score for each subscore, scores related to the desired scale were added together. All scores were added to obtain the overall score. A high score indicated that the subject had good social support. The validity and reliability of the main scale [19] and the Persian version [20] have been reported to be desirable.
The checklist of demographic information was related to individual characteristics, including age, gender, chronic illness, and marital status.
4. Ethical Considerations
The approval to conduct the study was obtained from the Medical Ethics Committee of Qom University of Medical Sciences (registration no., IR.MUQ.REC.1399.033). For data collection, the study was explained to eligible participants. Informed consent was obtained from the participants before they complete the questionnaire at retirement centers. The purpose of the study and how it was done for the participants were explained.
5. Data Analysis
Smart partial least square (PLS) software ver. 3.0 (SmartPLS GmbH, Oststeinbek, Germany) was used for the data analysis. Descriptive statistics were used to analyze the data. The confirmatory factor analysis method was used to determine the construct validity. In this section, the convergent and divergent validity of the scale were examined. In PLS, factor loads, average extraction variance (AVE), and composite reliability were used to measure convergence validity. For convergent validity, all factor loads must be above 0.6 and significant. The AVE is greater than 0.5, and the composite reliability is greater than the AVE. Divergent validity was measured using the Fornell and Larcker criterion [21], where the squared root of the average variance of each construct should be greater than the correlations from other constructs. In addition, criterion-related validity was performed to demonstrate the extent to which the Family APGAR Scale correlates with scores derived from the social support survey. It was expected that the Family APGAR would positively correlate with this measure. A Pearson correlation coefficient of 0.40 or above was considered satisfactory.
Internal consistency and stability were used to measure the reliability. Cronbach’s α coefficient was used to measure internal consistency. Cronbach’s α was acceptable at >0.7. Scale stability was also assessed using the test–retest method. Twenty-five participants completed the questionnaire in two stages, with a time interval of 2 weeks, and the scores obtained in these two stages were then compared using the intracluster correlation coefficient (ICC). If this index is greater than 0.80, the stability rate is desirable [22].
The goodness-of-fit (GoF) criterion was used to evaluate the fit of the general model. GoF index is the geometric mean of the average communality and average R2 for all endogenous constructs (GoF=Communalities×R2). This index is between 0 and 1, and 0.01, 0.25, and 0.36 values were considered small, medium, and large, respectively [23]. Statistical analyses in this study were performed using Smart-PLS ver. 3.2.7 software package (SmartPLS GmbH).
The average age of the participants was 65.49 years (standard deviation=5.53). The majority of the participants were men (75.8%), and most of them were illiterate and had an elementary education level (61.9%). In addition, 87.9% of the participants were married, 91.6% were home owners, and 88% lived with a wife and/or children. Table 1 presents further information on the characteristics of the participants.
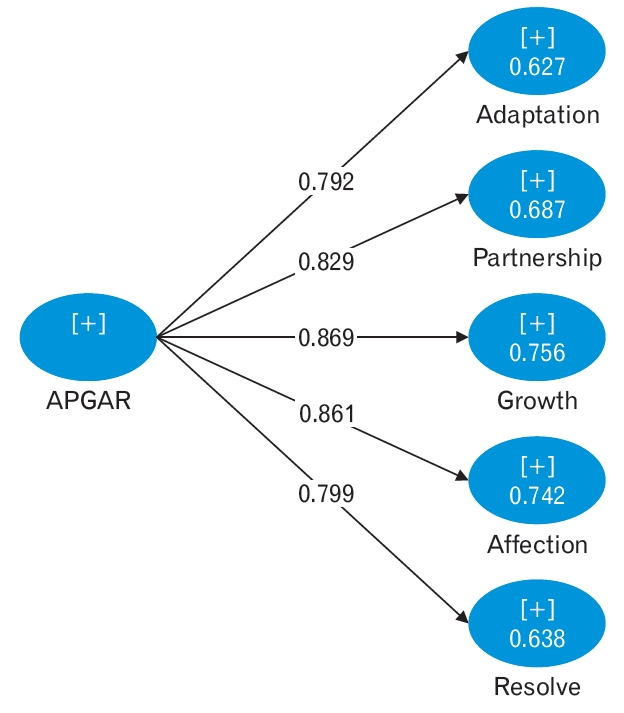
According to the results in Table 2, Cronbach’s α coefficients, composite reliability, and AVE were appropriate. The factor loads of the scale in all items were significant and higher than 0.6 (Figure 1).
The results in Table 3 show that the squared root of the average variance exerted by all variables is greater than the correlation value of that variable with other variables. Therefore, the validity of this scale was confirmed.
Criterion-related validity was examined by performing a correlation between the Persian version of the Family APGAR Scale and the social support survey. As expected, a significant positive correlation was observed. The results are presented in Table 4.
The internal consistency of the Family APGAR Scale, as assessed by Cronbach’s α coefficient, showed satisfactory results. Cronbach’s α coefficient for the total scale was 0.887. For the test–retest reliability, the ICC coefficients ranged between 0.96 and 0.98 (P<0.001). The reliability results for the scale are presented in Table 5.
The GoF index of the study model was 0.69, indicating that the scale had a good fit.
To understand how family functions with older people, the use of Family APGAR tools to facilitate health care is a key component of successful intervention health planning, particularly in primary care. The present study was conducted to translate and study the psychometric characteristics of the Family APGAR in Iranian older people.
In this study, confirmatory factor analysis was used to investigate the validity of the construct validity scale. The results confirm the model of factor analysis and indicate its suitability. A study of da Silva et al. [8] in 2014 of construct validity was investigated using exploratory factor analysis, which showed the one-dimensional nature of the Brazilian version of the scale.
To establish the criterion-related validity of the scale, the Family APGAR and social support survey were administered to the participants. There was a significant positive correlation between the social support survey and its subscales, which was consistent with other studies [11,24].
Moreover, the present study showed that the scale had relatively good internal consistency (Cronbach’s α=0.887). The results of a study by da Silva et al. [8] showed a Cronbach’s α of 0.80. Cronbach’s α varied between 0.73 and 0.78 when one item was removed.
The reliability of the scale was also examined using the test–retest analyses, which showed that the results obtained from the two tests at a 2-week interval showed a high stability of the scale.
This study has limitations. First, this study may have led participants to distort their responses to social validation because of the use of self-reporting tools. Another limitation may be that the sample used in this study was unique to Qom city and was available from the sampling method. Therefore, precautions should be taken in generalizing the results.
Overall, the findings of this study suggest that the Family APGAR is desirable in terms of psychometric properties. This tool can be used to measure health outcomes in research and treatment. The application of this scale is easily possible and can be completed by the elderly or health-care providers in less than 10 m.

CONFLICT OF INTEREST

No potential conflict of interest relevant to this article was reported.

FUNDING

This study was financially supported by the University of Medical Sciences.

The researchers express their gratitude from participants in this study as well as the deputy of research, Qom University of Medical Sciences to fund and support this project.
Figure. 1.
Factor loads of the APGAR Scale in all items. Values are standardized regression weights for items in the APGAR scale.
kjfm-21-0028f1.jpg
Table 1.
Demographic characteristics of the study sample (n=300)
Characteristic No. (%)*
Age (y)
 60–64 173 (61.6)
 65–69 62 (22.1)
 ≥70 46 (16.4)
Gender
 Male 213 (75.8)
 Female 68 (24.2)
Marital status
 Married 247 (87.9)
 Widow or divorced 34 (12.1)
Educational level
 Illiterate 83 (29.5)
 Primary school (grades 1–6) 91 (32.4)
 Secondary school (grades 7–9) 12 (4.3)
 High school (grades 10–12) 37 (13.2)
 University 56 (19.9)
Income level
 Poor 205 (73.0)
 Good 70 (24.9)
Body mass index (kg/m2)
 Under weight (<18.5) 31 (11.0)
 Normal weight (18.5–24.9) 185 (65.8)
 Overweight (≥25.0) 55 (19.6)
Medical history
 Heart disease 69 (23.0)
 Hypertension 96 (32.0)
 Diabetes 66 (22.0)
 Others 62 (20.7)

*Percentages may not total 100% because of missing values.

Table 2.
Convergent validity of the Family APGAR Scale
Variable Cronbach’s α Composite reliability AVE
APGAR Scale 0.887 0.917 0.690

AVE, average variance extracted.

Table 3.
Divergent validity of the Family APGAR Scale
Subscale Adaptation Affection Growth Partnership Resolve
Adaptation 1.000
Affection 0.566 1.000
Growth 0.642 0.693 1.000
Partnership 0.617 0.623 0.646 1.000
Resolve 0.480 0.679 0.612 0.555 1.000
Table 4.
Correlation between the social support survey and Family APGAR Scale
Subscale Emotional Tangible Informational Positive social interaction Affectionate
Adaptation 0.478** 0.411** 0.522** 0.353** 0.528**
Partnership 0.456** 0.297** 0.486** 0.319** 0.455**
Growth 0.378** 0.387** 0.443** 0.331** 0.407**
Affection 0.536** 0.358** 0.535** 0.362** 0.527**
Resolve 0.423** 0.338** 0.503** 0.351** 0.478**
APGAR Scale 0.545** 0.427** 0.595** 0.407** 0.572**

**P<0.01 (Correlation is significant at the 0.01 level).

Table 5.
Reliability of the Family APGAR Scale
Subscale Cronbach’s α (If item is deleted) ICC P-value
Adaptation 0.873 0.97 0.001
Partnership 0.878 0.98 0.001
Growth 0.864 0.96 0.001
Affection 0.868 0.97 0.001
Resolve 0.881 0.96 0.001
APGAR Scale 0.887 0.96 0.001

ICC, intracluster correlation coefficient.

  • 1. World Health Organization. World report on ageing and health. Geneva: World Health Organization; 2015.
  • 2. Motih Haghshenas N. Sociological aspects of aging populations and active aging challenges in Iran. Iran J Soc Stud 2011;1:133-47.
  • 3. Richmond CA. The social determinants of Inuit health: a focus on social support in the Canadian Arctic. Int J Circumpolar Health 2009;68:471-87.
  • 4. Cadenas-Salazar R, Villarreal-Rios E, Vargas-Daza ER, Martinez-Gonzalez L, Galicia-Rodriguez L. Relationship between functional social support and vital satisfaction in the elderly. Rev Med Inst Mex Seguro Soc 2009;47:311-4.
  • 5. Chokkanathan S. Stressors social support and elder mistreatment. Aging Ment Health 2017;21:125-32.
  • 6. Cha KS, Lee HS. The effects of ego-resilience, social support, and depression on suicidal ideation among the elderly in South Korea. J Women Aging 2018;30:444-59.
  • 7. Kelly ME, Duff H, Kelly S, McHugh Power JE, Brennan S, et al. The impact of social activities, social networks, social support and social relationships on the cognitive functioning of healthy older adults: a systematic review. Syst Rev 2017;6:259.
  • 8. da Silva MJ, Victor JF, Mota FR, Soares ES, Leite BM, Oliveira ET. Analysis of psychometric properties of Family APGAR with elderly in northeast Brazil. Esc Anna Nery 2014;18:527-32.
  • 9. Smilkstein G, Ashworth C, Montano D. Validity and reliability of the Family APGAR as a test of family function. J Fam Pract 1982;15:303-11.
  • 10. Wang MW, Huang YY. Evaluating family function in caring for a geriatric group: Family APGAR applied for older adults by home care nurses. Geriatr Gerontol Int 2016;16:716-21.
  • 11. Takenaka H, Ban N. The most important question in family approach: the potential of the resolve item of the Family APGAR in family medicine. Asia Pac Fam Med 2016;15:3.
  • 12. Preechawong S, Zauszniewski JA, Heinzer MM, Musil CM, Kercsmar C, Aswinanonh R. Relationships of family functioning, self-esteem, and resourceful coping of Thai adolescents with asthma. Issues Ment Health Nurs 2007;28:21-36.
  • 13. dos Santos AA, Pavarini SC. Family functionality regarding the elderly with cognitive impairments: the caretaker’s perception. Rev Esc Enferm USP 2012;46:1141-7.
  • 14. Castilla H, Caycho T, Shimabukuro M, Valdivia A. Perception of family functioning: psychometric analysis of Family APGAR Scale in adolescents in Lima. J Educ Psychol Propos Represent 2014;2:65-78.
  • 15. Pashandi S, Khaghanizade M, Ebadi A. Review of translation and cultural adaptation process of questionnaires. Educ Strateg Med Sci 2009;2:117-20.
  • 16. Kang SK, Young BB, Lee HR, Lee DB, Shim UT. A study of Family APGAR scores for evaluating family function. Fam Phys [Internet] 1984 [cited 2021 Feb 10];5:6-13. Available from: https://www.kjfm.or.kr/upload/pdf/0051202.pdf
  • 17. Tsai SY, Sun WJ. Evaluating the satisfaction of immigrant women from a rural community regarding family functioning and health-related quality of life. Women Health 2013;53:135-53.
  • 18. Aaronson NK, Acquadro C, Alonso J, Apolone G, Bucquet D, Bullinger M, et al. International Quality of Life Assessment (IQOLA) project. Qual Life Res 1992;1:349-51.
  • 19. Sherbourne CD, Stewart AL. The MOS social support survey. Soc Sci Med 1991;32:705-14.
  • 20. Mohammadzadeh J, Sayehmiri K, Mahmoudi B. Standardization of social support scale (MOS) of adults who have chronic diseases in Ilam, 2015. J Ilam Univ Med Sci 2016;23:69-77.
  • 21. Chin WW. How to write up and report PLS analyses. In: Esposito Vinzi V, Chin WW, Henseler J, Wang H, editors. Handbook of partial least squares. Berlin: Springer; 2010. p. 655-90.
  • 22. Nunnally JC, Bernstein IH, Berge JM. Psychometric theory. New York (NY): McGraw-Hill; 1967.
  • 23. Tenenhaus M, Amato S, Esposito Vinzi VE. A global goodness-of-fit index for PLS structural equation modelling. Proceedings of the XLII SIS Scientific Meeting; 2004 Jun 9-11; Bari, Italy. Rome: Italian Statistical Society; 2004. p. 739-42.
  • 24. Sprusinska E. The Family APGAR Index: study on relationship between family function, social support, global stress and mental health perception in women. Int J Occup Med Environ Health 1994;7:23-32.

Figure & Data

References

    Citations

    Citations to this article as recorded by  
    • Advance care planning readiness among older adults in aged service centers: A cross-sectional study
      Kalok Wong, Haobin Yuan, Stephen Tee, Sinkei Cheong
      International Journal of Nursing Sciences.2025; 12(1): 59.     CrossRef
    • Psychosocial distress in people with overweight and obesity: the role of weight stigma and social support
      Vladimira Timkova, Pavol Mikula, Iveta Nagyova
      Frontiers in Psychology.2025;[Epub]     CrossRef
    • ‘Let the System Do Its Job and Families Handle the Rest’? Protective and Risk Factors Contributing to Pandemic Crisis Parental Burnout
      Roman Ryszard Szałachowski, Wioletta Tuszyńska-Bogucka, Jacek Bogucki
      Journal of Clinical Medicine.2025; 14(2): 617.     CrossRef
    • Homogeneity, dimensionality, convergent and nomological validity of the family APGAR among primary care users in Bucaramanga, Colombia
      Julián Andrés Jaimes-Grimaldos, Carlos Arturo Cassiani-Miranda, Andrés Felipe Tirado-Otálvaro, German Díaz Buitrago, Adalberto Campo-Arias, Sandra Milena Velásquez-Vergara, Andrea Carolina Duran-Bedoya
      Journal of Family Social Work.2025; 28(2): 72.     CrossRef
    • Risk factors and a nomogram for predicting cognitive frailty in Chinese patients with lung cancer receiving drug therapy: A single‐center cross‐sectional study
      Jinping Li, Yan Wang, Minfeng Zhai, Mengyuan Qin, Dandi Zhao, Qian Xiang, Zaoyuan Shao, Panrong Wang, Yan Lin, Yiting Dong, Yan Liu
      Thoracic Cancer.2024; 15(11): 884.     CrossRef
    • Psychometric adequacy of the persian adapted version of the tilburg frailty indicator (P-TFI)
      Maryam Safarnavadeh, Leili Salehi
      BMC Geriatrics.2024;[Epub]     CrossRef
    • Risk Factors Associated with Suicidal Ideation in Students of the Faculty of Medicine and Surgery, URSE
      Iván Antonio García-Montalvo, Diana Matías-Pérez, Silvia Lois López-Castellanos, Enrique López-Ramírez, Moisés Martínez-López
      Psychiatry International.2024; 5(3): 544.     CrossRef
    • Relación de la capacidad funcional y la funcionalidad familiar con la fragilidad en adultos mayores con riesgo cardiovascular en el suroccidente colombiano
      Clara Inés Paz , Betsy Mercedes Ledezma , Diana María Rivera, Mabel Lorena Salazar , María Verónica Torres , Franklin René Patiño, Andry Yasmid Mera-Mamián
      Biomédica.2024; 44(4): 537.     CrossRef
    • Analysis of the Functioning of Families of Children with Autism Spectrum Disorder: A Psychometric Study of the Family APGAR Scale
      Laura Serrano, Esther Vela, Laura Martín
      International Journal of Environmental Research and Public Health.2023; 20(23): 7106.     CrossRef
    • The family dynamics of children on the streets of Ibadan, Southwest Nigeria
      Abimbola M. Obimakinde, Moosa Shabir
      South African Family Practice.2023;[Epub]     CrossRef
    • Nomogram reliability for predicting potential risk in postgraduate medical students with anxiety symptoms
      Zewen Huang, Lejun Zhang, Junyu Wang, Tingting Wang, Lu Xu, Xialing Yang, Heli Lu
      Heliyon.2022; 8(10): e10803.     CrossRef
    • Riesgo familiar total y funcionalidad familiar en hogares de una agrupación familiar de San Juan de Lurigancho, 2021.
      Rocio Miriam Bravo Rojas, Cecilia Olga Martinez Ramos
      Revista Cuidado y Salud Pública.2022; 2(1): 22.     CrossRef

    Download Citation

    Download a citation file in RIS format that can be imported by all major citation management software, including EndNote, ProCite, RefWorks, and Reference Manager.

    Format:

    Include:

    Cultural Adaption and Psychometric Analysis of Family APGAR Scale in Iranian Older People
    Korean J Fam Med. 2022;43(2):141-146.   Published online March 17, 2022
    Download Citation
    Download a citation file in RIS format that can be imported by all major citation management software, including EndNote, ProCite, RefWorks, and Reference Manager.

    Format:
    • RIS — For EndNote, ProCite, RefWorks, and most other reference management software
    • BibTeX — For JabRef, BibDesk, and other BibTeX-specific software
    Include:
    • Citation for the content below
    Cultural Adaption and Psychometric Analysis of Family APGAR Scale in Iranian Older People
    Korean J Fam Med. 2022;43(2):141-146.   Published online March 17, 2022
    Close

    Figure

    • 0
    Cultural Adaption and Psychometric Analysis of Family APGAR Scale in Iranian Older People
    Image
    Figure. 1. Factor loads of the APGAR Scale in all items. Values are standardized regression weights for items in the APGAR scale.
    Cultural Adaption and Psychometric Analysis of Family APGAR Scale in Iranian Older People
    Characteristic No. (%)*
    Age (y)
     60–64 173 (61.6)
     65–69 62 (22.1)
     ≥70 46 (16.4)
    Gender
     Male 213 (75.8)
     Female 68 (24.2)
    Marital status
     Married 247 (87.9)
     Widow or divorced 34 (12.1)
    Educational level
     Illiterate 83 (29.5)
     Primary school (grades 1–6) 91 (32.4)
     Secondary school (grades 7–9) 12 (4.3)
     High school (grades 10–12) 37 (13.2)
     University 56 (19.9)
    Income level
     Poor 205 (73.0)
     Good 70 (24.9)
    Body mass index (kg/m2)
     Under weight (<18.5) 31 (11.0)
     Normal weight (18.5–24.9) 185 (65.8)
     Overweight (≥25.0) 55 (19.6)
    Medical history
     Heart disease 69 (23.0)
     Hypertension 96 (32.0)
     Diabetes 66 (22.0)
     Others 62 (20.7)
    Variable Cronbach’s α Composite reliability AVE
    APGAR Scale 0.887 0.917 0.690
    Subscale Adaptation Affection Growth Partnership Resolve
    Adaptation 1.000
    Affection 0.566 1.000
    Growth 0.642 0.693 1.000
    Partnership 0.617 0.623 0.646 1.000
    Resolve 0.480 0.679 0.612 0.555 1.000
    Subscale Emotional Tangible Informational Positive social interaction Affectionate
    Adaptation 0.478** 0.411** 0.522** 0.353** 0.528**
    Partnership 0.456** 0.297** 0.486** 0.319** 0.455**
    Growth 0.378** 0.387** 0.443** 0.331** 0.407**
    Affection 0.536** 0.358** 0.535** 0.362** 0.527**
    Resolve 0.423** 0.338** 0.503** 0.351** 0.478**
    APGAR Scale 0.545** 0.427** 0.595** 0.407** 0.572**
    Subscale Cronbach’s α (If item is deleted) ICC P-value
    Adaptation 0.873 0.97 0.001
    Partnership 0.878 0.98 0.001
    Growth 0.864 0.96 0.001
    Affection 0.868 0.97 0.001
    Resolve 0.881 0.96 0.001
    APGAR Scale 0.887 0.96 0.001
    Table 1. Demographic characteristics of the study sample (n=300)

    Percentages may not total 100% because of missing values.

    Table 2. Convergent validity of the Family APGAR Scale

    AVE, average variance extracted.

    Table 3. Divergent validity of the Family APGAR Scale

    Table 4. Correlation between the social support survey and Family APGAR Scale

    P<0.01 (Correlation is significant at the 0.01 level).

    Table 5. Reliability of the Family APGAR Scale

    ICC, intracluster correlation coefficient.

    TOP