INTRODUCTION
Hypertension, a significant risk factor for cardiovascular disease, is associated with high morbidity and mortality rates. Its proper management is crucial for prolonging the lifespan and maintaining a good quality of life. Globally, 113 million individuals had hypertension in 2015. As of 2021, approximately 28% of people aged 20 or older in Korea had been diagnosed with hypertension [1,2]. Research conducted by the Korean Medical Insurance Corporation suggested that hypertension increases the risk of developing cardiovascular disease and mortality by 2.6-fold [3,4]. Chronic conditions such as hypertension are difficult to cure, so continuous medication management is often necessary in conjunction with lifestyle modifications. Therefore, medication adherence is considered a criterion for treatment success [5,6].
Medication adherence refers to taking the medication the doctor prescribes at the correct dosage and administration method [4]. According to domestic research, hypertensive patients with versus without high medication adherence rates have better blood pressure control [7]. On the other hand, medication non-adherence is common in patients with chronic diseases. According to domestic research, only 47.7%–57.4% of patients with hypertension adhere to their prescribed medication therapy [8].
Usual source of care (USC) refers to the healthcare provider or facility that the patients regularly visit for medical help [9]. Studies have shown that individuals with a USC tend to have higher satisfaction with healthcare services. They establish ongoing relationships with their healthcare providers, which can lead to reduced hospitalization rates and overall healthcare costs. A USC also decreases unmet healthcare needs and positively influences medication adherence [8,10-13]. In Korea, there are no regulations mandating the possession of a USC. As of 2016, the ownership rate was relatively low at 32.5% (29.1% for males, 35.8% for females) [14].
The Korean healthcare system is weak in terms of primary care orientation. Despite the National Health Insurance System, private medical institutions dominate the landscape, comprising over 90% of all healthcare facilities. Patients can seek medical care at any institution, from private clinics to university hospitals, without restrictions. They can also access specialists directly without requiring a referral from a regular doctor [15]. As a result, the proportion of individuals with a USC or regular doctor is lower in Korea than in Western countries like the Netherlands and the United Kingdom [12].
This study analyzed the medication adherence rate for each item and overall medication adherence rate according to USC type among patients with hypertension using data from the Korea Health Panel Survey. Previous studies in Korea reported that patients with chronic diseases with versus without a USC tend to have higher medication adherence rates. Therefore, this study evaluated the medication adherence more specifically than in previous studies by considering medication adherence in different stages of the medication process and focusing on patients with hypertension. In addition, this study divided USC types into three groups—those without a USC (no USC), those with a USC but no regular doctor (place only), and those with a USC and a regular doctor (regular doctor)—and analyzed the data by combining these categories.
METHODS
1. Data Source and Subject of Analysis
This study utilized the data from the 2nd Korea Health Panel Survey 2020 (version 2.1) jointly organized by the Korea Institute for Health and Social Affairs and the National Health Insurance Service. The Korea Health Panel Survey aims to produce individual- and householdlevel statistics on various factors, such as disease, medical utilization, medication adherence, healthcare expenditure and its sources, healthrelated perception, and behavior, as basic information for policy-making to enhance the responsiveness, accessibility, and efficiency of healthcare services. The survey aims to identify the related factors to inform policy decisions. The Korea Health Panel Survey is a longitudinal survey that has been collecting data annually since 2008. The first panel was concluded in 2018. The second panel was established in 2019 for continued annual surveys. The second panel was constructed using a two-stage stratified cluster sampling method based on the 2016 population census data. A self-administered supplemental questionnaire targeting adult household members aged 19 years and older included questions on the presence of a USC and its type.
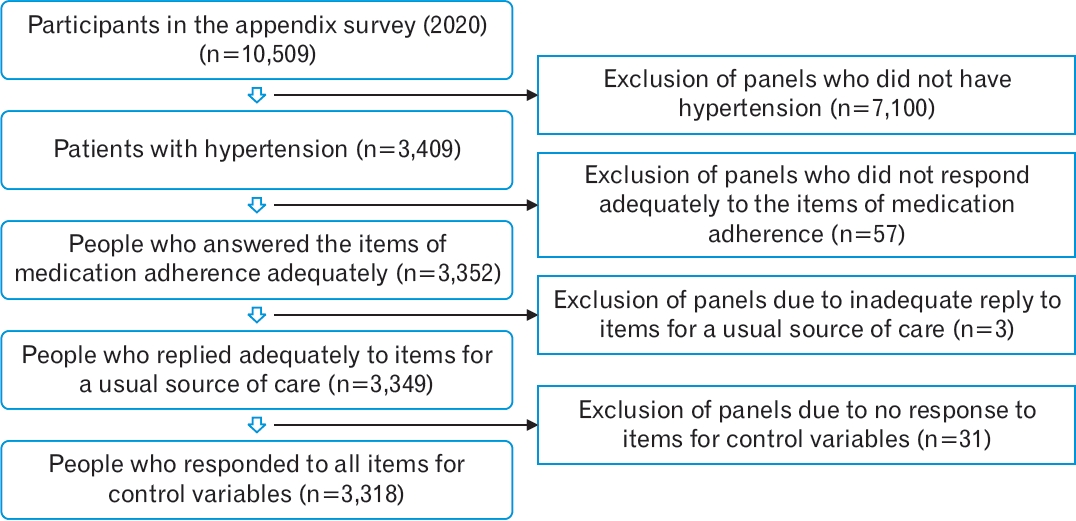
Of the original sample data in 2020, 10,509 responses were received for the supplementary questionnaire. Among them, 3,409 individuals were identified as having hypertension based on the Korean Standard Classification of Diseases version 6. The analysis was conducted of 3,352 individuals after excluding 57 individuals who did not respond to the medication adherence questions (dose, frequency, time, and discontinuation) or answered that they did not know the dosage. Three individuals who did not respond appropriately to the medical institution type questions and 31 individuals for whom items were missing for control variables were also excluded as control variables. Therefore, the final analysis included the data for 3,318 individuals (Figure 1).
This study was approved by the Institutional Review Board of Dongguk University Ilsan Hospital (no., SMC 2023-01-025; examination exemption approval). The requirement for informed consent from individual patients was waived because this retrospective study used publicly available data.
2. Outcome Variable
The outcome variable of this study was medication adherence. The medication adherence survey was conducted of patients prescribed medication for hypertension or diabetes. The first question of the medication adherence survey was about the medication dose, and the specific content was “Have you taken your medication (used) by following the dose (number of pills taken at once) well for the past year?” The answer choices were: (1) always, (2) mostly, (3) rarely, (4) never, and (5) do not know the exact dosage per use. The question format and answer choices for medication frequency (e.g., 3 times a day, once a day) and medication time (e.g., before meals, after meals, before bedtime) were the same as the medication dose. The specific question regarding medication discontinuation was, “Have you ever discontinued your prescribed medication without consulting your doctor in the past year?” The answer choices were: (1) yes and (2) no.
For the question regarding dose, frequency, and time, the responses of “do not know the exact dose, frequency, and time” were treated as missing values. Regarding medication adherence for each item, a response of “always” for the dose, frequency, and time items was considered perfect medication adherence, while a response of “mostly,” “rarely,” or “never” was classified as medication non-adherence. High medication adherence for each item was defined as a response of “always” or “mostly” for the dose, frequency, and time items, while a response of “rarely” or “never” was classified as non-adherence. In cases in which the medication was discontinued, those with no discontinuation were classified as having perfect medication adherence, whereas those with discontinuation were classified as being non-adherent. In overall medication adherence, perfect medication adherence was defined as a response of “always” for the dose, frequency, and time items, with no discontinuation of medication. High overall medication adherence was defined as a response of “always” or “mostly” for the dose, frequency, and time items with no medication discontinuation.
3. Variables of Interest
USC types were categorized into three groups based on the responses to the additional questionnaire regarding the presence of a USC and the presence of a regular doctor. The questions asked were: “Do you have a medical institution (regular place) that you usually visit when you want to receive medical treatment or advice?” and “Do you have a regular doctor that you usually visit when you want to receive medical treatment or advice?” Individuals who answered “no” to both questions were classified as the no USC group. Those who indicated having a USC but no regular doctor was classified as the place only group. Those who reported having a USC and a regular doctor were categorized as the regular doctor group. The respondents who answered that they did not have a USC but had a regular doctor were treated as having missing values because of the small number of respondents in this category and the unclear meaning of their responses.
4. Control Variable
In this analysis, sex was categorized as male or female. Age was divided into two groups: 19–64 years; and ≥65 years. Education was classified into three groups: ≤6 years, 7–12 years, and ≥13 years. Household income was divided into four quartiles based on the total annual household income divided by the square root of the number of household members. Marital status was categorized into two groups: currently married; and other (including currently divorced, separated, widowed, or never married). Regarding health insurance, government officials, teachers, employees, and community-based coverage receive the same benefits, so they were grouped as a single category for the analysis. The other category included individuals who receive additional benefits, such as medical assistance, and cases in which individuals are not enrolled in health insurance and do not receive any benefits, although these cases are rare. The other category was also combined into a single category for analysis purposes. For private insurance, the participants were categorized as enrolled or not. The subjective health status was assessed using a 5-point Likert scale, and individuals who reported “very poor” or “poor” were classified as the poor group. In contrast, those who reported “good” or “very good” were classified as the good group. Individuals who reported “fair” were classified as the fair group. The annual outpatient visits were divided into four quartiles: 1–12 visits, 13– 20 visits, 21–32 visits, and ≥33 visits.
In the survey, the presence or absence of 30 representative chronic diseases and the time of diagnosis were investigated separately. Additional questions were asked to determine the presence or absence of other chronic diseases. The number of chronic diseases, excluding hypertension, was categorized into quartiles (0, 1, 2, and 3+). The specific type and number of chronic diseases were unknown in cases in which other chronic diseases were present. Therefore, they were not considered in the adjustment for chronic diseases.
5. Analysis Method
For the outcome variable of medication adherence, specifically overall perfect medication adherence, the sample sizes and percentages were provided for subgroups defined by the types of USC, general characteristics, socioeconomic factors, and health-related control variables. Chi-square tests were performed to assess the associations.
Finally, a logistic regression analysis was conducted to calculate the adjusted odds ratios (OR) of USC type and medication adherence while controlling for covariates. This study analyzed perfect medication adherence for each item, overall perfect medication adherence, high medication adherence for each item, and overall high medication adherence. Statistical analysis was performed using Stata/SE ver. 16.1 (Stata Corp., College Station, TX, USA), and a significance level of P<0.05 was used to determine statistical significance.
RESULTS
Among the patients with hypertension, the percentage of perfect medication adherence was higher in the regular doctor group (72.8%) than in the no USC group (60.6%) and the place only group (59.1%) (Table 1). The perfect medication adherence rate was higher in the older age groups (≥65 years, 68.4%) than in the younger age groups (19–64 years, 62.4%). Among different income quartiles, the perfect medication adherence rate was higher in the lowest (69.7%) and highest (68.2%) quartiles than in the second (66.5%) or third (62.0%) quartiles. The perfect medication adherence rate was higher among those without private insurance (68.6%) than in those with private insurance (65.2%). There were no significant differences in the perfect medication adherence rates in terms of sex, education level, current marital status, health insurance type, presence of disability, or self-rated health status (Table 1).
After the adjustment for general characteristics, socioeconomic factors, and health-related factors, the OR for overall perfect medication adherence was 1.70 (95% confidence interval [CI], 1.42–2.03) in the regular doctor group, indicating a significantly higher likelihood of perfect medication adherence than in the no USC group. In the place only group, however, the OR was 0.94 (95% CI, 0.77–1.16), suggesting no significant difference in perfect medication adherence compared to the reference group (Table 2). The OR for overall perfect medication adherence was significantly higher in the following subgroups: individuals aged ≥65 years (OR 1.27 compared to those aged 19–64 years), those with self-rated good health status (OR 1.37 compared to those with a self-rated poor health status), and those with a higher number of annual outpatient visits (13–20 visits and ≥33 visits compared to those with 1–12 visits).
The OR for perfect medication adherence for each item, including dose, frequency, time, and no discontinuation, was significantly higher in the regular doctor versus no USC group (2.14, 1.87, 1.72, and 1.56 versus no USC group). On the other hand, there were no significant differences in the place only group except in dose (Table 3). The OR for high medication adherence overall and for each item (frequency, time) was significantly higher in the regular doctor group (1.59, 2.47, and 2.30 versus no USC group). In the place only group, however, no significant differences were observed in the OR for high medication adherence overall and for each item (except for issues with the overall model fit for dose) (Table 4).
DISCUSSION
Compared to the no USC group, the regular doctor group showed a significantly higher OR for an overall perfect/high medication adherence (1.70; 95% CI, 1.42–2.03)/(1.59; 95% CI, 1.14–2.22) as well as perfect/high medication adherence for each item (dose [2.14; 95% CI, 1.73–2.63], frequency [1.87; 95% CI, 1.53–2.28], time [1.72; 95% CI, 1.43–2.07], no stop [1.56; 95% CI, 1.09–2.23]/frequency [2.47; 95% CI, 1.21–5.01], and time [2.30; 95% CI, 1.19–4.44]). On the other hand, no significant differences were observed in the place only group except for perfect medication adherence for dose (1.35; 95% CI, 1.06–1.71).
According to the Jung and Byeon [8] analysis of the 2012 1st Korea Health Panel Survey data, the regular doctor group showed a significantly lower medication non-adherence rate than the no USC group (OR, 0.67). Similarly, the study by Shin [10] of the 2017 1st Korea Health Panel Survey data found that the regular doctor group exhibited a significantly higher medication adherence rate than the no USC group (OR, 1.8) [11]. These findings are consistent with the present study of 2nd Korea Health Panel Survey data. In the study by Jung and Byeon [8], however, the medication non-adherence rate was significantly lower in the place only than no USC group (OR, 0.61). Similarly, Shin [10] reported a significantly higher medication adherence rate in the place only versus no USC group. In contrast, this study found no significant differences in medication adherence rate in the place only group except for the dose category. The study by Jung and Byeon [8] included all chronic diseases as the target population and considered medication non-adherence even in cases in which the prescription medication was not dispensed. The authors analyzed the presence or absence of a regular doctor and the presence or absence of a USC as separate factors. On the other hand, Shin [10] specifically targeted elderly individuals aged ≥65 years among the entire population of chronic disease patients.
Compared to previous studies, this study utilized more recent data from 2020, allowing more robust conclusions. This study also specifically focused on patients with hypertension, a chronic condition that requires consistent medication adherence for its management. This targeted approach enabled an examination of the impact of medication adherence without the confounding effects of other chronic diseases. Unlike previous studies that categorized medication adherence based on a single question with two response options, this study employed 2nd Korea Health Panel Survey data and analyzed adherence using four detailed items. This comprehensive approach allowed an assessment of medication adherence both overall and for each item. Furthermore, the regular doctor group had a higher medication adherence rate than the no USC group according to a 4-point Likert scale to differentiate between perfect adherence and high adherence.
Compared to the no USC group, a significant difference in medication adherence rates among RD group but no difference in the place only group, might be partly due to longitudinality issue. The concept of longitudinality refers to the long-term personal relationship between a doctor and a patient within the primary care context. According to Starfield [16], longitudinality offers several benefits, including improved recognition of patient problems and needs by the physician, more accurate diagnoses, higher patient acceptance of medical advice, a reduced likelihood of hospitalization, lower healthcare costs, and increased patient satisfaction compared to cases in which only healthcare facilities are available [16].
A study by Kerse et al. [17] in New Zealand (2004) also yielded significant results, showing higher medication adherence rates when there was a greater concordance between patients and physicians (OR, 1.3). In this context, concordance referred to the extent to which physicians understood their patients, recognized their problems and needs, and agreed with their treatment decisions. These findings align with the benefits of longitudinality mentioned by Starfield [16]. Chang et al. [18] in 2010–2017 analyzed data from the Medical Expenditure Panel Survey and reported that the quality of the physician–patient relationship positively influenced patient adherence to antihypertensive medication regimens. The study evaluated the physician–patient relationship in terms of effective communication and shared decision-making [18].
Kim and Sung [19] examined the 2018 1st Korea Health Panel data and reported that patient-centered communication was significantly better in the regular doctor versus no USC group. On the other hand, no significant difference was observed in the place only group [19]. This suggests that when physicians are involved, patient-centered communication is more effectively established and the trust between physicians and patients is higher than in cases in which physicians are not involved [20]. The absence of significant differences in medication adherence rates among individuals in the place only group and the significantly higher medication adherence observed in the regular doctor group in the present study are informed by the findings of these studies.
While this study had the advantage of using a probability sampling method to include a representative population sample, it also had some limitations. First, it was difficult to establish precise causal relationships and provide conclusive information about causality because of its cross-sectional nature. Second, the reliance on self-reported data from participants may introduce discrepancies between reported medication adherence and actual adherence behaviors. Various methods can be used to assess medication adherence, such as directly measuring substances or their metabolites in blood or urine samples to determine the drug half-life and confirm adherence. Alternatively, adherence can be assessed indirectly through questionnaires, interviews, the counting of remaining pills, or calculating prescription renewal dates. While the previously mentioned direct methods have the advantage of objectively measuring adherence, they may not capture specific details, such as the dose, frequency, time, or missed doses, as effectively because they do not involve daily monitoring by healthcare professionals. In contrast, the questionnaire-based approach used in the present study has the advantage of evaluating adherence more comprehensively, including dose, frequency, time, and missed doses [21]. Third, recall bias is possible as the responses rely on patients’ memory. On the other hand, there is no clear reason to believe that individuals with regular physicians would systematically provide higher adherence responses than the no USC group, so it is unlikely to significantly alter the overall conclusion. As more data become available over time, future research can explore changes in medication adherence over time and conduct analyses based on different institutions or specialties.
Previous studies reported several benefits of having a regular doctor. This current study confirmed that medication adherence is improved in hypertensive patients with a regular doctor. These findings support the need for healthcare policies that encourage having a regular doctor in Korea, which has a healthcare system with limited primary care. Despite the presence of national health insurance, the weak primary care system in South Korea highlights the importance of promoting having a regular doctor considering its positive impact on medication adherence in hypertensive patients.