This is an open-access article distributed under the terms of the Creative Commons Attribution Non-Commercial License (http://creativecommons.org/licenses/by-nc/4.0/) which permits unrestricted noncommercial use, distribution, and reproduction in any medium, provided the original work is properly cited.
Since the World Health Organization’s pandemic declaration in March 2020, Korea has witnessed shifts in lifestyle behaviors, impacting habits tied to socioeconomic status and contributing to metabolic syndrome (MetS). To investigate this issue, the current study aimed to investigate changes in MetS prevalence, particularly based on income levels before and after the coronavirus disease 2019 (COVID-19) pandemic.
Methods
This study used data from the 8th Korea National Health and Nutrition Examination Survey (2019–2020). A total of 6,840 individuals aged 30–65 years were included in this study. Household income was divided into high (≥75th percentile), middle (25–75th percentile), and low (≤25th percentile). A multivariable logistic regression analysis was performed to explore the interaction between this association before and after the COVID-19 pandemic.
Results
A statistically significant difference was found in the prevalence of MetS before and after the COVID-19 pandemic (26.7% to 30.2%, P=0.001). These changes differed based on income levels. The increase in the prevalence of MetS was statistically significant in the low- and high-income groups but not in the middle-income group (low: 8.0%p increase [P=0.039], middle: 1.0%p increase [P=0.522], high: 6.4%p increase [P<0.001]). The interaction between household income and the COVID-19 pandemic on MetS was statistically significant (P for interaction=0.032).
Conclusion
This study revealed that P for interaction between household income, MetS, and the period before and after the COVID-19 pandemic was significant. Changes in physical activity and eating habits during the COVID-19 pandemic may have contributed to these differences.
In March 2020, the World Health Organization declared a global coronavirus disease 2019 (COVID-19) pandemic [1], leading to restrictions on daily activities at the national and regional levels. Consequently, individuals spent more time at home, leading to changes in lifestyle habits such as reduced physical activity and decreased consumption of meals prepared at home [2].
Data from the Korea National Health and Nutrition Examination Survey (KNHANES) revealed an increased prevalence of obesity, hypertension, hypercholesterolemia, and heavy drinking after the COVID-19 pandemic, particularly among men and those in their 30s and 40s. This pattern of increased components of the metabolic syndrome (MetS) was more pronounced in the low-income group [3]. Among several measures of socioeconomic status (SES), income levels are the most representative indicator of individual SES. Moreover, a French cross-sectional study reported that high income levels were associated with a lower prevalence of MetS [4]. Furthermore, previous studies have linked SES (monthly income and education levels) to the prevalence of MetS among Korean adults [5]. These studies revealed that higher SES is associated with healthier behaviors, resulting in a reduced prevalence of MetS. Additionally, these studies indicated that variations in healthy behaviors based on SES can contribute to the prevalence of MetS. This is because MetS is influenced by healthy behaviors such as regular exercise, good dietary habits, and abstaining from alcohol consumption and smoking [6].
The COVID-19 pandemic has affected individual health status and lifestyle behaviors [7]. Restrictions on external activities have forced individuals to reduce their physical activity, resulting in worsening mental health [8,9]. A recent study proved changes in the prevalence of MetS in Korean adults after the COVID-19 pandemic [10]. However, no previous studies have investigated changes in the prevalence of MetS during the COVID-19 pandemic based on household income. Therefore, this study investigated the relationship between household income levels and changes in the prevalence of MetS in Korean adults before and after the COVID-19 pandemic.
Methods
Study population
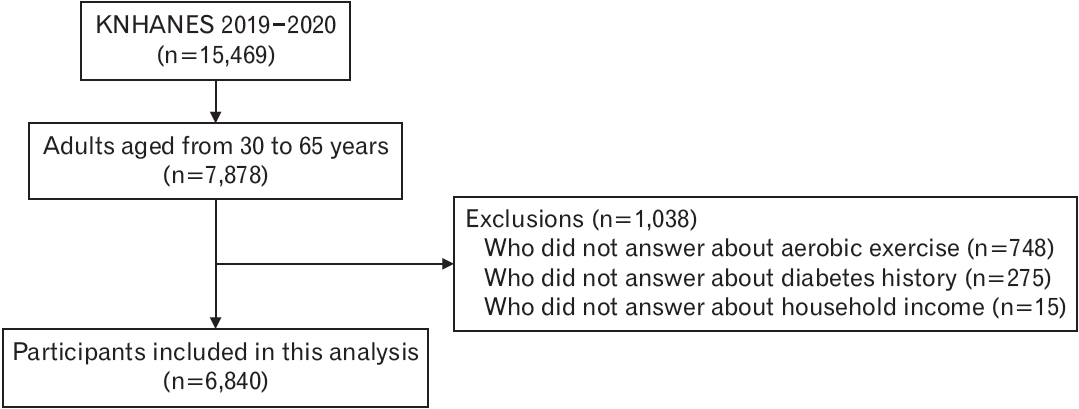
To compare the prevalence of MetS before and after the COVID-19 pandemic, we used data from the 8th KNHANES for the duration 2019–2020. The KNHANES is a government-designated statistical investigation of the health behaviors of the national population, prevalence of chronic diseases, and status of food and nutrition intake in Korea. In total, 6,840 individuals (2,978 men and 3,862 women aged 30–65 years) were included in this study, after excluding those without information on aerobic exercise (n=748), diabetes history (n=275), or household income (n=15) (Figure 1). The study population included individuals aged 30–65 years, as individuals in this age range are highly productive in the workforce and have a higher likelihood of exposure to factors contributing to MetS. Therefore, this study included adults aged 30 years and older who had a relatively active social life and excluded those aged above 65 years who had an inactive social life because of retirement. This study was approved by the Institutional Review Board (IRB) of the Samsung Medical Center (IRB approval no., 2023-03-084) and informed consent was obtained from all individual participants included in the study.
Measurement
Socioeconomic status
SES was measured using the following three categories: household income, education level, and marital status. Information concerning monthly household income was obtained from the questionnaire, and household income was divided into three groups: high (≥75th percentile), middle (25–75th percentile), and low (≤25th percentile), similar to that used in previous studies [4,11]. Education levels were classified based on graduation status: below middle school graduation, high school graduation, and above college graduation. Marital status was categorized based on cohabitation with a spouse.
Clinical and laboratory data
Body measurement data included weight, body mass index (BMI), waist circumference, systolic blood pressure (SBP), and diastolic blood pressure (DBP). Weight was measured in 0.1-kg units using a mobile scale. Blood pressure was measured with participants in a sitting position after stabilizing for 5 minutes using a mercury blood pressure meter until 2019 and then using a non-silver blood pressure meter in 2020. Laboratory results obtained from venous blood samples after at least an 8-hour fasting state included fasting blood glucose, triglyceride, and high-density lipoprotein (HDL) cholesterol levels. The collected blood samples were centrifuged, mixed, and refrigerated.
Medical history and health-related behavior
Health questionnaire data on drinking, smoking, and physical activity were used to identify health behaviors. Current smokers were defined as those who smoke now, and current drinkers were defined as those who had ≥2 drinks per week in the past year. Regarding physical activity, participants’ responses were categorized based on whether they engaged in aerobic physical exercises. Aerobic activity adherence refers to performing moderate-intensity physical activity for ≥150 minutes per week or performing high-intensity physical activity for ≥75 minutes per week.
Definition of metabolic syndrome
MetS was defined according to the Modified National Cholesterol Education Program Adult Treatment Panel III criteria. MetS was diagnosed when ≥3 of the following five criteria were met: (1) waist circumference ≥90 cm for men or ≥85 cm for women (following Korean-specific cutoffs for abdominal obesity defined by the Korean Society of Obesity); (2) triglyceride levels ≥150 mg/dL or use of drugs to reduce triglycerides; (3) HDL cholesterol levels <40 mg/dL for men or <50 mg/dL for women; (4) SBP ≥130 mm Hg, DBP ≥85 mm Hg, or taking antihypertensive medications; and (5) fasting blood glucose levels ≥100 mg/dL or taking anti-diabetic medications.
Statistical analysis
Continuous variables are expressed as mean±standard error, and categorical variables are expressed as numbers and percentages. Among general characteristics, physical measurements, MetS components, and related factors, continuous variables were subjected to Student ttest and nominal variables were subjected to chi-square test to investigate differences. Multivariate logistic regression analysis was performed to estimate the odds ratios (ORs) and 95% confidence intervals (CIs) for MetS with adjustments for sex, age, SES, and healthy behaviors (smoking, alcohol use, and aerobic physical activity). To demonstrate the potential interactions between household income levels and the COVID-19 pandemic on the prevalence of MetS, we used interaction terms in logistic regression models and performed stratified analyses for each year. Statistical analyses were performed using PASW SPSS ver. 18.0 (SPSS Inc., Chicago, IL, USA).
Results
General characteristics of the study population before versus after COVID-19 pandemic
The general characteristics of the 8th KNHANES participants from 2019 to 2020 are presented in Table 1. This study included 6,840 adults (3,606 in 2019 and 3,234 in 2020). The average age changed from 48.6± 10.0 years to 49.3±10.1 years after the COVID-19 pandemic (P=0.003). Body weight increased significantly from 65.5±12.6 kg in 2019 to 66.4±13.2 kg in 2020 after the COVID-19 pandemic (P=0.007). BMI also displayed a statistically significant increase from 24.0±3.5 kg/m2 in 2019 to 24.3±3.7 kg/m2 in 2020 (P=0.001). The prevalence of diabetes mellitus increased significantly from 11.2% in 2019 to 14.1% in 2020 (P=0.001), and the prevalence of hypertension increased significantly from 25.1% in 2019 to 27.7% in 2020 (P=0.032).
Furthermore, the prevalence of MetS significantly increased from 26.7% in 2019 to 30.2% (+3.5%p) in 2020 (P=0.001). The components of MetS, including fasting blood glucose and triglyceride levels, waist circumference, and HDL cholesterol levels, displayed statistically significant changes. Comparing the percentage changes of each MetS component according to the criteria, the proportion of individuals with fasting blood glucose ≥100 mg/dL or using diabetes medication increased significantly from 37.4% to 39.8% (P=0.046). The proportion of individuals with serum triglyceride levels ≥150 mg/dL or using medication for dyslipidemia increased from 38.2% to 41.5% (P=0.006), and the proportion of individuals with waist circumference ≥90 cm for men and ≥85 cm for women increased from 17.6% to 20.8% (P=0.001). Finally, the proportion of individuals with HDL cholesterol levels <40 mg/dL for men and <50 mg/dL for women significantly increased from 29.2% to 32.3% (P=0.005).
Comparison of MetS prevalence before versus after the COVID-19 pandemic by household income
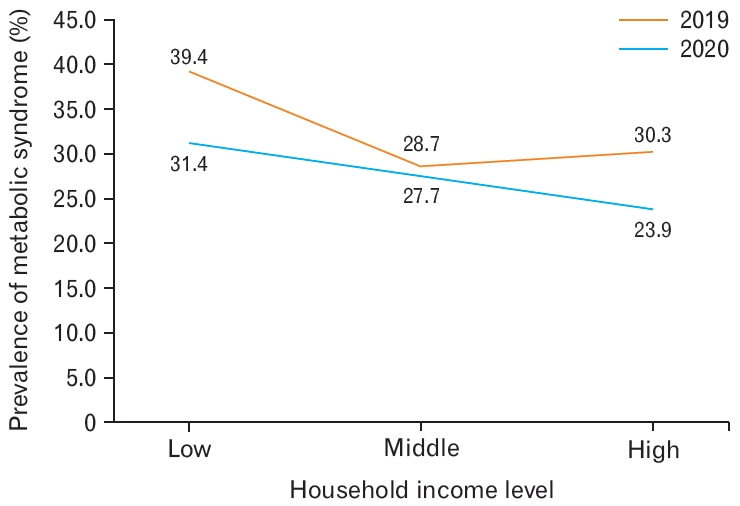
Based on an analysis stratified by income levels comparing before and after the COVID-19 pandemic, among the total of 6,840 participants in 2019 and 2020, there were 607 individuals (8.9%) in the low-income group, 3,698 (54.1%) in the middle-income group, and 2,535 (37.1%) in the high-income group. In the low-income group, body weight significantly increased from 63.5±12.1 to 66.2±13.8 kg (P=0.011). The highincome group also revealed an increase from 65.5±12.5 to 66.6±13.2 kg (Table 2). The increase in prevalence of MetS was significant in the low- and high-income groups, whereas no significant change was observed in the middle-income group before and after the COVID-19 pandemic (low: 8.0%p increase [P=0.039], middle: 1.0%p increase [P=0.522], high: 6.4%p increase [P<0.001]) (Figure 2).
Interaction between household income levels and year on MetS prevalence
As presented in Table 3, a significant interaction was observed between the prevalence of MetS based on household income and the COVID-19 pandemic (P for interaction=0.032). In 2019, the prevalence of MetS was higher in the middle-income group than in the high-income group (high versus middle; OR, 1.22; 95% CI, 1.04–1.43; P=0.016); however, in 2020, no significant OR in the middle-income group was observed compared to that in the high-income group (high versus middle; OR, 0.92; 95% CI, 0.79–1.08; P=0.328). We presented the results of the interaction between year, household income, and MetS according to sex (Supplement 1). Events such as the COVID-19 pandemic, which occurred between 2019 and 2020, may have had differential effects on the prevalence of MetS between males and females.
Discussion
A significant difference was observed in the prevalence of MetS before and after the COVID-19 pandemic (26.7% to 30.2%, P=0.001). This change was particularly different when income levels were considered. The increase in the prevalence of MetS was statistically significant in the low- and high-income groups but not in the middle-income group (low: 8.0%p increase [P=0.039], middle: 1.0%p increase [P=0.522], high: 6.4%p increase [P<0.001]). The interaction between MetS and household income and the COVID-19 pandemic was statistically significant (P for interaction=0.032).
Our study found that the prevalence of MetS significantly increased during the COVID-19 pandemic. During the COVID-19 pandemic, there were constraints on outdoor activities, restrictions on the utilization of indoor sports facilities, and a shift towards remote learning and home office setups [7]. According to the Korea Disease Control and Prevention Agency, the prevalence of obesity, hypertension, hypercholesterolemia, and high-risk drinking among men increased after the COVID-19 pandemic. In particular, the increase in these conditions was more pronounced in men in their 30s and 40s and in the low-income group [3].
After the onset of the COVID-19 pandemic, changes in the prevalence of MetS in low-income groups can be attributed to several factors, including decreased occupational physical activity and increased depressive symptoms. Employment crises tend to have a more significant impact on low-income groups than on other income groups (Supplement 2) [12,13]. This may force a decline in occupational physical activity, contributing to the development of MetS. Yildiz et al. [14] reported that unemployed individuals are more likely to develop chronic diseases than employed individuals because unemployed individuals are more susceptible to psychological disorders and inflammatory conditions.
Additionally, decreased physical activity due to lockdowns, restrictions, and unemployment can contribute to mental health problems, such as depressive symptoms, particularly in the low-income group. Previous research revealed that the prevalence of depression was 1.64 times higher in the low-income group compared to that in the high-income group (P<0.001) [15]. Moreover, another study indicated that a worsening of mental health caused by COVID-19 was more pronounced in low-SES groups [16]. Depressive symptoms such as stress and anxiety may lead to unhealthy coping behaviors, such as overeating, consuming comfort foods, or avoiding exercise, all of which can contribute to the MetS [17]. Many studies have revealed a significant relationship between depressive symptoms and MetS [18,19]. The present study also found an increase in alcohol consumption in the low-income group (6.8%p increase, P=0.090) (Table 2).
Changes in the prevalence of MetS in the high-income group may have been influenced by decreased daily physical activity and changes in dietary habits. Table 2 indicates that the highest reduction in aerobic physical activity prevalence was observed in the high-income group (2.0%p decrease, P=0.313). During the 2020 COVID-19 pandemic, social distancing policies prompted the shutdown of swimming pools and other exercise facilities. This could have led to a decrease in physical activity among individuals in the high-income group who could previously afford to invest in health-related activities. The increase in home office-based work may also have contributed to this trend. According to data from the Korean Statistical Office, home office-based work increased from 10.8% in 2019 to 14.2% in 2020 [20], with the highest increase observed in office/administration jobs (16% to 41%) after COVID-19 [21]. Therefore, home office-based work was inferred to be more prevalent in the high-income group (Supplement 2). In the study “The impact of COVID-19 on life and emotions due to remote work,” higher income levels were associated with higher rates of home office-based work [22]. Various studies have already demonstrated that increased home office-based work leads to a decrease in physical activity [23,24]. Additionally, a study conducted on adults in South Korea during the COVID-19 pandemic revealed that higher SES was associated with reduced physical activity after the COVID-19 pandemic [25]. A study titled “Korea Rural Economic Institute analyzing changes in dietary habits after COVID-19” found that the high-income group experienced the largest decrease in the rate of healthy eating habits (2.1%p decrease) [26]. The increase in consumption of high-calorie delivery food could also be a contributing factor. According to the findings of previous studies, the proportion of delivery food consumption increased during the COVID-19 pandemic [27,28]. Furthermore, many studies have indicated that high income levels are associated with greater consumption of delivery food [29,30]. The increase in consumption of high-carbohydrate and high-fat foods through eating out and delivery could have contributed to the higher prevalence of MetS in the high-income group. This trend was also reflected in changes in nutrient intake after COVID-19, with an increase in fat consumption [26].
The reason for the lowest degree of change in the prevalence of MetS after COVID-19 in the middle-income group could be attributed to minimal changes in daily life, including dietary habits. The middle-income group was the only group that showed an increase in the rate of healthy eating habits [26], and may have been less affected by home office and employment interruptions (Supplement 2).
This study has several limitations. First, owing to its cross-sectional design, the findings cannot definitively establish a causal relationship. Second, after the COVID-19 pandemic, Korea implemented an active response policy starting on February 23, 2020. Given that the KNHANES data were consistently collected from January to December 2020, the periodic effects of social isolation may have varied among the participants. Finally, because the KNHANES data for 2020 were gathered shortly after the start of the COVID-19 pandemic, we could not definitively confirm whether the prevalence of MetS was attributed to the impact of the COVID-19 pandemic. However, to the best of our knowledge, this study is the first to examine changes in the prevalence of MetS based on income levels among Koreans during the COVID-19 pandemic.
In conclusion, this study reveals that the prevalence of MetS differed significantly by income level before versus after the COVID-19 pandemic. Thus, when developing healthcare policies against infectious diseases, such as the COVID-19 pandemic, health practitioners should be aware that income levels could play an important role in changes in metabolic status.
Article Information
Conflict of interest
Su-Min Jeong serves as an associate editor of the Korean Journal of Family Medicine, but has no role in the decision to publish this article. Except for that, no potential conflict of interest relevant to this article was reported.
Funding
None.
Data availability
Not applicable.
Author contribution
Conceptualization: HK, SMJ. Data curation: HK, SMJ. Formal analysis: HK, SMJ, JP. Investigation: HK, DL. Methodology: HK, SMJ. Software: HK. Validation: HK, SMJ. Visualization: HK, JP. Project administration: HK, SMJ. Writing–original draft: HK. Writing–review & editing: HK, SMJ, JP, DL. Final approval of the manuscript: HK, SMJ
Flowchart of the study participants. KNHANES, Korea National Health and Nutrition Examination Survey.
Figure. 2.
Association between the prevalence of metabolic syndrome and household income before and after coronavirus disease 2019.
Table 1.
Comparison before and after the COVID-19 lockdown in individuals aged 30–65 years (n=6,840)
Characteristic
COVID-19
P-value
Before (2019) (n=3,606)
After (2020) (n=3,234)
Age (y)
48.6±0.17
49.3±0.18
0.003
Male sex
1,557 (43.2)
1,421 (43.9)
0.526
Married, living together
2,948 (81.8)
2,507 (77.5)
<0.001
Income level
0.879
High
1,328 (36.8)
1,207 (37.3)
Middle
1,960 (54.4)
1,738 (53.7)
Low
318 (8.8)
289 (8.9)
Education status
0.933
Middle school or less
564 (15.6)
516 (16.0)
High school
1,272 (35.3)
1,142 (35.3)
College or more
1,768 (49.1)
1,576 (48.7)
Alcohol, current
1,262 (35.0)
1,177 (36.4)
0.228
Smoking, current
671 (18.6)
601 (18.6)
0.980
Aerobic exercise
1,588 (44.0)
1,382 (42.7)
0.277
Medical history
Diabetes mellitus
404 (11.2)
455 (14.1)
0.001
Hypertension
904 (25.1)
889 (27.7)
0.032
Dyslipidemia
870 (24.1)
841 (26.0)
0.073
Weight (kg)
65.5±0.21
66.4±0.23
0.007
Body mass index (kg/m2)
24.0±0.06
24.3±0.06
0.001
WC (cm)
83.7±0.17
84.5±0.18
0.001
Systolic blood pressure (mm Hg)
117.3±0.25
117.5±0.27
0.638
Diastolic blood pressure (mm Hg)
77.3±0.16
77.6±0.17
0.123
FBS (mg/dL)
100.9±0.37
101.8±0.39
0.075
TG (mg/dL)
137.0±1.81
139.6±2.11
0.341
HDL (mg/dL)
53.5±0.22
51.9±0.22
<0.001
Metabolic syndrome
961 (26.7)
978 (30.2)
0.001
Elevated blood pressure or treatment
1,326 (36.8)
1,235 (38.5)
0.157
Elevated FBS or treatment
1,349 (37.4)
1,286 (39.8)
0.046
Elevated TG or treatment
1,379 (38.2)
1,343 (41.5)
0.006
Low HDL
1,053 (29.2)
1,046 (32.3)
0.005
Elevated WC
634 (17.6)
673 (20.8)
0.001
Values are presented as mean±standard error for continuous variables or number (%) for categorical variables. Log substitution was performed with non-normal distribution.
P-values are from a t-test for continuous variables and chi-square test for categorical variables, respectively.
Comparison before and after the COVID-19 lockdown in individuals aged 30–65 years according to household income (n=6,840)
Variable
Low (n=607)
P-value
Middle (n=3,698)
P-value
High (n=2,535)
P-value
Before (2019) (n=318)
After (2020) (n=289)
Before (2019) (n=1,960)
After (2020) (n=1,738)
Before (2019) (n=1,328)
After (2020) (n=1,207)
Age (y)
52.8±0.55
52.5±0.61
0.727
48.3±0.23
49.4±0.24
0.001
48.2±0.26
48.6±0.28
0.268
Male sex
117 (36.8)
130 (45.0)
0.040
832 (42.4)
729 (41.9)
0.757
608 (45.8)
562 (46.6)
0.695
Married, living together
164 (51.6)
128 (44.3)
0.351
1,626 (83.0)
1,371 (78.9)
0.034
1,158 (87.2)
1,008 (83.5)
0.065
Educational status
0.110
0.951
0.660
Middle school or less
120 (37.9)
112 (38.8)
349 (17.8)
312 (18.0)
95 (7.2)
92 (7.6)
High school
132 (41.6)
100 (34.6)
741 (37.8)
664 (38.2)
399 (30.0)
378 (31.3)
College or more
65 (20.5)
77 (26.6)
869 (44.4)
762 (43.8)
834 (62.8)
737 (61.1)
Alcohol, current
114 (35.8)
123 (42.6)
0.090
708 (36.1)
656 (37.7)
0.308
440 (33.1)
398 (33.0)
0.933
Smoking, current
83 (26.1)
77 (26.6)
0.879
384 (19.6)
323 (18.6)
0.437
204 (15.4)
201 (16.7)
0.375
Aerobic exercise
121 (38.1)
108 (37.4)
0.863
843 (43.0)
731 (42.1)
0.560
624 (47.0)
543 (45.0)
0.313
Medical history
Diabetes mellitus
55 (17.3)
66 (22.8)
0.179
223 (11.4)
238 (13.7)
0.086
126 (9.5)
151 (12.5)
0.029
Hypertension
118 (37.2)
104 (36.2)
0.948
481 (24.6)
480 (27.8)
0.063
305 (23.1)
305 (25.5)
0.242
Dyslipidemia
100 (31.4)
84 (29.1)
0.524
462 (23.6)
448 (25.8)
0.120
308 (23.2)
309 (25.6)
0.158
Weight (kg)
63.5±0.68
66.2±0.81
0.011
65.8±0.29
66.2±0.32
0.400
65.5±0.34
66.6±0.38
0.030
Body mass index (kg/m2)
24.0±0.21
24.7±0.23
0.031
24.2±0.08
24.4±0.09
0.059
23.8±0.09
24.1±0.10
0.017
WC (cm)
84.2±0.58
86.4±0.67
0.016
84.0±0.23
84.5±0.24
0.097
83.2±0.27
84.1±0.30
0.040
Systolic blood pressure (mm Hg)
120.5±0.95
119.7±0.91
0.585
117.7±0.34
118.0±0.37
0.562
116.0±0.40
116.2±0.44
0.697
Diastolic blood pressure (mm Hg)
77.9±0.58
77.7±0.58
0.888
77.3±0.21
77.7±0.24
0.234
77.1±0.26
77.5±0.28
0.236
FBS (mg/dL)
105.9±1.70
107.3±1.93
0.589
100.8±0.51
101.4±0.52
0.399
99.8±0.53
101.2±0.57
0.082
TG (mg/dL)
147.1±7.18
168.8±13.0
0.136
136.9±2.39
133.7±2.33
0.331
134.7±2.97
141.3±3.30
0.138
HDL (mg/dL)
53.0±0.71
49.4±0.74
<0.001
53.2±0.29
52.2±0.30
0.012
54.0±0.36
52.1±0.36
<0.001
Metabolic syndrome
100 (31.4)
114 (39.4)
0.039
543 (27.7)
498 (28.7)
0.522
318 (23.9)
366 (30.3)
<0.001
Elevated blood pressure
151 (47.5)
144 (50.2)
0.509
731 (37.3)
647 (37.5)
0.924
444 (33.5)
444 (37.2)
0.058
Elevated FBS
135 (42.5)
132 (45.7)
0.424
730 (37.2)
676 (38.9)
0.302
484 (36.4)
478 (39.6)
0.102
Elevated TG
151 (47.5)
146 (50.5)
0.455
757 (38.6)
701 (40.3)
0.288
471 (35.5)
496 (41.1)
0.004
Low HDL
113 (35.5)
113 (39.1)
0.364
595 (30.4)
565 (32.5)
0.159
345 (26.0)
368 (30.5)
0.012
Elevated WC
43 (13.5)
59 (20.4)
0.023
346 (17.7)
338 (19.4)
0.161
245 (18.4)
276 (22.9)
0.006
Values are presented as mean±standard error for continuous variables or number (%) for categorical variables. Log substitution was performed with non-normal distribution. P-values are from a t-test for continuous variables and chisquare test for categorical variables, respectively.
ORs for metabolic syndrome according to income levels
Income level
2019
2020
P for interaction
OR (95% CI)
P-value
OR (95% CI)
P-value
Household income
0.032
Low
1.46 (1.11–1.91)
0.006
1.50 (1.15–1.95)
0.003
Moderate
1.22 (1.04–1.43)
0.016
0.92 (0.79–1.08)
0.328
High
1.00 (Reference)
1.00 (Reference)
Adjusted household income
0.032
Low
1.11 (0.82–1.50)
0.487
1.13 (0.84–1.53)
0.427
Moderate
1.16 (0.98–1.39)
0.092
0.88 (0.74–1.05)
0.154
High
1.00 (Reference)
1.00 (Reference)
Adjusted for sex, age (year, continuous), education levels (less than middle school education, high school education, more than college education), smoking (non-smoker, current smoker), current alcohol (more than twice a week), and aerobic exercise. Calculated using logistic regression analysis.
2. Chew HS, Lopez V. Global impact of COVID-19 on weight and weightrelated behaviors in the adult population: a scoping review. Int J Environ Res Public Health 2021;18:1876.
3. Kim YJ, Park SY, Oh KW. Changes in health behavior and chronic diseases after the COVID-19 epidemic [Internet]. Korea Disease Control and Prevention Agency; 2021 [cited 2023 Aug 1]. Available from: https://knhanes.kdca.go.kr/knhanes/sub04/sub04_04_02.do
4. Dallongeville J, Cottel D, Ferrieres J, Arveiler D, Bingham A, Ruidavets JB, et al. Household income is associated with the risk of metabolic syndrome in a sex-specific manner. Diabetes Care 2005;28:409-15.
5. Han BS, Park JC, Youn KW, Kwak JS, Kim WS. Associations between socioeconomic status, healthy behaviors, and metabolic syndrome in Koreans: about 2012 national health and nutrition examination survey participants. Korean J Fam Pract 2015;5:51-7.
6. Woolf SH, Jonas S, Kaplan-Liss E. Health promotion and disease prevention in clinical practice. 2nd ed. Lippincott Williams & Wilkins; 2008.
7. Mun H, So ES. Changes in physical activity, healthy diet, and sleeping time during the COVID-19 pandemic in South Korea. Nutrients 2022;14:960.
8. Shin JY, Lee J, Lee JM, Ho NY. Factors affecting decreased physical activity during the COVID-19 pandemic: an age-, gender-, and body mass index-matched study. Front Public Health 2023;11:1170049.
9. Puccinelli PJ, da Costa TS, Seffrin A, de Lira CA, Vancini RL, Nikolaidis PT, et al. Reduced level of physical activity during COVID-19 pandemic is associated with depression and anxiety levels: an internet-based survey. BMC Public Health 2021;21:425.
11. Ahn SH, Son SM, Kim HK. A study on the health and nutritional characteristics according to household income and obesity in Korean adults aged over 50: based on 2005 KNHANES. Korean J Community Nutr 2012;17:463-78.
12. Korea Economic Research Institute. The impact of COVID-19 on the job retention rate for vulnerable people in 2020 [Internet]. Korea Economic Research Institute; 2022 [cited 2023 Aug 1]. Available from: http://keri.org/web/www/home
13. Altig D, Baker S, Barrero JM, Bloom N, Bunn P, Chen S, et al. Economic uncertainty before and during the COVID-19 pandemic. J Public Econ 2020;191:104274.
14. Yildiz B, Schuring M, Knoef MG, Burdorf A. Chronic diseases and multimorbidity among unemployed and employed persons in the Netherlands: a register-based cross-sectional study. BMJ Open 2020;10:e035037.
15. Ryu DH, Kim HR, Lee CW, Lee J, Jeong Yj, Kim HS. Factors associated with depressive symptoms among Korean adults during the COVID-19: based on the 2019-2020 Korea welfare panel study. Korean J Fam Pract 2022;12:354-60.
16. Lee R. Factors related to COVID-19 anxiety and stress: focusing on demographic characteristics and neighborhood satisfaction. J Korea Contents Assoc 2021;21:71-80.
17. Knell G, Robertson MC, Dooley EE, Burford K, Mendez KS. Health behavior changes during COVID-19 pandemic and subsequent “stay-athome” orders. Int J Environ Res Public Health 2020;17:6268.
18. Ok JH, Kim EJ, Kim SJ, Jeong SY. The relationship between metabolic syndrome components, metabolic syndrome and depression in Korean adults. Korean J Fam Pract 2017;7:800-6.
19. Capuron L, Su S, Miller AH, Bremner JD, Goldberg J, Vogt GJ, et al. Depressive symptoms and metabolic syndrome: is inflammation the underlying link? Biol Psychiatry 2008;64:896-900.
23. Fukushima N, Machida M, Kikuchi H, Amagasa S, Hayashi T, Odagiri Y, et al. Associations of working from home with occupational physical activity and sedentary behavior under the COVID-19 pandemic. J Occup Health 2021;63:e12212.
24. Wilms P, Schroder J, Reer R, Scheit L. The impact of “home office” work on physical activity and sedentary behavior during the COVID-19 pandemic: a systematic review. Int J Environ Res Public Health 2022;19:12344.
27. Bhutani S, vanDellen MR, Cooper JA. Longitudinal weight gain and related risk behaviors during the COVID-19 pandemic in adults in the US. Nutrients 2021;13:671.
28. Kwon JY, Song SW, Kim HN, Kang SG. Changes in body mass index and prevalence of metabolic syndrome during COVID-19 lockdown period. Korean J Fam Pract 2021;11:304-11.
30. Gim US, Cho JH. An impact analysis on the expenditures of purchased food in single households since COVID-19. Korean J Community Living Sci 2022;33:123-38. https://doi.org/10.7856/kjcls.2022. 33.1.123
Changes in the prevalence of metabolic syndrome before and after the COVID-19 pandemic according to household income levels
Figure. 1. Flowchart of the study participants. KNHANES, Korea National Health and Nutrition Examination Survey.
Figure. 2. Association between the prevalence of metabolic syndrome and household income before and after coronavirus disease 2019.
Figure. 1.
Figure. 2.
Changes in the prevalence of metabolic syndrome before and after the COVID-19 pandemic according to household income levels
Characteristic
COVID-19
P-value
Before (2019) (n=3,606)
After (2020) (n=3,234)
Age (y)
48.6±0.17
49.3±0.18
0.003
Male sex
1,557 (43.2)
1,421 (43.9)
0.526
Married, living together
2,948 (81.8)
2,507 (77.5)
<0.001
Income level
0.879
High
1,328 (36.8)
1,207 (37.3)
Middle
1,960 (54.4)
1,738 (53.7)
Low
318 (8.8)
289 (8.9)
Education status
0.933
Middle school or less
564 (15.6)
516 (16.0)
High school
1,272 (35.3)
1,142 (35.3)
College or more
1,768 (49.1)
1,576 (48.7)
Alcohol, current
1,262 (35.0)
1,177 (36.4)
0.228
Smoking, current
671 (18.6)
601 (18.6)
0.980
Aerobic exercise
1,588 (44.0)
1,382 (42.7)
0.277
Medical history
Diabetes mellitus
404 (11.2)
455 (14.1)
0.001
Hypertension
904 (25.1)
889 (27.7)
0.032
Dyslipidemia
870 (24.1)
841 (26.0)
0.073
Weight (kg)
65.5±0.21
66.4±0.23
0.007
Body mass index (kg/m2)
24.0±0.06
24.3±0.06
0.001
WC (cm)
83.7±0.17
84.5±0.18
0.001
Systolic blood pressure (mm Hg)
117.3±0.25
117.5±0.27
0.638
Diastolic blood pressure (mm Hg)
77.3±0.16
77.6±0.17
0.123
FBS (mg/dL)
100.9±0.37
101.8±0.39
0.075
TG (mg/dL)
137.0±1.81
139.6±2.11
0.341
HDL (mg/dL)
53.5±0.22
51.9±0.22
<0.001
Metabolic syndrome
961 (26.7)
978 (30.2)
0.001
Elevated blood pressure or treatment
1,326 (36.8)
1,235 (38.5)
0.157
Elevated FBS or treatment
1,349 (37.4)
1,286 (39.8)
0.046
Elevated TG or treatment
1,379 (38.2)
1,343 (41.5)
0.006
Low HDL
1,053 (29.2)
1,046 (32.3)
0.005
Elevated WC
634 (17.6)
673 (20.8)
0.001
Variable
Low (n=607)
P-value
Middle (n=3,698)
P-value
High (n=2,535)
P-value
Before (2019) (n=318)
After (2020) (n=289)
Before (2019) (n=1,960)
After (2020) (n=1,738)
Before (2019) (n=1,328)
After (2020) (n=1,207)
Age (y)
52.8±0.55
52.5±0.61
0.727
48.3±0.23
49.4±0.24
0.001
48.2±0.26
48.6±0.28
0.268
Male sex
117 (36.8)
130 (45.0)
0.040
832 (42.4)
729 (41.9)
0.757
608 (45.8)
562 (46.6)
0.695
Married, living together
164 (51.6)
128 (44.3)
0.351
1,626 (83.0)
1,371 (78.9)
0.034
1,158 (87.2)
1,008 (83.5)
0.065
Educational status
0.110
0.951
0.660
Middle school or less
120 (37.9)
112 (38.8)
349 (17.8)
312 (18.0)
95 (7.2)
92 (7.6)
High school
132 (41.6)
100 (34.6)
741 (37.8)
664 (38.2)
399 (30.0)
378 (31.3)
College or more
65 (20.5)
77 (26.6)
869 (44.4)
762 (43.8)
834 (62.8)
737 (61.1)
Alcohol, current
114 (35.8)
123 (42.6)
0.090
708 (36.1)
656 (37.7)
0.308
440 (33.1)
398 (33.0)
0.933
Smoking, current
83 (26.1)
77 (26.6)
0.879
384 (19.6)
323 (18.6)
0.437
204 (15.4)
201 (16.7)
0.375
Aerobic exercise
121 (38.1)
108 (37.4)
0.863
843 (43.0)
731 (42.1)
0.560
624 (47.0)
543 (45.0)
0.313
Medical history
Diabetes mellitus
55 (17.3)
66 (22.8)
0.179
223 (11.4)
238 (13.7)
0.086
126 (9.5)
151 (12.5)
0.029
Hypertension
118 (37.2)
104 (36.2)
0.948
481 (24.6)
480 (27.8)
0.063
305 (23.1)
305 (25.5)
0.242
Dyslipidemia
100 (31.4)
84 (29.1)
0.524
462 (23.6)
448 (25.8)
0.120
308 (23.2)
309 (25.6)
0.158
Weight (kg)
63.5±0.68
66.2±0.81
0.011
65.8±0.29
66.2±0.32
0.400
65.5±0.34
66.6±0.38
0.030
Body mass index (kg/m2)
24.0±0.21
24.7±0.23
0.031
24.2±0.08
24.4±0.09
0.059
23.8±0.09
24.1±0.10
0.017
WC (cm)
84.2±0.58
86.4±0.67
0.016
84.0±0.23
84.5±0.24
0.097
83.2±0.27
84.1±0.30
0.040
Systolic blood pressure (mm Hg)
120.5±0.95
119.7±0.91
0.585
117.7±0.34
118.0±0.37
0.562
116.0±0.40
116.2±0.44
0.697
Diastolic blood pressure (mm Hg)
77.9±0.58
77.7±0.58
0.888
77.3±0.21
77.7±0.24
0.234
77.1±0.26
77.5±0.28
0.236
FBS (mg/dL)
105.9±1.70
107.3±1.93
0.589
100.8±0.51
101.4±0.52
0.399
99.8±0.53
101.2±0.57
0.082
TG (mg/dL)
147.1±7.18
168.8±13.0
0.136
136.9±2.39
133.7±2.33
0.331
134.7±2.97
141.3±3.30
0.138
HDL (mg/dL)
53.0±0.71
49.4±0.74
<0.001
53.2±0.29
52.2±0.30
0.012
54.0±0.36
52.1±0.36
<0.001
Metabolic syndrome
100 (31.4)
114 (39.4)
0.039
543 (27.7)
498 (28.7)
0.522
318 (23.9)
366 (30.3)
<0.001
Elevated blood pressure
151 (47.5)
144 (50.2)
0.509
731 (37.3)
647 (37.5)
0.924
444 (33.5)
444 (37.2)
0.058
Elevated FBS
135 (42.5)
132 (45.7)
0.424
730 (37.2)
676 (38.9)
0.302
484 (36.4)
478 (39.6)
0.102
Elevated TG
151 (47.5)
146 (50.5)
0.455
757 (38.6)
701 (40.3)
0.288
471 (35.5)
496 (41.1)
0.004
Low HDL
113 (35.5)
113 (39.1)
0.364
595 (30.4)
565 (32.5)
0.159
345 (26.0)
368 (30.5)
0.012
Elevated WC
43 (13.5)
59 (20.4)
0.023
346 (17.7)
338 (19.4)
0.161
245 (18.4)
276 (22.9)
0.006
Income level
2019
2020
P for interaction
OR (95% CI)
P-value
OR (95% CI)
P-value
Household income
0.032
Low
1.46 (1.11–1.91)
0.006
1.50 (1.15–1.95)
0.003
Moderate
1.22 (1.04–1.43)
0.016
0.92 (0.79–1.08)
0.328
High
1.00 (Reference)
1.00 (Reference)
Adjusted household income
0.032
Low
1.11 (0.82–1.50)
0.487
1.13 (0.84–1.53)
0.427
Moderate
1.16 (0.98–1.39)
0.092
0.88 (0.74–1.05)
0.154
High
1.00 (Reference)
1.00 (Reference)
Table 1. Comparison before and after the COVID-19 lockdown in individuals aged 30–65 years (n=6,840)
Values are presented as mean±standard error for continuous variables or number (%) for categorical variables. Log substitution was performed with non-normal distribution.
P-values are from a t-test for continuous variables and chi-square test for categorical variables, respectively.
Table 2. Comparison before and after the COVID-19 lockdown in individuals aged 30–65 years according to household income (n=6,840)
Values are presented as mean±standard error for continuous variables or number (%) for categorical variables. Log substitution was performed with non-normal distribution. P-values are from a t-test for continuous variables and chisquare test for categorical variables, respectively.
Table 3. ORs for metabolic syndrome according to income levels
Adjusted for sex, age (year, continuous), education levels (less than middle school education, high school education, more than college education), smoking (non-smoker, current smoker), current alcohol (more than twice a week), and aerobic exercise. Calculated using logistic regression analysis.