INTRODUCTION
Cigarette smoking is a health-threatening behavior that not only increases the complications of cardiovascular and respiratory diseases but also has a causal relationship with other cancers, such as cancer of the lung, oral cavity, larynx, pharynx, esophagus, stomach, bladder, kidney, and pancreas [1]. It is also one of the leading preventable causes of deaths worldwide. An estimated 100 million people died due to tobacco-related diseases in the 20th century. This figure is expected to increase by 10 times through the 21st century [2].
Recent studies have shown that smoking could be associated with other health outcomes, including a poor health-related quality of life (HRQoL) [3]. HRQoL is a useful indicator of the health status of a population and could be used to evaluate the performance of the health system [4]. Previous studies that assessed the quality of life of smokers identified an inverse relationship between smoking and quality of life [1]. Although several studies have examined the associations between smoking and HRQOL, limited studies have investigated the effect of nicotine dependence on HRQOL of current smokers. Nicotine addiction can be measured using the Fagerstrom Test for Nicotine Dependence (FTND), and time to first cigarette (TTFC), which is one of the six measures of FTND [5]. Many studies have shown that TTFC is a powerful indicator of nicotine dependence [6]. Recent studies have reported that early TTFC is associated with hypertension [7], dyslipidemia [8], chronic obstructive pulmonary disease [9], and smoking-related cancers, such as head and neck cancer [10] and lung cancer [11]. Thus, the purpose of this study was to investigate the relationship between TTFC and HRQoL among Korean adult smokers. We hypothesized that shorter TTFC was associated with a poor HRQoL. That is, we speculated that nicotine dependence is associated not only with morbidity but also poor daily functioning and overall well-being. These findings from our study can be used to encourage individuals to quit smoking.
METHODS
1. Participants
We used data from the Korea National Health and Nutrition Survey (KNHANES) VII-1 conducted in 2016. The survey used a stratified, multilevel probability sample design for the population of South Korea. The KNHANES VII-1 extracted data from 23 households in 192 districts as a probability sample and examined about 10,000 household members including members 1-year-old or older by applying survey items according to life cycle characteristics.
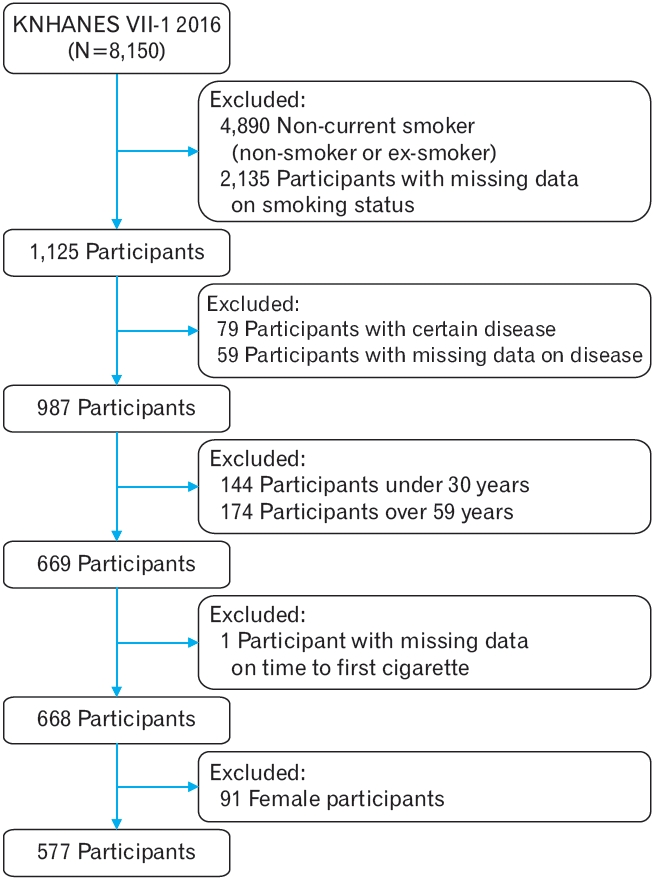
Of 8,150 participants in the KNHANES VII-1 (2016), we included 1,125 current smokers, after excluding non-smokers or ex-smokers or those who did not provide information about their smoking status. Since diseases such as osteoarthritis [12], rheumatoid arthritis [13], cancer [14], and depression [15] have been shown to lower HRQoL in several studies, patients with these diseases were excluded. Thus, participants with diseases included 40 cases of osteoarthritis, 10 cases of rheumatoid arthritis, seven cases of cancer, and 27 cases of depression. The seven cases of cancer included one gastric cancer, one colorectal cancer, one lung cancer, and four thyroid cancer patients. Previous studies have shown that nicotine dependence increases until the 50s, after which it starts declining [16]. We wanted to examine the relationship between nicotine dependence and HRQoL in the age group where nicotine dependence increases. The participants were limited to ages 30 to 59. Previous studies have shown that nicotine dependence may vary according to gender [17], and since the ratio of female smokers in this data is significantly smaller than that of males, only male smokers were included for the accurate analysis. The final sample included 577 current smokers aged 30ŌĆō59 years without any certain diseases (Figure 1).
The survey was conducted in accordance with the Helsinki Declaration. As the KNHANES datasets do not include identifiable personal information, studies using these data do not require approval from an institutional review board. Applications for exemption from approval have also been implemented (IRB no., H-1907-013-080).
2. Measures
1) Measurement of the HRQoL
HRQoL was assessed using the EuroQol-5 (EQ-5D) dimensions, which include mobility, self-care, usual activities, pain/discomfort, and anxiety/depression. Each dimension is evaluated in three levels (ŌĆ£no problem,ŌĆØ ŌĆ£some problems,ŌĆØ and ŌĆ£extreme/severe problemsŌĆØ). Answers to each dimension can be combined into 243 health states [18]. A combination of these items is used to calculate the health index score (EQ-5D index) using the Korean evaluation set developed by the Korea Centers for Disease Control and Prevention. The EQ-5D index is calculated as the weighted index value from complete health status 1 to the lowest score -0.171 [19]. We defined ŌĆ£some problemsŌĆØ or ŌĆ£extreme/severe problemsŌĆØ as ŌĆ£problematicŌĆØ in each dimension of the EQ-5D.
2) TTFC and smoking behavior
TTFC was first examined in the KNHANES VII-1. It was evaluated using the question, ŌĆ£How soon do you smoke first in the morning?ŌĆØ with four possible response choices (Ōēż5 minutes, 6ŌĆō30 minutes, 31ŌĆō60 minutes, and >60 minutes). Smoking behavior was assessed by self-report items on the age of initial smoking and the amount of cigarette smoking per day (CPD). Smoking duration (years) was calculated by subtracting the age of initial smoking from the current age. The pack-years of cigarette smoking were calculated as the average number of cigarette packs smoked per day multiplied by the number of years of daily smoking [7].
3) Covariates
Data on participantsŌĆÖ socio-demographic characteristics, physical activity, and mental status were obtained. We defined high-risk drinking as more than seven standard drinks of alcohol per day for more than twice per week for men and more than five standard drinks of alcohol per day for more than twice per week for women [7]. Aerobic physical activity was defined as one of the following: (1) more than 2 hours and 30 minutes of medium-intensity physical activity per week, (2) more than 1 hour and 15 minutes of high-intensity physical activity per week, (3) combining mid- and high-intensity physical activity (a 1-minute high-intensity activity was considered the same as a 2-minute medium-intensity activity) [7]. ParticipantsŌĆÖ economic status was classified as employed, unemployed, and non-economically active population. Monthly personal income was classified into four categories: lowest, lower-middle, upper-middle, or highest. The degree of stress was assessed using the question, ŌĆ£How much stress do you usually experience in your daily life?ŌĆØ Participants responded with four items with ŌĆ£I feel a lot,ŌĆØ ŌĆ£I feel moderate,ŌĆØ ŌĆ£I feel a little,ŌĆØ and ŌĆ£I feel very little.ŌĆØ Participants who responded with ŌĆ£I feel a lotŌĆØ and ŌĆ£I feel moderateŌĆØ were defined as ŌĆ£highly stressed.ŌĆØ Education levels were classified into four categories: elementary school graduation, middle school graduation, high school graduation, and university graduation. Current marital status was classified into single, living with a spouse, and separated/bereavement/divorced. The recent hospital visits were surveyed by asking if they had been treated in an outpatient clinic within the last 2 weeks.
3. Statistical Analyses
We compared the differences in participantsŌĆÖ characteristics according to their TTFC. The categorical variables were analyzed using PearsonŌĆÖs chi-square test, and the continuous variables were analyzed using generalized linear models. Data for continuous variables are presented as means┬▒standard deviation, and those for categorical variables are presented as means┬▒standard deviation (%, unweighted number). A multivariate-adjusted general linear analysis was subsequently performed to estimate how the HRQoL varies according to the TTFC. We calculated the mean difference and its 95% confidence interval (CI) in the EQ-5D index for each TTFC category (Ōēż5 minutes, 6ŌĆō30 minutes, 31ŌĆō60 minutes, and >60 minutes) using TTFC >60 minutes as reference. Finally, a logistic regression analysis was performed to identify which of the five dimensions of the EQ-5D had a negative effect on HRQoL as the TTFC decreased. The logistic regression analysis was performed after adjusting multivariate with ŌĆ£problematicŌĆØ as a dependent variable for each item of EQ-5D. Analyses were adjusted for age, smoking behavior (smoking pack-years), economic status, individual income, education level, marital status, hospital visit, stress level, regular exercise, and high-risk drinking. All analyses were performed using IBM SPSS ver. 21.0 (IBM Corp., Armonk, NY, USA). A P-value <0.05 was considered statistically significant.
RESULTS
1. General Characteristics of the Participants according to Their Time to First Cigarette
Characteristics of participants according to the TTFC are presented in Table 1. We confirmed that there were significant differences between each group according to TTFC in individual income (P=0.009), level of education (P<0.001), marital status (P<0.001), and aerobic physical activity (P=0.019). Moreover, we also found significant differences between each group by TTFC in the age of first cigarette (P<0.001), CPD (P<0.001), and smoking pack-years (P<0.001). In the EQ-5D index (P=0.011), there was a significant difference between each group according to TTFC. However, in each of the EQ-5D items, only pain/discomfort (P=0.047) showed a significant difference according to TTFC.
2. Association between Health-Related Quality of Life and Time to First Cigarette
The association between TTFC and HRQoL was examined without adjustment (model 1); with adjusting for age (model 2); with adjusting for age, and smoking behaviors (smoking pack-years) (model 3); and with adjusting for age, smoking behaviors (smoking pack-years), socioeconomic status, and health-related behaviors (model 4). Table 2 presents the results of the multivariate-adjusted general linear analysis of the mean differences in the EQ-5D indexes between the TTFC >60 minutes group and the remaining groups. In the fully adjusted model, the mean EQ-5D index of the 5 minutes< TTFC Ōēż30 minutes group was significantly lower than that of the TTFC >60 minutes group, and the 30 minutes< TTFC Ōēż60 minutes group also obtained the same result.
Among the five items of EQ-5D, shorter TTFC was associated with higher pain/discomfort and anxiety/depression, and this association was significant after adjusting for various confounders. As shown in model 4 in Table 3, the odds ratios were 2.14 (95% CI, 0.90ŌĆō5.09), 3.66 (95% CI, 1.59ŌĆō8.38), and 3.82 (95% CI, 1.39ŌĆō10.48) at 31ŌĆō60 minutes, 6ŌĆō30 minutes, and Ōēż5 minutes, respectively, compared to the TTFC >60 minutes group in the pain/discomfort dimension (P for trend= 0.006). For the anxiety/depression dimension, the odds ratios were 6.04 (95% CI, 1.21ŌĆō30.10), 4.64 (95% CI, 1.19ŌĆō18.16), and 7.58 (95% CI, 1.75ŌĆō32.88) at 31ŌĆō60 minutes, 6ŌĆō30 minutes, and Ōēż5 minutes, respectively, compared to the TTFC >60 minutes (P for trend=0.010).
DISCUSSION
This study examined the association between TTFC and HRQoL among 577 current male smokers in a nationally representative sample of Korean adults aged 30ŌĆō59 years. We found that shorter TTFC was associated with poor HRQoL after adjusting for other possible factors associated with smoking status and HRQoL.
Self-reported health status is an important indicator of morbidity and a stronger predictor of quality of life outcomes compared to other morbidity measures [20]. Moreover, self-report data collection is more cost-effective and can be more comprehensive compared to medical record reviews [21]. Much of the predictive cogency of FTND may be due to its first item, i.e., TTFC, which is more valid than any other single measure [22]. Thus, among the current smokers with high nicotine dependence, which can be identified with shorter TTFC, poor HRQoL could be a useful predictor of smoking-related morbidity [6].
Limited studies have investigated the effects of TTFC on self-reported health. Our findings on the relationship between TTFC and HRQoL are consistent with those of one previous study that used data from the National Adult Tobacco Surveys in the United States [6]. However, in the previous study, health status was evaluated using the item, ŌĆ£In general, you would consider your health to beŌĆØ with five possible answers (i.e., excellent, very good, good, fair, poor). Therefore, it was difficult to directly compare the results of the EQ-5D. To our knowledge, this study is the first to investigate the association between TTFC and HRQoL using EQ-5D.
In our study, except for the Ōēż5 minutes group, EQ-5D index decreased as the TTFC became shorter in the fully adjusted model, which means that the shorter the TTFC, the lower the HRQoL. The logistic regression model identified which of the five items in EQ-5D had a significant effect on reducing HRQoL as TTFC decreased. Among the five items of the EQ-5D, shorter TTFC was associated with higher pain/discomfort and anxiety/depression, and it was significant after adjusting for various confounders.
Similar to our study, one previous study found that smokers with high nicotine dependence, defined as the first tobacco smoking group within 30 minutes of awakening, exhibited a particularly high rate of depressive symptoms [23]. Several studies have reported that nicotine might be a pharmacologically active ingredient in tobacco smoking, and it is known to have direct and indirect effects on neurotransmitters related to major depressive disorder [23,24]. A study using an animal model showed that nicotine exposure does not regulate the hypothalamus-pituitary-adrenal system, causing cortisol hyper-administration and altering the activity of the relevant monoamine neurotransmitter system. This function regulates the response to stressors, which is normalized after nicotine elimination [25].
Furthermore, several studies have reported that nicotine leads to neuronal activation and hypersensitivity, causing pain [26], and elevated nicotine levels also promote changes in the cells related to the peripheral and central nociceptor sensitization [27]. One previous study showed that patients who experienced pain and are diagnosed with various pathologies and those with nicotine dependence had a higher degree of pain, which interfered with their daily life and mood. Patients with chronic tobacco use and those with severe nicotine dependence who experienced pain had significantly higher pain intensities compared to non-users [28].
Another previous study reported that cotinine is a metabolite of nicotine, and TTFC is a strong predictor of nicotine intake because shorter TTFC increases blood and urine cotinine levels [29]. Thus, it can be suggested that the shorter the TTFC, the stronger the action of nicotine against depression/anxiety and pain/discomfort. Based on these findings, it can be suggested that HRQoL deteriorates with shorter TTFC.
However, several studies have reported that baseline depression or anxiety may also be related to a type of subsequent smoking behavior, such as the onset of smoking itself, excessive smoking, or the shift from daily smoking to nicotine dependence. These bidirectional pathways of presumption are not mutually exclusive; however, a few studies have reported evidence for a bidirectional association between smoking and depression/anxiety [25]. Therefore, further research using different methods is required to confirm their causal relationship. Another study reported that individuals with chronic pain not medically described were more likely to become current smokers and nicotine dependents than were those without chronic pain. It is unclear whether chronic pain affects nicotine administration, but it was explained that smokers with chronic pain could induce smoking to alleviate discomfort or somatosensory conditions [30]. Therefore, further studies are needed to confirm the causal relationship between these factors.
The principal strength of our study was its use of a large-scale, nationally representative sample of middle-aged Korean male adults. We also adjusted for potential confounding factors that could affect the results.
However, this study has several limitations. First, the cross-sectional design of the study precludes any causal inferences about the relationship between TTFC and HRQoL. Therefore, longitudinal studies are necessary to examine a causal link between these two. Second, the sample consisted of respondents from South Korea alone. Since nicotine metabolism and smoking behaviors may vary across races, further studies of smokers from other racial groups and geographical areas should be conducted. Third, subjects were limited to middle-aged male current smokers. Therefore, further studies are needed to confirm whether nicotine dependence and HRQoL have a significant relationship, regardless of age, or only in certain age groups. Fourth, we did not consider mental disorders related to both nicotine dependence and HRQoL in this study. Thus, further studies must analyze the mental disorders related to nicotine dependence and HRQoL. Finally, we adjusted for various confounders in this study, but the possibility of residual confounders cannot be ruled out.
In conclusion, earlier TTFC is associated with higher depression/anxiety and pain/discomfort, which may lead to the deterioration of HRQoL. In other words, it not only increases morbidity but also reduces daily activities and overall well-being due to nicotine dependence. These findings could be used to motivate participants to quit smoking. The results of this study also suggest that smokers with poor HRQoL may not be able to control their nicotine dependence. In addition, physicians should provide mood control and pain management interventions in smoking cessation treatments to improve the HRQoL of smokers with high nicotine dependence.