INTRODUCTION
Nowadays, with increasing global life expectancy, women spend approximately one-third of their lives in postmenopause and experience some problems such as decreased estrogen levels, vascular instability, hot flushes and perspiration, osteoporosis, cardiovascular diseases, atrophy of the reproductive-urinary system, and psychosocial disorders [1].
Osteopenia is a bone disorder in which low bone mineral density (BMD) and impaired bone mineralization are observed. It is defined by bone densitometry as a T score of -1 to -2.5 [2]. Osteoporosis is a more severe reduction in BMD, and decreased bone strength is also observed. Primary osteoporosis is characterized by type I (caused by menopause and decreased estrogen levels) and type II (caused by aging) [3]. Affecting more than 200 million people worldwide, osteopenia, osteoporosis, and osteoporotic fractures are major health problems in old age [4]. According to the World Health Organization, osteoporosis has affected 75 million people in the United States, Europe, and Japan, with a prevalence of one per three menopausal women. Osteopenia and osteoporosis are highly prevalent conditions among postmenopausal women [5].
Some underlying causes of low BMD are genetic disorders, rheumatic and autoimmune diseases, hypogonadism, endocrine, hematologic, and gastrointestinal disorders, oxidative stress, and high levels of inflammatory factors [6]. The reactive oxygen species (ROS) and reactive nitrogen species are unstable and highly reactive molecules. These molecules can oxidize different macromolecules to achieve a stable state [7]. Oxidative stress is a condition in which, due to an increase in the production of free radicals and a decrease in the level of enzymatic or non-enzymatic antioxidants, the chance of free radical damage increases [8].
The most important enzymatic antioxidants are superoxide dismutase (SOD), glutathione peroxidase (GPx), and catalase. Among the non-enzymatic antioxidants are glutathione, vitamins C and E, carotenoids, and uric acid [9]. Malondialdehyde (MDA) is a final product of the oxidative decomposition of polyunsaturated fatty acids, initiated by free radicals. Therefore, it is commonly used as a biomarker of oxidative stress [10]. Some justifications for the effect of oxidative stress on bone density have been provided by relevant cellular-molecular studies. For instance, oxidative stress not only increases osteoclastogenesis but also inhibits osteoblast differentiation and thus bone formation. The major causes of low BMD in women are menopause and low steroid levels. Postmenopausal women are more vulnerable to oxidative stress than reproductive-age women because their oxidative balance is disrupted not only by aging but also by a decrease in 17 ╬▓-estradiol, an antioxidant [2].
According to the available literature, there is a lack of studies investigating the relationship between oxidative stress and low BMD (including, osteopenia and osteoporosis) in the early postmenopausal period. This study aimed to determine and compare oxidative stress biomarkers such as SOD, MDA, and total antioxidant capacity (TAC) in postmenopausal women with normal and low BMD (including osteopenia and osteoporosis).
METHODS
1. Study Design and Population
This cross-sectional, comparative study was aimed to determine and compare oxidative stress indices in postmenopausal women with normal BMD (n=120), primary osteopenia (n=82), and osteoporosis (n=86) in Tabriz-Iran, from July 2018 to January 2019. The inclusion criteria consisted of postmenopausal women aged 50ŌĆō65 years and living in Tabriz, experiencing the absence of regular menstrual cycles for 12 consecutive months, and having the ability to give a verbal response to questions. The exclusion criteria were as follows: participants (1) having bone disorder other than osteoporosis, metastatic bone diseases, malignancy, or renal diseases; (2) using drugs that may affect bone metabolism, such as intravenous bisphosphonate in the past 5 years or oral bisphosphonate in the past 6 months, total cumulative exposure of oral bisphosphonate >3 years or >1 month between 6ŌĆō12 months before the study; (3) using parathyroid hormone analogs in the past 12 months or strontium; (4) using hormonal or corticosteroid during the study period; (5) having hereditary diseases (such as hemophilia, thalassemia, and hemochromatosis), endocrine disorders (such as CushingŌĆÖs syndrome, hyperthyroidism, diabetes, and primary hyperthyroidism), chronic liver diseases, gastrointestinal diseases (such as cirrhosis, coeliac disease, CrohnŌĆÖs disease, complete gastrectomy, and stomach surgery), and (6) with a body mass index (BMI) of <18.5 kg/m2. Relevant information was obtained from medical history reviews, the results of laboratory tests, and visits conducted by an endocrinologist.
The estimated sample size was 98 for each group based on the study by S├Īnchez-Rodr├Łguez et al. [11] on total antioxidant status using G-Power software ver. 3.1.2 (Heinrich-Heine-Universit├żt D├╝sseldorf, D├╝sseldorf, Germany; http://www.gpower.hhu.de/) using the formula of estimating the difference of two independent means by considering the mean value in healthy women as 1.03, the mean value in women with osteoporosis as 0.96, the standard deviation (SD) in healthy women as 0.21, and SD in women with osteoporosis as 0.18, and one-tailed test, ╬▒ value as 0.05 and ╬▓ value as 0.2. Considering a dropout rate of 20%, the final sample size was increased to 120 for each group. The sampling began after obtaining the necessary permissions from the Ethics Committee. Tabriz has 87 healthcare centers. The integrated health system (SIB) of the Health Center of Tabriz provides information on postmenopausal women in Tabriz. The researcher recorded information such as the names of health care centers, phone numbers, and addresses of women through the SIB. Menopausal women entered the list from the first to the last number, and according to this list, 850 women were selected by simple random sampling.
The researcher contacted these subjects and invited them to participate in the study. After completing the eligibility criteria checklist, explaining the objectives and method of the research, and obtaining signed informed consent before participating in the study, initial laboratory tests were performed to exclude secondary causes of osteoporosis. Four hundred and forty-five eligible women underwent densitometry using dual-energy X-ray absorptiometry (DXA) in the lumbar spine and femoral neck areas. Among them, 120 postmenopausal women with normal BMD, 82 with osteopenia, and 86 with osteoporosis were selected.
2. Demographic, Reproductive, Anthropometric, and Physical Activity Questionnaire
The demographic questionnaire included items on age, age at menopause, BMI, education level, the adequacy of monthly income from the perspective of women, occupation status, smoking status, physical activity, exposure to sunlight, supplementation, and family history of osteoporotic fractures, hypertension, dyslipidemia, BMD, T-score, and Z-score in the lumbar spine and femoral neck. The weight of participants was measured using a leverage scale (Seca, Hamburg, Germany) with an accuracy of 0.1 kg. For this purpose, the participant was weighed with minimal clothing and without shoes. Height was measured using a wall-mounted stadiometer (Seca) with an accuracy of 0.1 cm in a standing position while touching the back of the head, shoulders, pelvis, legs, and heels to the wall. The BMI was obtained by dividing the weight (in kilograms) by the square of the height (in meters). The physical activity level was measured using the International Physical Activity QuestionnaireŌĆöShort Form. The validity and reliability of this tool have been confirmed among the Iranian population [12]. The questionnaire was completed through interviews, and the total physical activity was also calculated using the metabolic equivalents (minutes per week) method.
The BMD data of the anterior-posterior lumbar spine and proximal femoral neck were examined in the Densitometry Center of Sina Hospital in Tabriz by an experienced, trained technician using Hologic QDR 4500W (S/N 50266) DXA.
3. Biochemical Measurements
After an overnight fast of 12 hours, 5 mL blood samples of each participant were collected between 8 AM and 10 AM. The serum was completely separated by centrifugation at a speed of 2,500 for 10 minutes at room temperature and immediately frozen at 80┬░C for further examinations. The serum TAC level was measured using the Navand Salamat Kit (Naxifer-Total Antioxidant Capacity Assay Kit-TAC, NS-15012, NS-15013; Navand Salamat Co., Urmia, Iran). The working and stock standard solutions were prepared using the reagents and materials inside the package under the required conditions and temperature in the recommended dilutions according to the manufacturerŌĆÖs instructions. The light absorbance of the samples was then read after five minutes at a wavelength of 593 nm (interval range, 570ŌĆō630 nm) using a microplate reader (Bio Tek Instruments Inc., Winooski, VT, USA).
To measure the MDA level as a lipid peroxidation marker, thiobarbituric acid was utilized to produce a pink color, and spectrophotometry was used for measurement with the Navand Salamat Kit (Nalondi-Lipid Peroxidation Assay Kit-MDA, NS-15022, NS-15023; Navand Salamat Co.). The same method used for TAC was used in the preparation of the working and stock standard solutions. The light absorbance was then read at a wavelength of 550 nm using a microplate reader (Bio Tek Instruments Inc.).
The Navand Salamat Kit was used to measure SOD activity. The same method used for TAC was used in the preparation of the working and stock standard solutions. The light absorbance of the samples was then measured at a wavelength of 405 nm using the ELISA reader (Bio Tek Instruments Inc.).
4. Data Analysis
The central tendency indices (skewness, kurtosis, and SD) were utilized to assess the normality of quantitative variables. According to this test, the quantitative data on oxidative stress was normal. Descriptive statistics such as frequency, percentage, mean, and SD were employed to describe demographic, reproductive, anthropometric, and physical activity data. The chi-square, chi-square for trend, and one-way ANOVA analysis of variance tests were conducted to compare the collected data. The P-value <0.05 was considered statistically significant.
A binary logistic regression test adjusted for the confounding variables (age, age at menopause, BMI, and education level) was conducted to estimate the odds ratio (OR; 95% confidence interval [CI]) of osteopenia and osteoporosis regarding the serum oxidative stress biomarker levels. Confounding variables based on clinical judgment were entered into the model using the Enter method, and the model was fitted using the Hosmer and Lemeshow test.
5. Ethical Standards Disclosure
This study was conducted according to the guidelines laid down in the Declaration of Helsinki, and all procedures involving research study participants were approved by the Ethics Committee of the Tabriz University of Medical Sciences (IR. TBZMED.REC.1397.733). Written informed consent was obtained from all the participants.
RESULTS
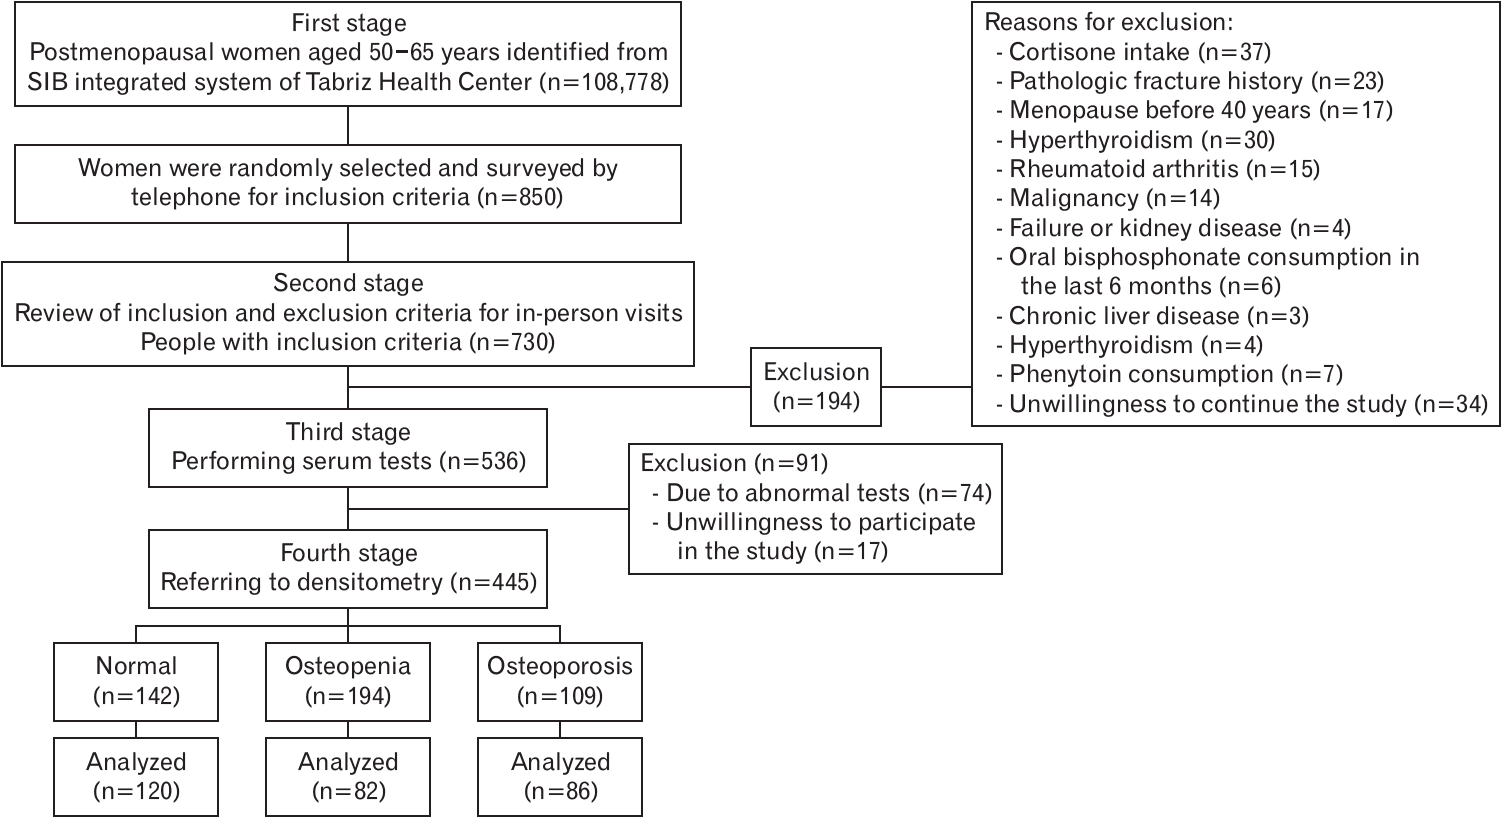
In this study, 120 postmenopausal women with normal BMD, 82 with osteopenia, and 86 with osteoporosis were compared for oxidative stress biomarkers. Figure 1 shows the flowchart for the selection of the study participants.
Table 1 shows the demographic information of the participants. The results showed a significant difference between the three groups in age (P<0.001), age at menopause (P=0.012), BMI (P<0.001), and educational level (P=0.005). There were significant differences between the normal group and the osteopenia and osteoporosis groups. However, no significant difference was found between the osteopenia and osteoporosis groups in terms of age, BMI, or menopausal age.
As shown in Table 2, the mean (SD) serum MDA levels in the normal BMD, osteopenia, and osteoporosis groups were 2.22┬▒0.79, 2.66┬▒0.88, and 2.69┬▒0.81 nmol/mL, respectively. The mean (SD) serum SOD activity in the normal BMD, osteopenia, and osteoporosis groups were 239.1┬▒96.6, 255.8┬▒38.5, and 200.2┬▒68.9 U/mL, respectively. The mean (SD) of serum TAC levels in the normal BMD, osteopenia, and osteoporosis groups were 1.49┬▒0.36, 1.48┬▒0.39, and 1.37┬▒0.42 mmol/mL, respectively. The SOD activity in the normal (P=0.001) and osteopenia (P<0.001) groups was significantly greater than that in the osteoporosis group. The serum MDA levels in the osteopenia (P=0.001) and osteoporosis (P<0.001) groups were significantly higher than those in the normal BMD group. The serum TAC level did not statistically differ between study groups.
According to the binary logistic regression model adjusted for confounders, higher SOD activity was associated with a lower risk of osteoporosis (adjusted OR [aOR], 0.991; 95% CI, 0.986 to 0.996). MDA was a significant risk factor for osteopenia in postmenopausal women (aOR, 1.702; 95% CI, 1.125 to 2.576). Moreover, higher TAC serum levels were associated with a lower risk of osteoporosis (aOR, 0.373; 95% CI, 0.141 to 0.986) (Table 3).
DISCUSSION
This is the first cross-sectional study to compare the serum levels of oxidative stress biomarkers in postmenopausal women, aged 50ŌĆō65 years, with normal BMD, osteopenia, and osteoporosis. The research results showed that MDA was a significant risk factor for osteopenia in postmenopausal women. The risk of osteopenia increased by 70% with an increase of one unit in MDA level. An increase in SOD activity and serum TAC levels by one unit was associated with a 60% and 1% lower risk of osteoporosis, respectively.
Studies have shown that ROS plays a key role in the progression of inflammatory disorders [13]. ROS has recently been reported as a risk factor for osteoporosis. ROS is associated with osteoporosis with excessive apoptosis, which in turn leads to osteoclastogenesis that ultimately leads to increased turnover of bone remodeling and bone loss [14]. Some experimental and animal studies have reported that oxidative stress reduces bone density because of the involvement of free radicals in bone resorption [13]. If the antioxidant system fails to protect against oxidative stress, free radicals produced will damage macromolecules such as lipids, proteins, and DNA [15]. A study in India showed that oxidative stress and decreased levels of antioxidants in the circulatory system were correlated with reduced BMD or osteoporosis [16]. Even though it is proven that oxidative stress reduces bone density through excessive apoptosis of osteocytes, more studies should be conducted to specify the cellular-molecular mechanisms that create a relationship between oxidative stress, antioxidants, and bone metabolism [17]. The results from epidemiological studies on humans and animals indicate the effect of advanced age on increasing the production of free oxygen radicals and reducing bone density. Other risk factors for oxidative stress are lifestyle (use of tobacco and alcohol), environmental factors (ultraviolet radiation), pollutants, and toxins. Under physiological conditions, cells inhibit oxidative stress using internal defense mechanisms such as GPx and SOD and external antioxidants including those in fruits, vegetables, and vitamins (C and E). However, the exact bone degradation mechanism continues to remain unknown [18].
The estrogen levels of obese postmenopausal women are higher than those of other women [1]. During menopause, when estrogen (which acts as an antioxidant) or TAC levels decrease, inflammatory cytokines and oxidative stress markers such as MDA, tumor necrosis factor-╬▒, and interleukin-6 are activated, leads to osteoporosis [19]. One of the menopausal complications is increased osteoclast activity because of reduced estrogen levels, which last for 10ŌĆō15 years. Most bone fractures occur in this age range, i.e., between 60 and 75 years [15]. In the absence of estrogen, osteoclasts are more active and bone loss increases, which results in thinner bones. As a result, annual bone loss increases between 2% and 3% in postmenopausal women because of lower estrogen levels [20].
In this study, the MDA levels were significantly higher in participants with osteopenia and osteoporosis than in participants with normal BMD. MDA levels were significantly higher in women with osteoporosis than in control women in a case-control study on postmenopausal women with and without osteoporosis in Turkey (P<0.001). Furthermore, there was no significant difference in TAC activity between the two groups [21]. This finding is consistent with those of the present study. Although in the present study the serum TAC levels did not statistically differ between study groups, the results of the logistic regression test showed that a higher serum TAC level was associated with a lower risk of osteoporosis. In a study conducted in Korea, the results revealed that high dietary TAC was significantly inversely associated with the risk of osteoporosis in postmenopausal women [22]. Another case-control study was conducted on men and women aged 20ŌĆō65 years. In the mentioned study, the case group included postmenopausal women with osteoporosis or women with renal dystrophy and bone fractures, whereas the control group consisted of healthy men and women aged 20ŌĆō40 years. The results showed that the MDA levels were significantly higher in the case group than in the control group, a finding that is consistent with the results of the present study. However, the SOD levels were significantly lower in the case group [17]. This lack of significance in the present study can be attributed in part to the difference in the control group, which included non-menopausal women, and differences in the sample sizes of the study groups.
The results of a case-control study on women with osteoporosis and healthy women showed that plasma SOD activity was significantly higher in the case group. This finding is inconsistent with the results of the present study [21]. Yalin et al. [23] showed in their study on healthy men and those with primary osteoporosis that SOD and MDA enzymatic activities in the case group outperformed those of the control group. This finding is inconsistent with the present study of SOD activity. Contrary to their study, the present study was conducted on postmenopausal women aged 50ŌĆō65 years. Given the role of free radicals in bone metabolism, the mentioned results concerning SOD require further investigation. In accordance with our findings, the results of one systematic review about identifying the association between oxidative stress-related biomarkers and osteoporosis, which included 17 studies, showed lower SOD activity in postmenopausal women with osteoporosis [24]. Moreover, the results of a cross-sectional study conducted on Indian postmenopausal women showed that the SOD level was significantly lower in the osteoporosis group [25].
In this study, we investigated the relationship of oxidative stress biomarkers in postmenopausal women with normal BMD, osteopenia, and osteoporosis aged 50ŌĆō65 years; secondary causes of reduced bone density were excluded. However, this study cannot be generalized to the whole population. Therefore, future studies are recommended to analyze this relationship among other age groups and both genders. We did not measure the serum estrogen levels in this study. Future studies are recommended to determine the probable mechanisms and other risk factors. The number of women in the osteopenia and osteoporosis groups who were evaluated for oxidative stress biomarkers was less than the number that was calculated for the sample size.
In conclusion, higher SOD activity and serum TAC levels were significantly associated with a lower risk of osteoporosis in the postmenopausal women who were studied. Moreover, the risk of osteopenia increased significantly with higher serum MDA levels.