INTRODUCTION
There are four key parts of primary care: first contact, continuity, comprehensiveness, and coordination [1]. As the burden of diseases per patient increases in an aging population [2,3], comprehensive primary care has become more important. Comprehensive care means that all the medical aspects of one patient are dealt with by their primary care physician [4], A more comprehensive primary care enables lower medical costs, less admission rates, and better patient satisfaction via greater efficiency [5]. Without comprehensive primary care, patients would experience fragmented care across numerous specialists. In Korea, which has lower medical costs and a surplus of specialists, fragmented care has long been a threat for primary care.
To improve the comprehensiveness aspect of primary care, it must be well defined and analyzed. Until now, studies on comprehensiveness were based on surveys of patients and clinicians [6-9]. Most surveys are focused on the scope of service provided; others attempted to measure whether acute or chronic symptoms are managed [10]. Although these studies shed light on important factors for assessing comprehensiveness, they have several limitations: collected data are based on relatively small cohorts; results are subjected to individualsŌĆÖ experience and therefore cannot be standardized.
Recently, some studies have measured the comprehensiveness of primary care among physicians in different specialties using claim data from the national health system [7,11]. A few studies utilized the International Classification of Diseases (ICD) codes or diagnostic clusters (120 groups of diagnostic codes with similar pathophysiology and similar treatment) to measure the conditions treated. However, these methods cannot include the importance of each disease in primary care environment; moreover, there was no set standard based on which they could evaluate comprehensiveness within the practice of one primary care physician.
This study aims to define and standardize the comprehensiveness of primary care through statistical analysis of data extracted from the National Health Insurance Service (NHIS) that focused on the diseases commonly occurring in a primary care environment. Furthermore, we hope to describe and assess the factors of comprehensiveness with qualitative indices from our analysis.
METHODS
1. Data Source and Study Population
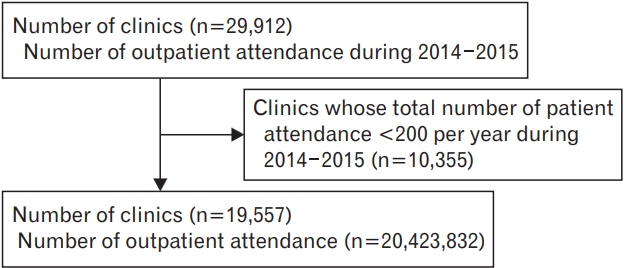
The NHIS National Sample Cohort is a population-based cohort, which was sampled in the 2002 NHIS database and followed up until 2015. NHIS enrollees cover approximately 97% of all Koreans, and this cohort includes 1,000,000 individualsŌĆöapproximately a 2% random sample of NHIS enrollees. We used data collected from January 2014 to December 2015, including 22,275,040 outpatient attendances at 29,912 office-based clinics.
From this pool, we excluded the clinics where the number of outpatient attendees was less than 400 over a 2-year period, to eliminate outliers. Given that the database is based on 2% random sampling, 400 visits can be interpreted as approximately 20,000 visits before sampling. This translates to approximately 30ŌĆō40 patients per each business day, which is much less than the average number of patients in the primary care environment in Korea. We finally included 19,557 primary care clinics and 20,423,832 outpatient attendances (Figure 1).
The Korean government has created a list of common diseases to encourage people to attend primary care clinics if they have those specific medical problems. If patients attend general hospitals with these medical problems, they would need to pay higher charges for their medication. The list comprises 52 groups of diseases, which are termed ŌĆśsimple or minor disease groupsŌĆÖ (SMDGs). The classification of diagnosis is based on the ICD-10 criteria.
2. Measures
1) Comprehensiveness
We calculated the number of SMDGs dealt with at each primary care clinic at least once over a 2-year period based on the diagnosis records. We assessed the comprehensiveness with this number. The more SMDGs they manage, the more the clinics are considered to provide comprehensive primary care. We categorized all the clinics into four groups based on the number of SMDGs each clinic manages, with cutoff values of lower quartile (25th percentile), median, and higher quartile (75th percentile). Because there are no defined measures for comprehensiveness, we used this score and tried to utilize the 25th percentile, median, and 75th percentile as the cutoff values.
2) Clinic factors
Clinic information included the number of physicians and nurses, the presence of a facility for hospitalization, geographical location, and specialty of each physician. The information for each clinic was used based on the data from 2014, so possible movement or closure of the clinic was not considered in the analysis. Specialty was defined as the single medical specialty the clinic registered to the administrative authority, even if the clinic hired several medical doctors who had different specialties. Only specialties responsible for more than 2% of primary care were included in the study. In Korea, general practitioner refers to a physician who has not received residency training.
3) Most common SMDGs
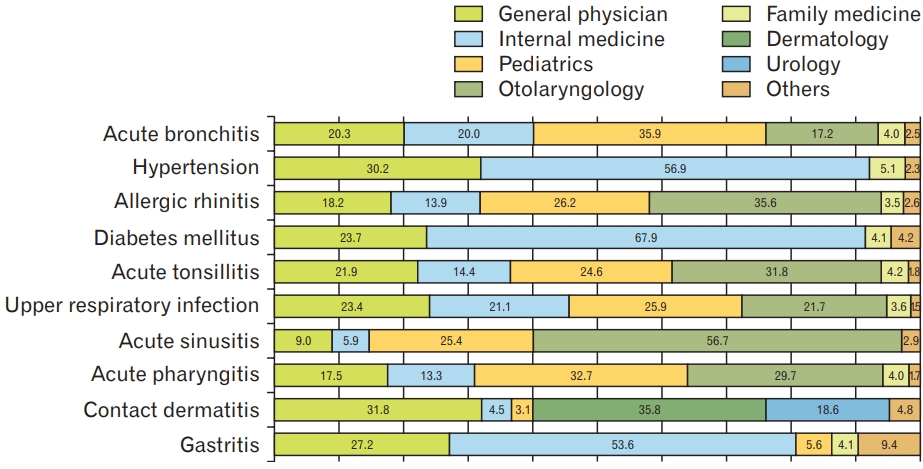
We ranked the most common 10 SMDGs among 52 SMDGs to identify which SMDGs were most common in outpatient-based clinics. We also measured which specialties are engaged in treating those diseases. Specialties that were responsible for managing more than 1% patients of each SMDG are expressed on the figure.
3. Statistical Analysis
We employed the chi-square test to discern differences among comprehensiveness groups for each characteristic. We used multivariable logistic regression to discern the elements that affected greater continuity. We divided the subjects into two groups, the higher comprehensiveness group and lower comprehensiveness group, using the median value as the cutoff. That is, we defined the higher comprehensiveness group as clinics that provide treatment for greater than or equal to 14 SMDGs and the lower one as clinics that provide treatment for lesser than 14 SMDGs. Then, we performed regressions with all the variables from the baseline characteristics included in the analysis. Multivariate analyses were performed with adjustments for specialty of physician, number of physicians and registered nurses, and facility for hospitalization. Only specialties responsible for more than 3% of primary care were included in the analysis. Odds ratios (ORs) and their 95% confidence intervals (CI) were measured. All analyses were performed with the SAS Enterprise Guide ver. 7.1 (SAS Institute Inc., Cary, NC, USA). Two-sided P-values <0.05 were considered statistically significant.
RESULTS
1. Characteristics of Clinics
A total of 19,557 primary care clinics were included in the study. Of the study population, most of the clinic physicians were general practitioners (4,514 clinics, 23.1%), followed by internal medicine physicians (3,686 clinics, 18.8%) and otolaryngologists (2,050, 10.5%). Among the clinics studied, 20.8% were located in Seoul, the capital city, and 21.8% were located in the Gyeonggi province. Most clinics had a single physician (82.8%) and no registered nurses (74.7%). Most of the clinics (76.7%) did not have facilities for hospitalization.
We measured comprehensiveness as the number of SMDGs each clinic provided treatment for at least once over the 2-year period. Among 52 SMDGs, clinics provided treatment for an average of 14 SMDGs (standard deviation=7.3), which is the same as the median value, with eight SMDGs for the 25th percentile and 19 SMDGs for the 75th percentile. We categorized the clinics into four groups according to the level of comprehensiveness using the cutoff values of 25th percentile, median, and 75th percentile. Group 1, which serves from 0 to 7 SMDGs; group 2, from 8 to 13 SMDGs; group 3, from 14 to 18; and group 4, more than 18 SMDGs.
Specialty of the physician, location of the clinic, number of physicians and registered nurses, and presence of hospitalization facility showed significant differences in distributions among the four groups (P<0.05) (Table 1).
2. Most Common Simple or Minor Disease Groups
We identified how many times each SMDGs were treated over the 2-year period. The 10 most common SMDGs were acute bronchitis, hypertension, allergic rhinitis, diabetes mellitus, acute tonsillitis, upper respiratory infection, acute sinusitis, acute pharyngitis, allergic contact dermatitis, and gastritis (Supplementary Table 1). Diseases related to respiratory infection, including acute bronchitis, acute tonsillitis, upper respiratory infection, acute sinusitis, and acute pharyngitis, were usually managed by general practitioners, internal medicine physicians, pediatricians, and otolaryngologists. Chronic diseases such as hypertension and diabetes mellitus were primarily managed by internal medicine physicians (more than 50%), followed by general practitioners and family medicine physicians. General practitioners and internal medicine physicians were found to be engaged in all 10 of the most common SMDGs; family medicine physicians, otolaryngologists, and pediatricians were found to be engaged in most of the 10 commonest SMDGs (Figure 2).
3. Factors Related to Comprehensiveness
We divided all the clinics into two groups: the higher comprehensive group and lower comprehensive group. We figured out which factors of the clinics were related to higher comprehensiveness. Compared to general practitioners, internal medicine physicians presented higher comprehensiveness, with an OR of 2.29 (95% CI, 2.03ŌĆō2.59), and family medicine physicians illustrated higher comprehensiveness (OR, 4.96; 95% CI, 3.59ŌĆō6.83). Other specialties showed lower comprehensiveness than general practitioners. Clinics located in the capital city and metropolitan area were more likely to show lower comprehensiveness, but this difference was not statistically significant. The clinics with more doctors and hospitalization facility showed higher comprehensiveness. Regarding the number of registered nurses, clinics hiring a single nurse showed higher comprehensiveness, but clinics hiring two or more nurses showed significantly lower comprehensiveness (Table 2).
When we used the 1st quartile as the cutoff value, which is eight SMDGs, we found that pediatricians showed much higher comprehensiveness than general practitioners when compared to the result above. This was because this list of SMDGs comprised diseases that were common in adults, not in children; therefore, the number of SMDGs treated by pediatricians was automatically limited. Ophthalmologists and dermatologists are considered to provide highly specialized care, so they show very low comprehensiveness.
DISCUSSION
In our study, internal medicine and family medicine physicians were found to provide more comprehensive care than general practitioners. Our findings suggest that the comprehensiveness of primary care increases in proportion to the number of doctors in a clinic.
In Korea, general practitioners, internists, and family medicine physicians deal with a large number of diseases. Internal medicine physicians and family medicine physicians showed more comprehensiveness in their care compared to general practitioners. This is because the two specialtiesŌĆÖ areas encompass the majority of illnesses dealt with in primary care. Furthermore, patients expect better care from specialists and therefore tend to rely on them for personal medical care [12-14].
Our result showed lower comprehensiveness of primary care within the capital city (Seoul) and the metropolitan cities (administrative district of more than 1 million population); in comparison, higher comprehensiveness was seen in the Gyeonggi province. The reason may be the smaller density of clinic per person ratio in the Gyeonggi province compared to the density in the capital and metropolitan cities.
The number of physicians per clinic also contributed to the comprehensiveness of primary care. Each physician has different capabilities [15]; thus, hiring more physicians can enable the clinic to provide care for a greater variety of patients. Therefore, we suggest adopting group practice within a clinic to increase comprehensiveness. Studies from other countries already suggest that team practice leads to higher quality care, more accurate diagnosis, and increased satisfaction of patients in primary care settings [14,16,17].
A larger number of registered nurses per clinic is associated with lower comprehensiveness. However, in Korea, it is very common for assisting nurses to replace registered nurses at primary care clinics. Most clinics hire only assisting nurses, not registered nurses. According to our results, almost 75% of clinics do not hire registered nurses. Although the data does not include the assisting nursesŌĆÖ employment status, a considerable number of those clinics are assumed to hire assisting nurses based on primary care circumstances. Since the number of registered nurses does not reflect the accurate status of clinic personnel, it is difficult to comprehensively understand their relationship. Further research on this topic is required by collecting sufficient employment-related data.
This study defines the comprehensiveness of primary care using data selected from the NHIS. To the best of our knowledge, this is the first study to assess different factors related to comprehensiveness using statistical analysis [6,7,9].
However, there are limitations to this study. The SMDGs used in this study were chosen and adapted to suit the Korean health care scenario, and may not be consistent with the groups of diseases that need to be treated in primary care settings elsewhere [18,19]. For example, the lower comprehensiveness of pediatrics was because only a few of the SMDG diseases in this study were relevant to pediatric patients. Therefore, it is important to first establish the group of diseases seen in primary care settings; then, the comprehensiveness of primary care settings can be defined based on the established diseases.
Lastly, our study is based on diagnosis-related data extracted from Korean claim data, and thus has yet to be implemented abroad. Because claim data are heavily influenced by insurance standards, differing insurance standards in various medical systems may reveal entirely different results. This will need further studies.
In conclusion, although a variety of specialties provide outpatient services in Korea, general physicians, internal medicine physicians, and family medicine physicians were found to provide comprehensive medical care; moreover, clinics located in metropolitan areas and the capital city have lower comprehensiveness. The number of physicians is related to the higher comprehensiveness of clinics.